The Last 0.2%: Solar, Batteries and the Cost of Eliminating Gas
A ten-year thought experiment across South Australia, Victoria and NSW

Explaining climate science without the hysteria.
Live Last read · last published · next check
A ten-year thought experiment across South Australia, Victoria and NSW
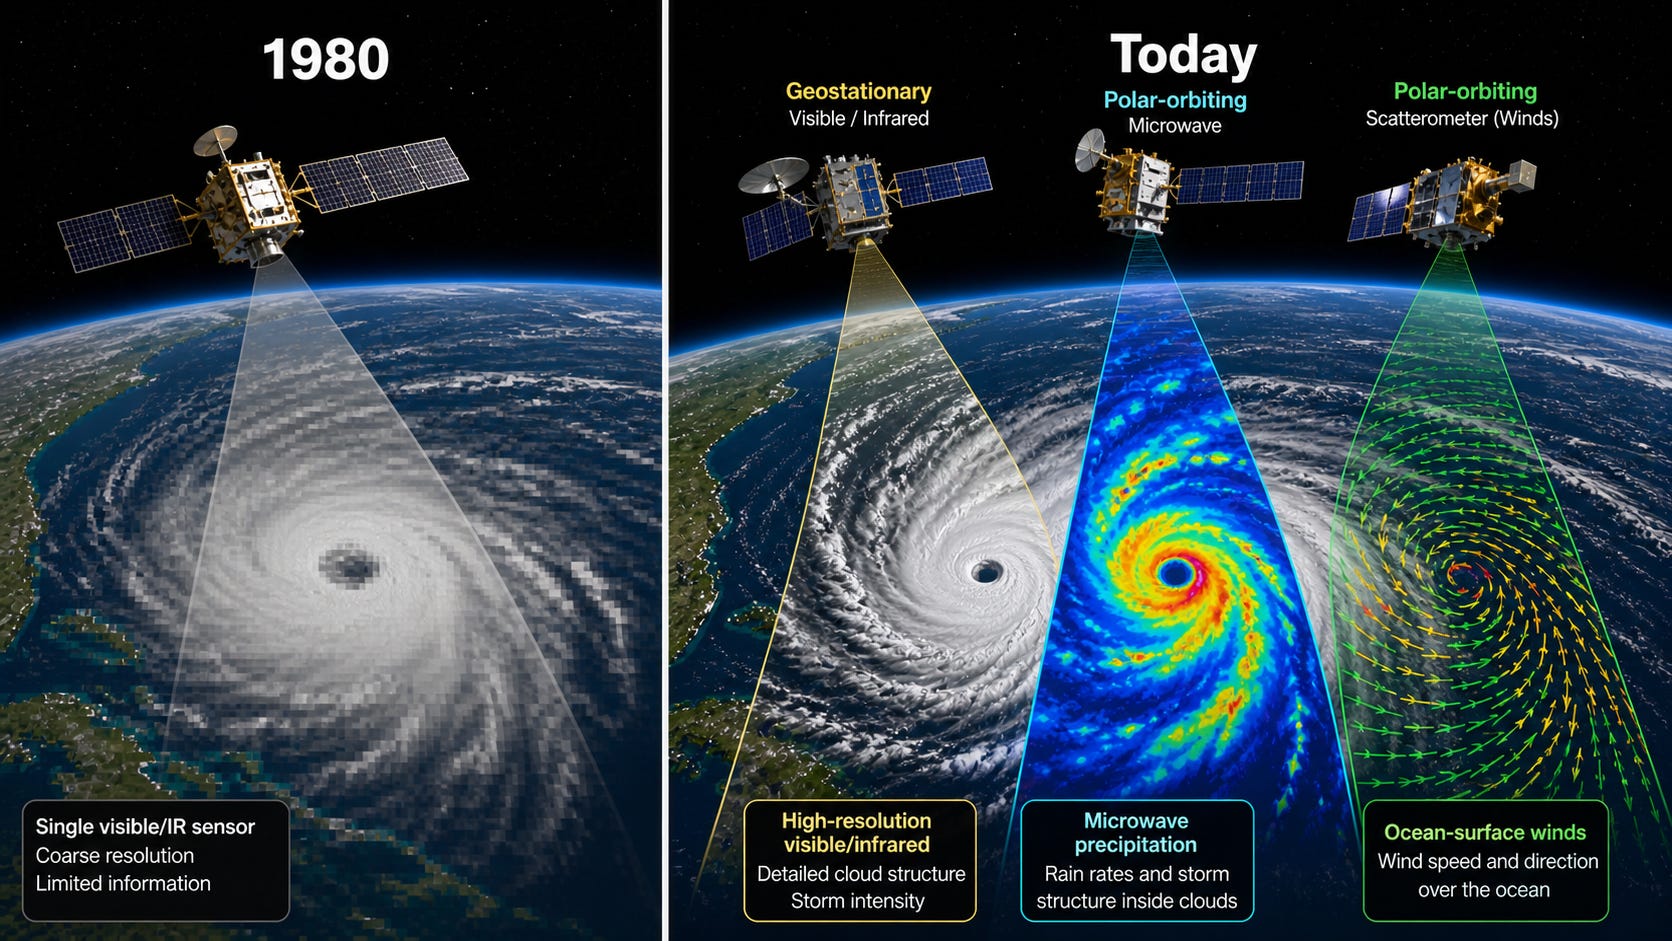
In Recent Trends in Tropical Cyclones last year we looked at the data for 1990-2024 from IBTrACS and compared this to a paper, Trends in Global Tropical Cyclone Activity: 1990–2021, Philip Klotzbach et al (2022).
Over the past few articles, we’ve looked closely at South Australia, which has become one of the clearest real-world examples of what a high-renewables power system looks like.
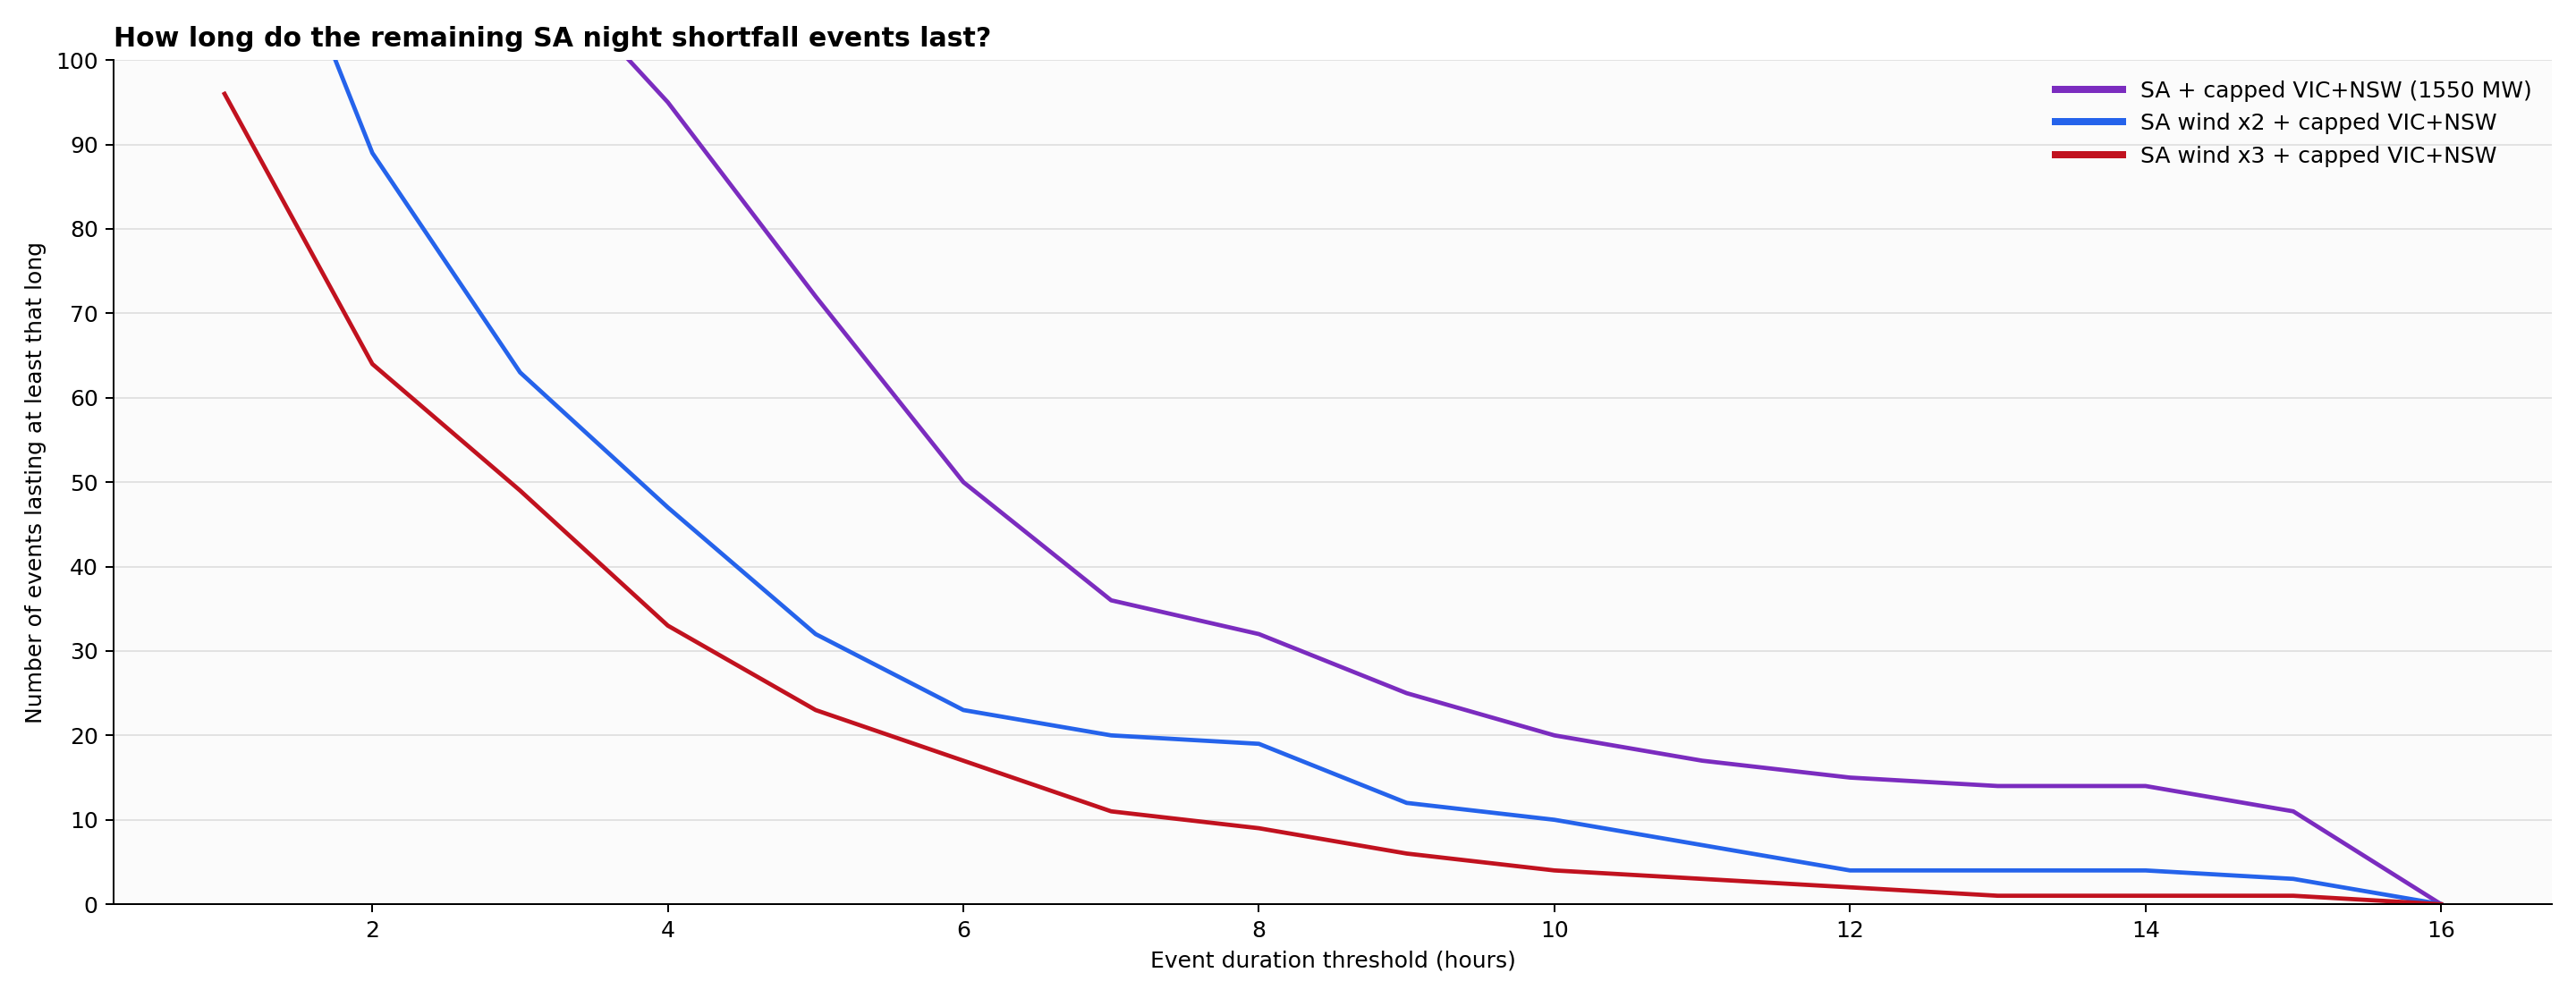
In the last two articles I looked at South Australia after sunset.
More on South Australia
One of the standard objections to a highly renewable South Australian grid goes something like this:
A Reading Guide to My Recent Renewables Posts
In the South Australia series we’ve watched the daily rhythm of a high-solar grid:
In our previous articles looking at South Australia’s grid, we’ve explored the market machinery.
Negative electricity prices sound like a malfunction in reality.