
In the last two articles I looked at South Australia after sunset.
First: how far can wind and interconnectors carry South Australia once solar is gone? Then: when the system is short, how many hours in a row does that shortfall last? Those pieces found something real and encouraging. Wind plus interconnectors can make a very large dent in South Australia’s night problem. But they also found the tail: long difficult runs still appear, especially in bad wind years.
The obvious next question is whether South Australia is a template.
Can you tell the same story for Victoria?
That matters because South Australia is a small state attached to larger neighbours. Victoria is not. Victoria is itself a large load centre. If the South Australian result is partly “renewables plus interconnectors work”, that is interesting. But if it is partly “small region leaning on bigger regions”, that is a different story.
So this time I ran the same kind of thought experiment for Victoria.
And the result is: South Australia is not a template.
If I simply compare Victoria and South Australia as they are today, Victoria looks much worse. But that is not quite a fair test, because Victoria’s wind fleet is not nearly as large relative to its own demand.
That is easy to miss because Victoria’s wind fleet is bigger in absolute terms.
But absolute terms are not the point.
In this 2025 night analysis, Victoria’s selected-hour demand averages about 5.4 GW and peaks around 9.8 GW, while the Victorian wind fleet in the model is about 5.5 GW. So Victoria’s current wind fleet is roughly the same size as average selected-night demand, but only a bit more than half of selected-night peak demand. By comparison, South Australia’s wind fleet is much larger relative to the size of its own load.
So before asking whether Victoria “works like South Australia”, I wanted to put Victoria on something closer to a South Australian footing.
The simplest way to do that was to scale Victoria’s wind fleet up until its wind-to-demand ratio matched South Australia’s on a peak-demand basis.
That produced a factor of about 1.44 times today’s Victorian wind fleet.
So there are really four Victoria cases in this article:
today’s Victoria wind plus today’s practical network
a Victoria wind fleet scaled up to South Australia’s relative footing
twice that SA-relative Victorian fleet
three times that SA-relative Victorian fleet
And then I asked what happens if Victoria also gets a stronger NSW link via a stylised VNI West future.
The first graph is the blunt one.
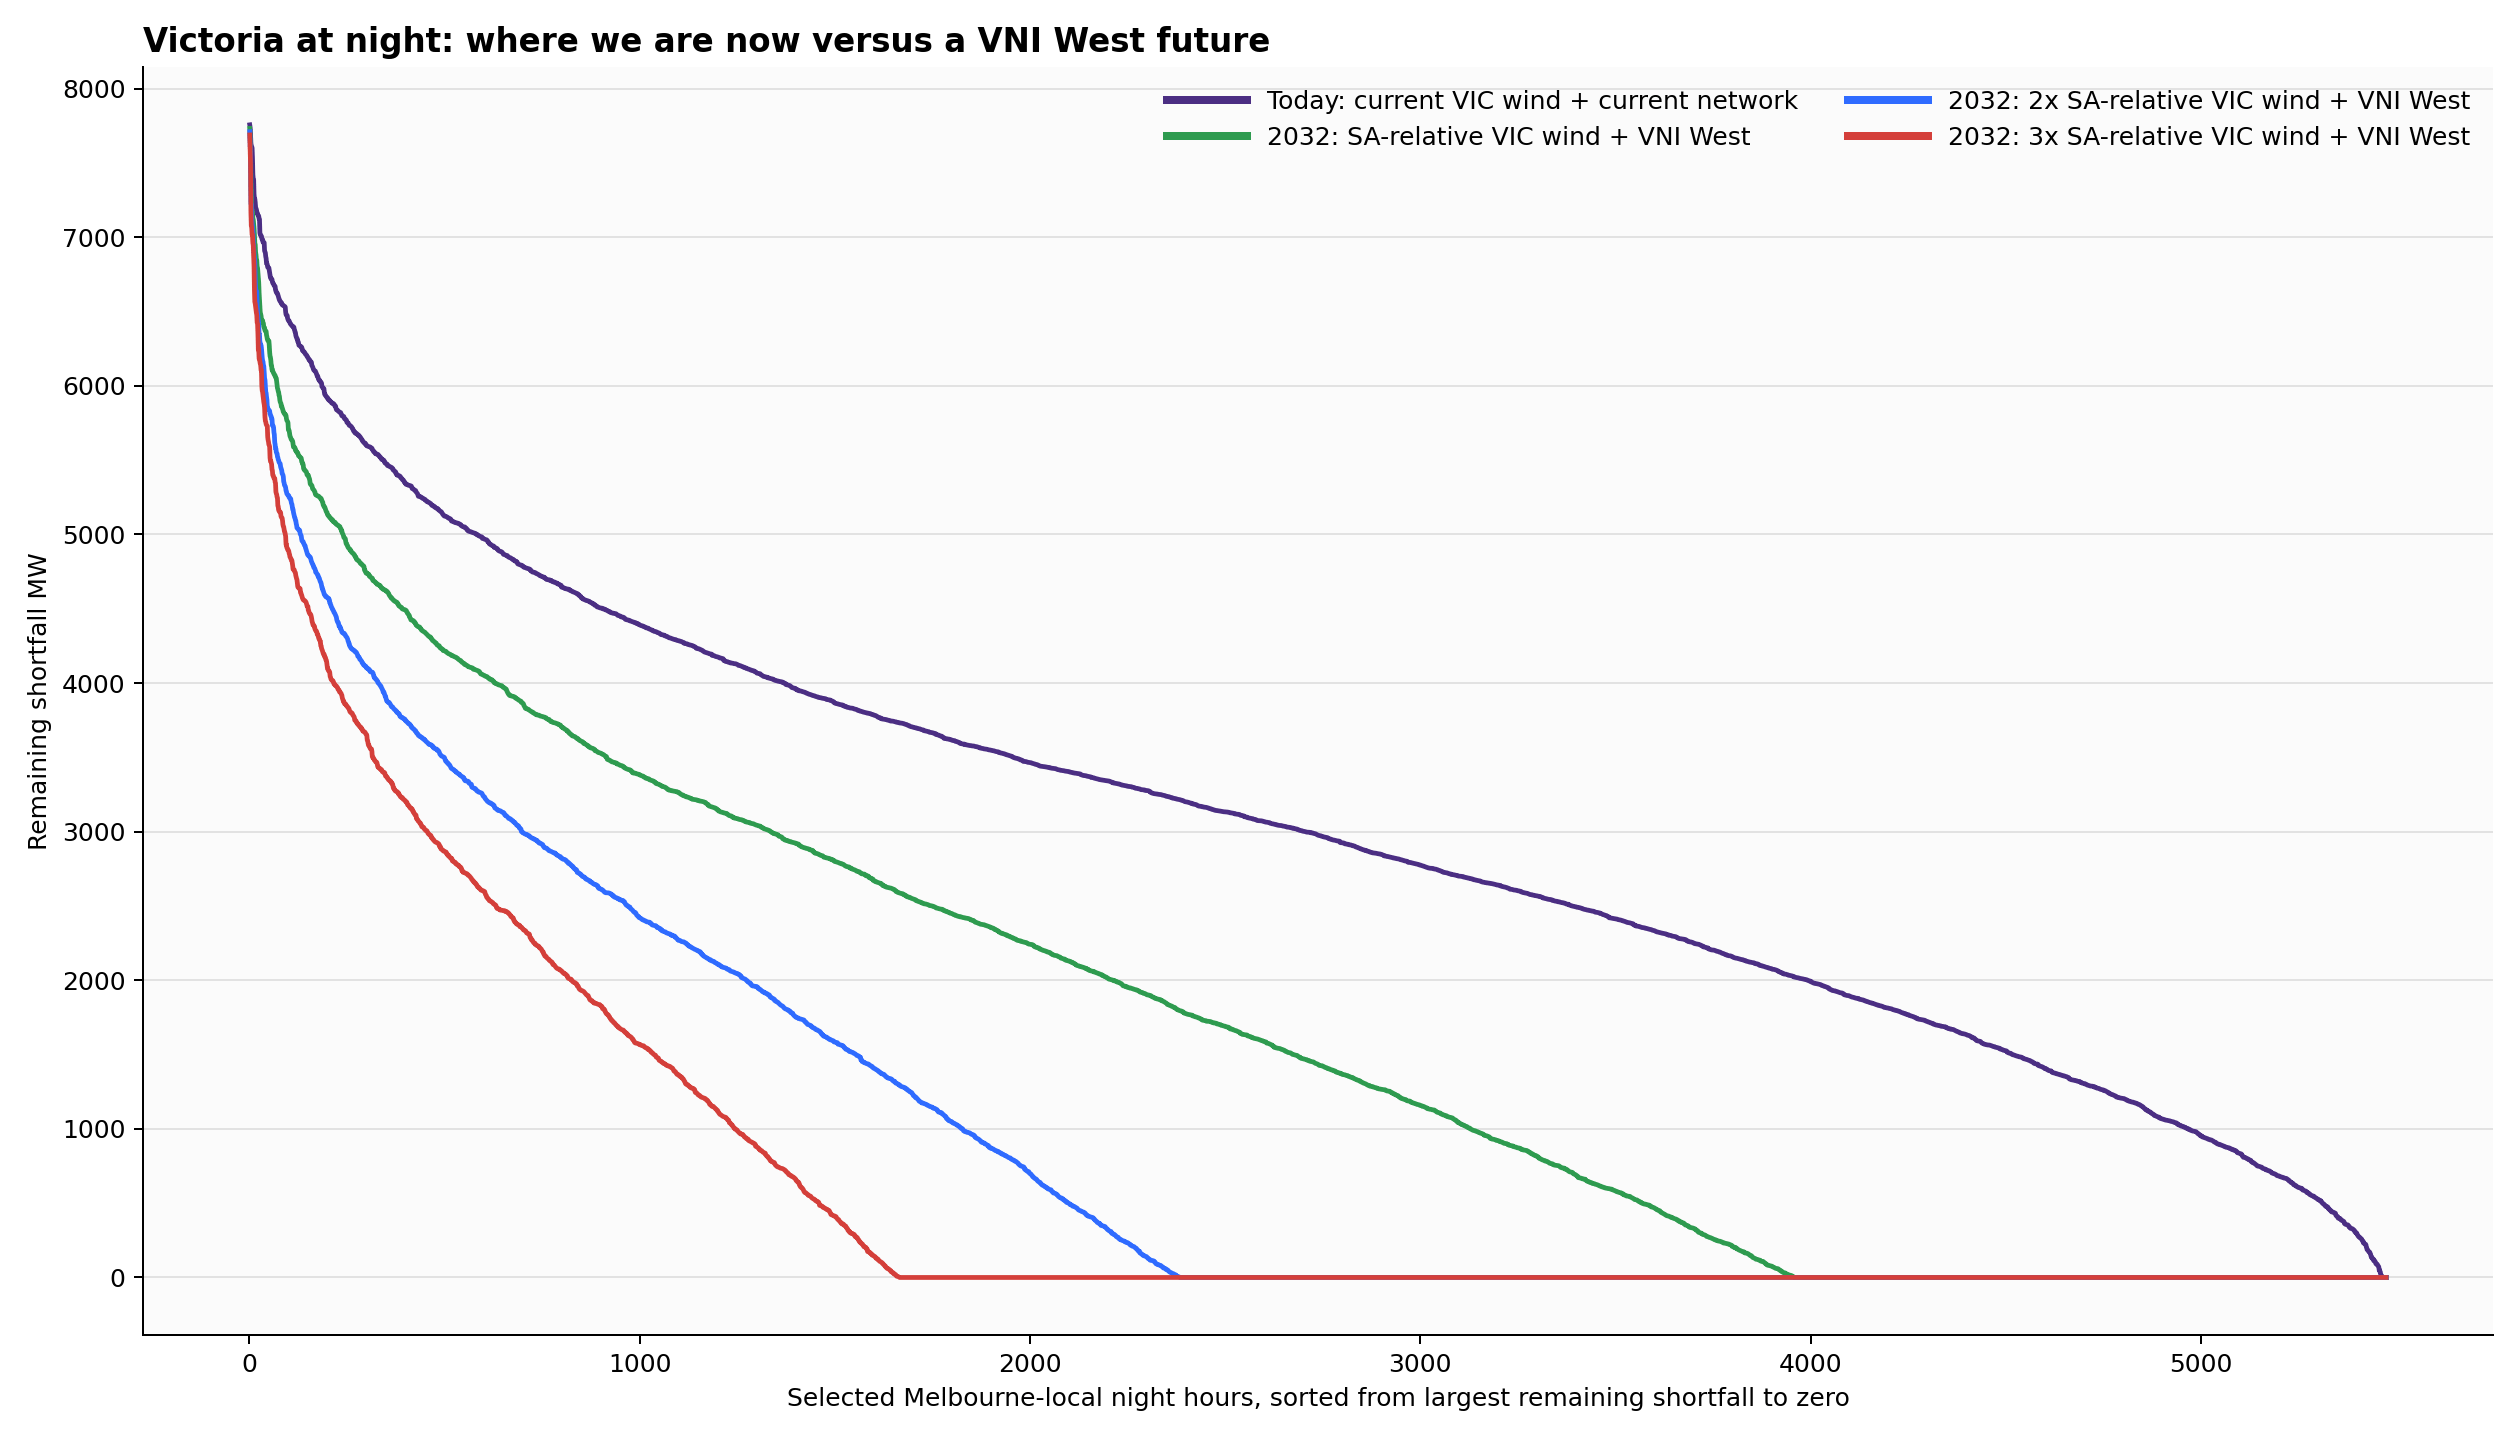
With today’s Victorian wind fleet and today’s practical network, Victoria is still short on almost every selected night. In the practical-2025 run I did earlier, the model found zero selected hours with no shortfall in the capped SA+NSW case, with 365 events lasting at least 8 hours and 362 lasting at least 12 hours. That earlier summary also showed a remaining night shortfall of 16,500 GWh in the practical-2025 capped SA+NSW case.
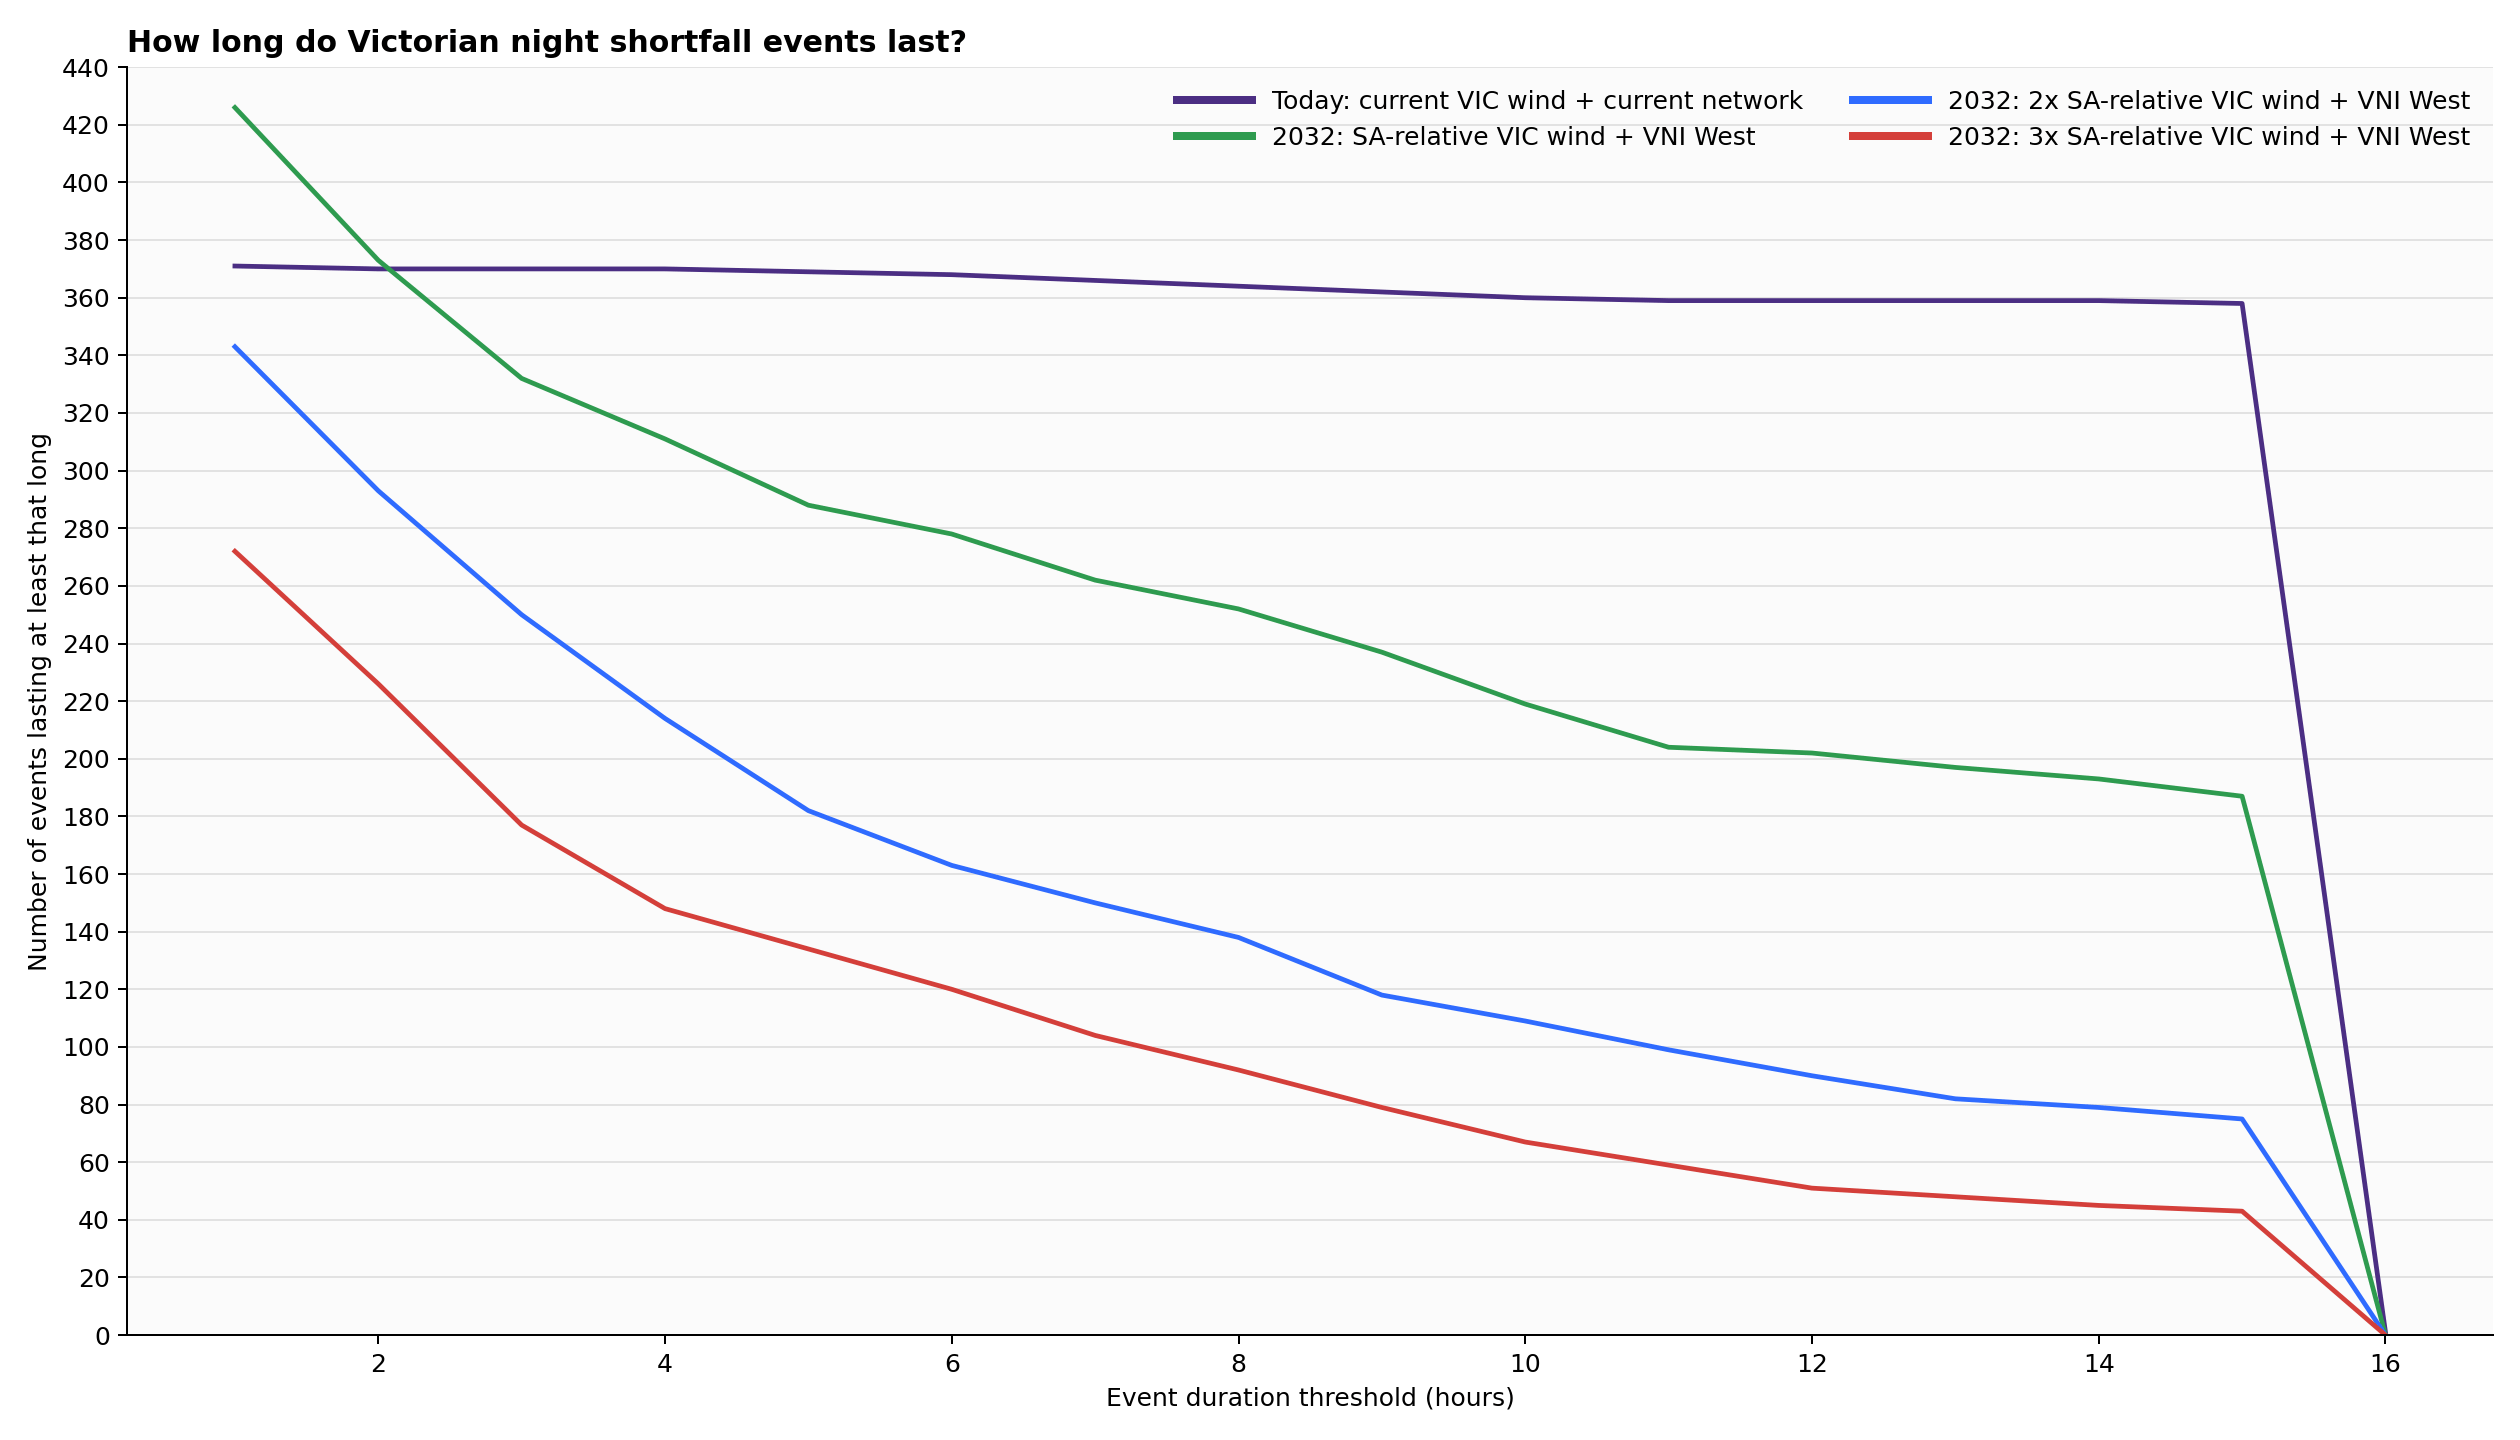
That is not a small tail problem.
That is a system that, once solar is gone, is still structurally short on wind most of the time.
And that by itself is an important result. It tells us that “South Australia works, therefore Victoria should too” is not a serious argument.
This is where the fairer comparison starts.
To make Victoria a fairer counterpoint to South Australia, I first scaled Victoria’s wind fleet up by about 1.44x. Then I asked what happens if Victoria also gets VNI West — the proposed new 500 kV NSW link that AEMO says would add about 1.7 GW of extra import capability into Victoria, with current planning for service around 2030–31. In the model I represented that with a simplified future NSW→Victoria cap of 3.57 GW. That is not a dispatch limit; it is a planning-style envelope for asking what a much stronger NSW connection might do.
And here is the first surprise:
even after doing that, Victoria still does not look remotely like South Australia.
Under the “SA-relative Victorian wind plus VNI West” case, the model still finds about 252 shortfall events lasting 8 hours or more, and about 202 lasting 12 hours or more.
That is much better than where Victoria is now.
But it is still a lot of long bad nights.
Not a narrow tail. Not an almost-solved problem.
So then I pushed it further.
What if Victoria gets not just an SA-like wind fleet, but twice that? In other words, not just “put Victoria on the same relative footing as South Australia”, but then double again from there.
That case does improve things a lot.
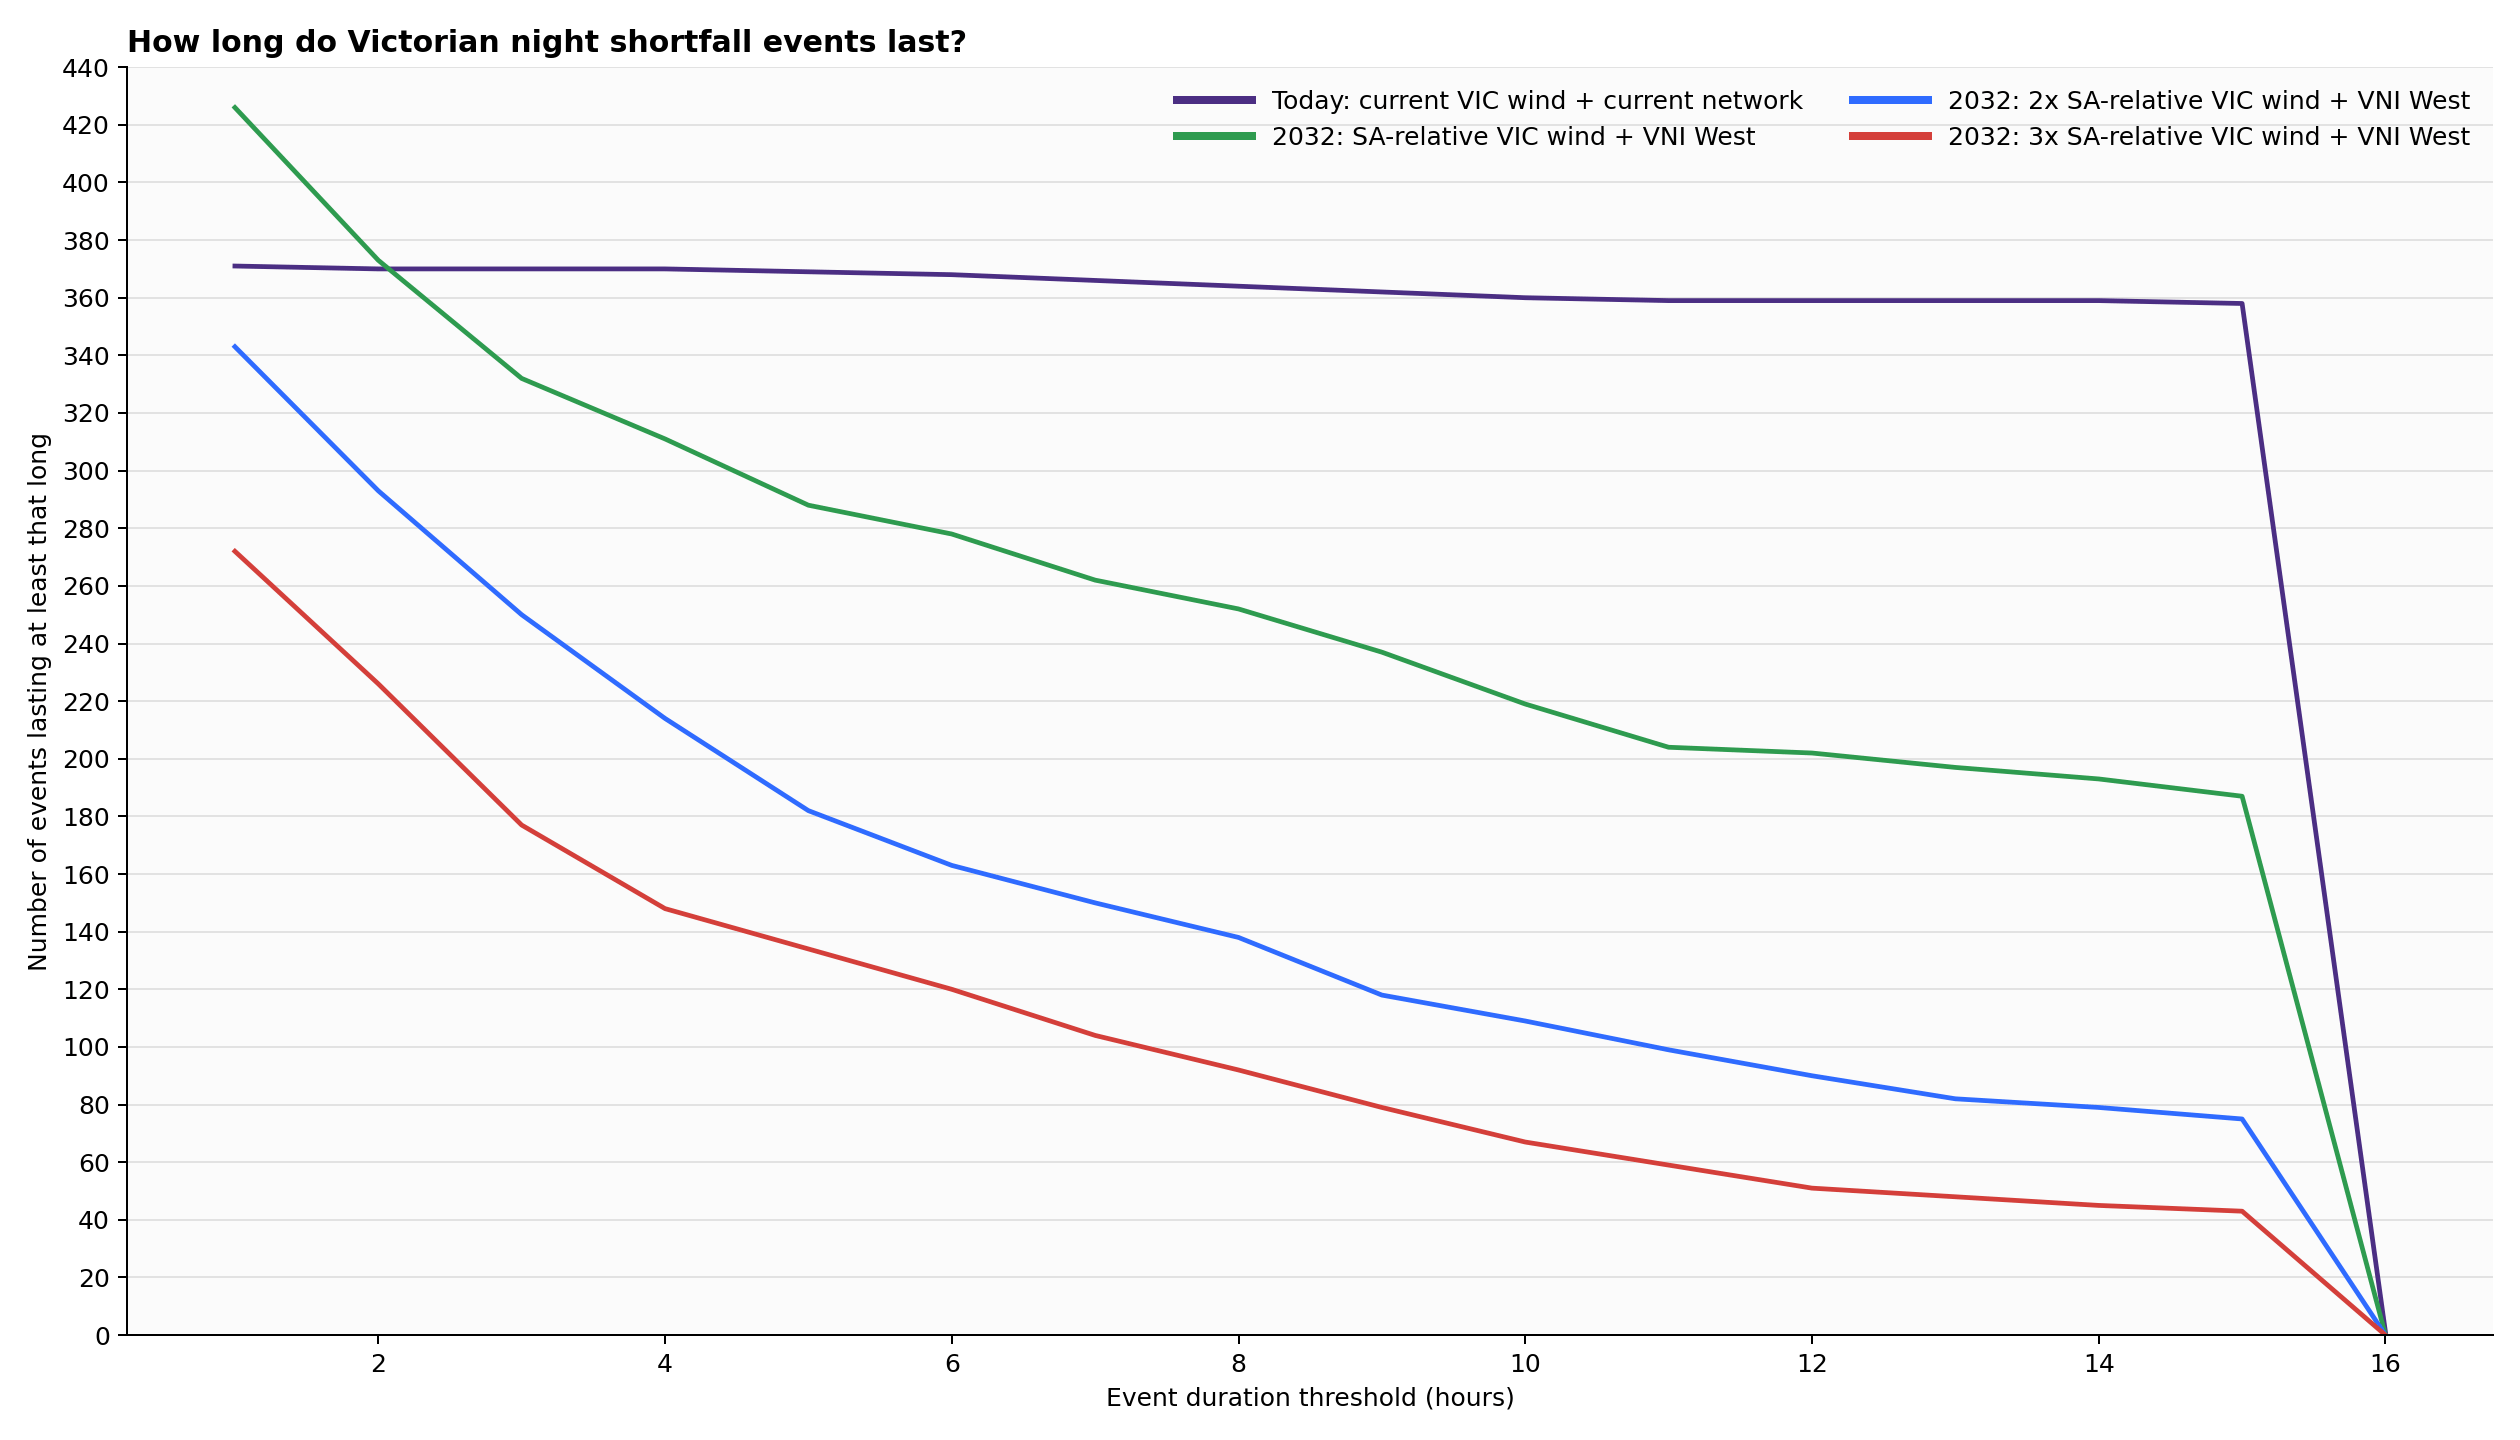
[repeated graph from above]
The count of 8-hour-plus shortfall events falls to about 138, and the 12-hour-plus count falls to about 90.
That is a serious improvement. It means a lot of nights that were bad before are no longer bad, and many others are less bad.
But it still does not turn Victoria into an SA-style story.
Even after giving Victoria an SA-like wind fleet relative to demand, and then doubling it again, you are still left with roughly a hundred and forty long shortfall runs of eight hours or more.
That is not the edge of the distribution. That is still a large part of the year.
Then I tried three times the SA-relative Victorian wind fleet.
Again, the curve improves materially. The 8-hour-plus shortfall count falls to about 92, and the 12-hour-plus count to about 51.
That is real progress.
But it is also the clearest possible demonstration that Victoria is a different kind of problem.
With South Australia, stronger eastern support plus more wind pushed the issue into a much narrower tail. With Victoria, even after scaling up the wind fleet hard and assuming a stronger NSW link, the system still shows a lot of long difficult nights.
That naturally raises the next question.
So far, I had scaled up Victoria’s wind fleet and given it a stronger NSW link. But if Victoria is building much more wind through the 2030s, NSW probably is too.
So I reran the exercise with a more optimistic eastern-grid buildout: not just more Victorian wind, but NSW wind scaled up in step with Victoria wind.
That makes a real difference.
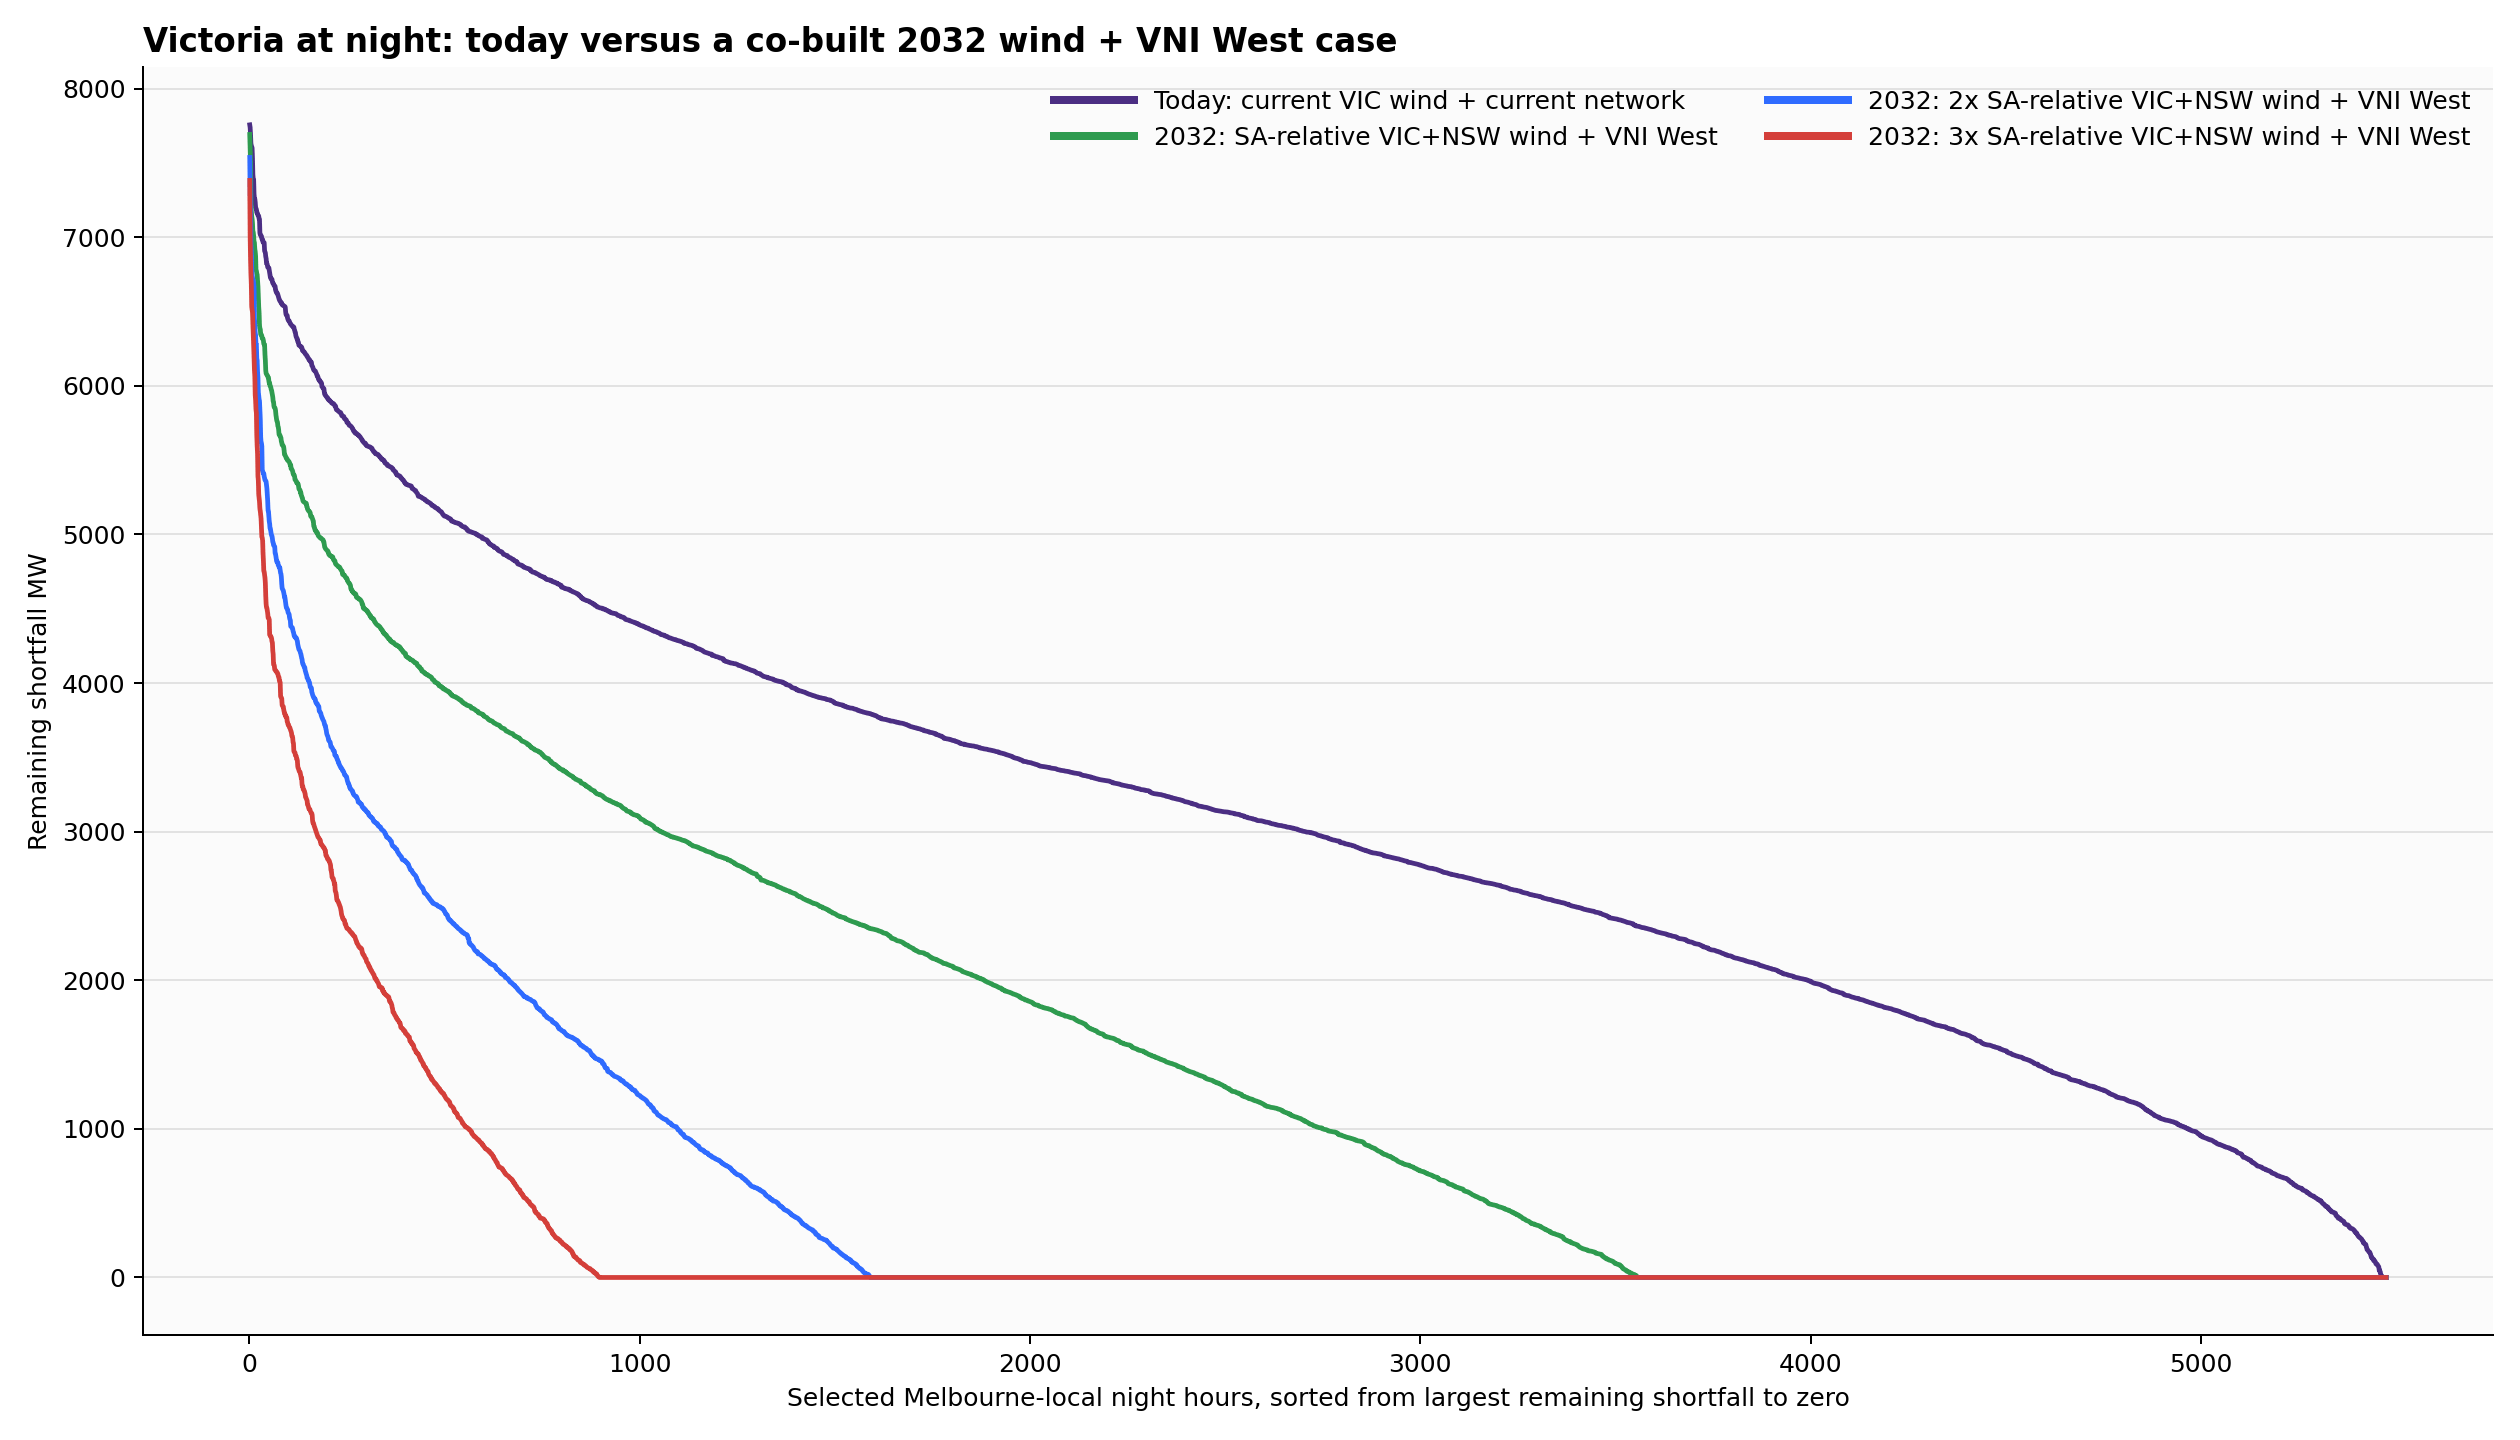
In the earlier Victoria-only scaling case, the SA-relative Victorian fleet still left about 252 shortfall events of 8 hours or more. Once NSW scales too, that falls to about 224.
At 2x SA-relative Victorian wind, the improvement is much larger: the count of 8-hour-plus shortfall events falls from about 138 to about 79.
At 3x SA-relative Victorian wind, it falls again, from about 92 to about 39.
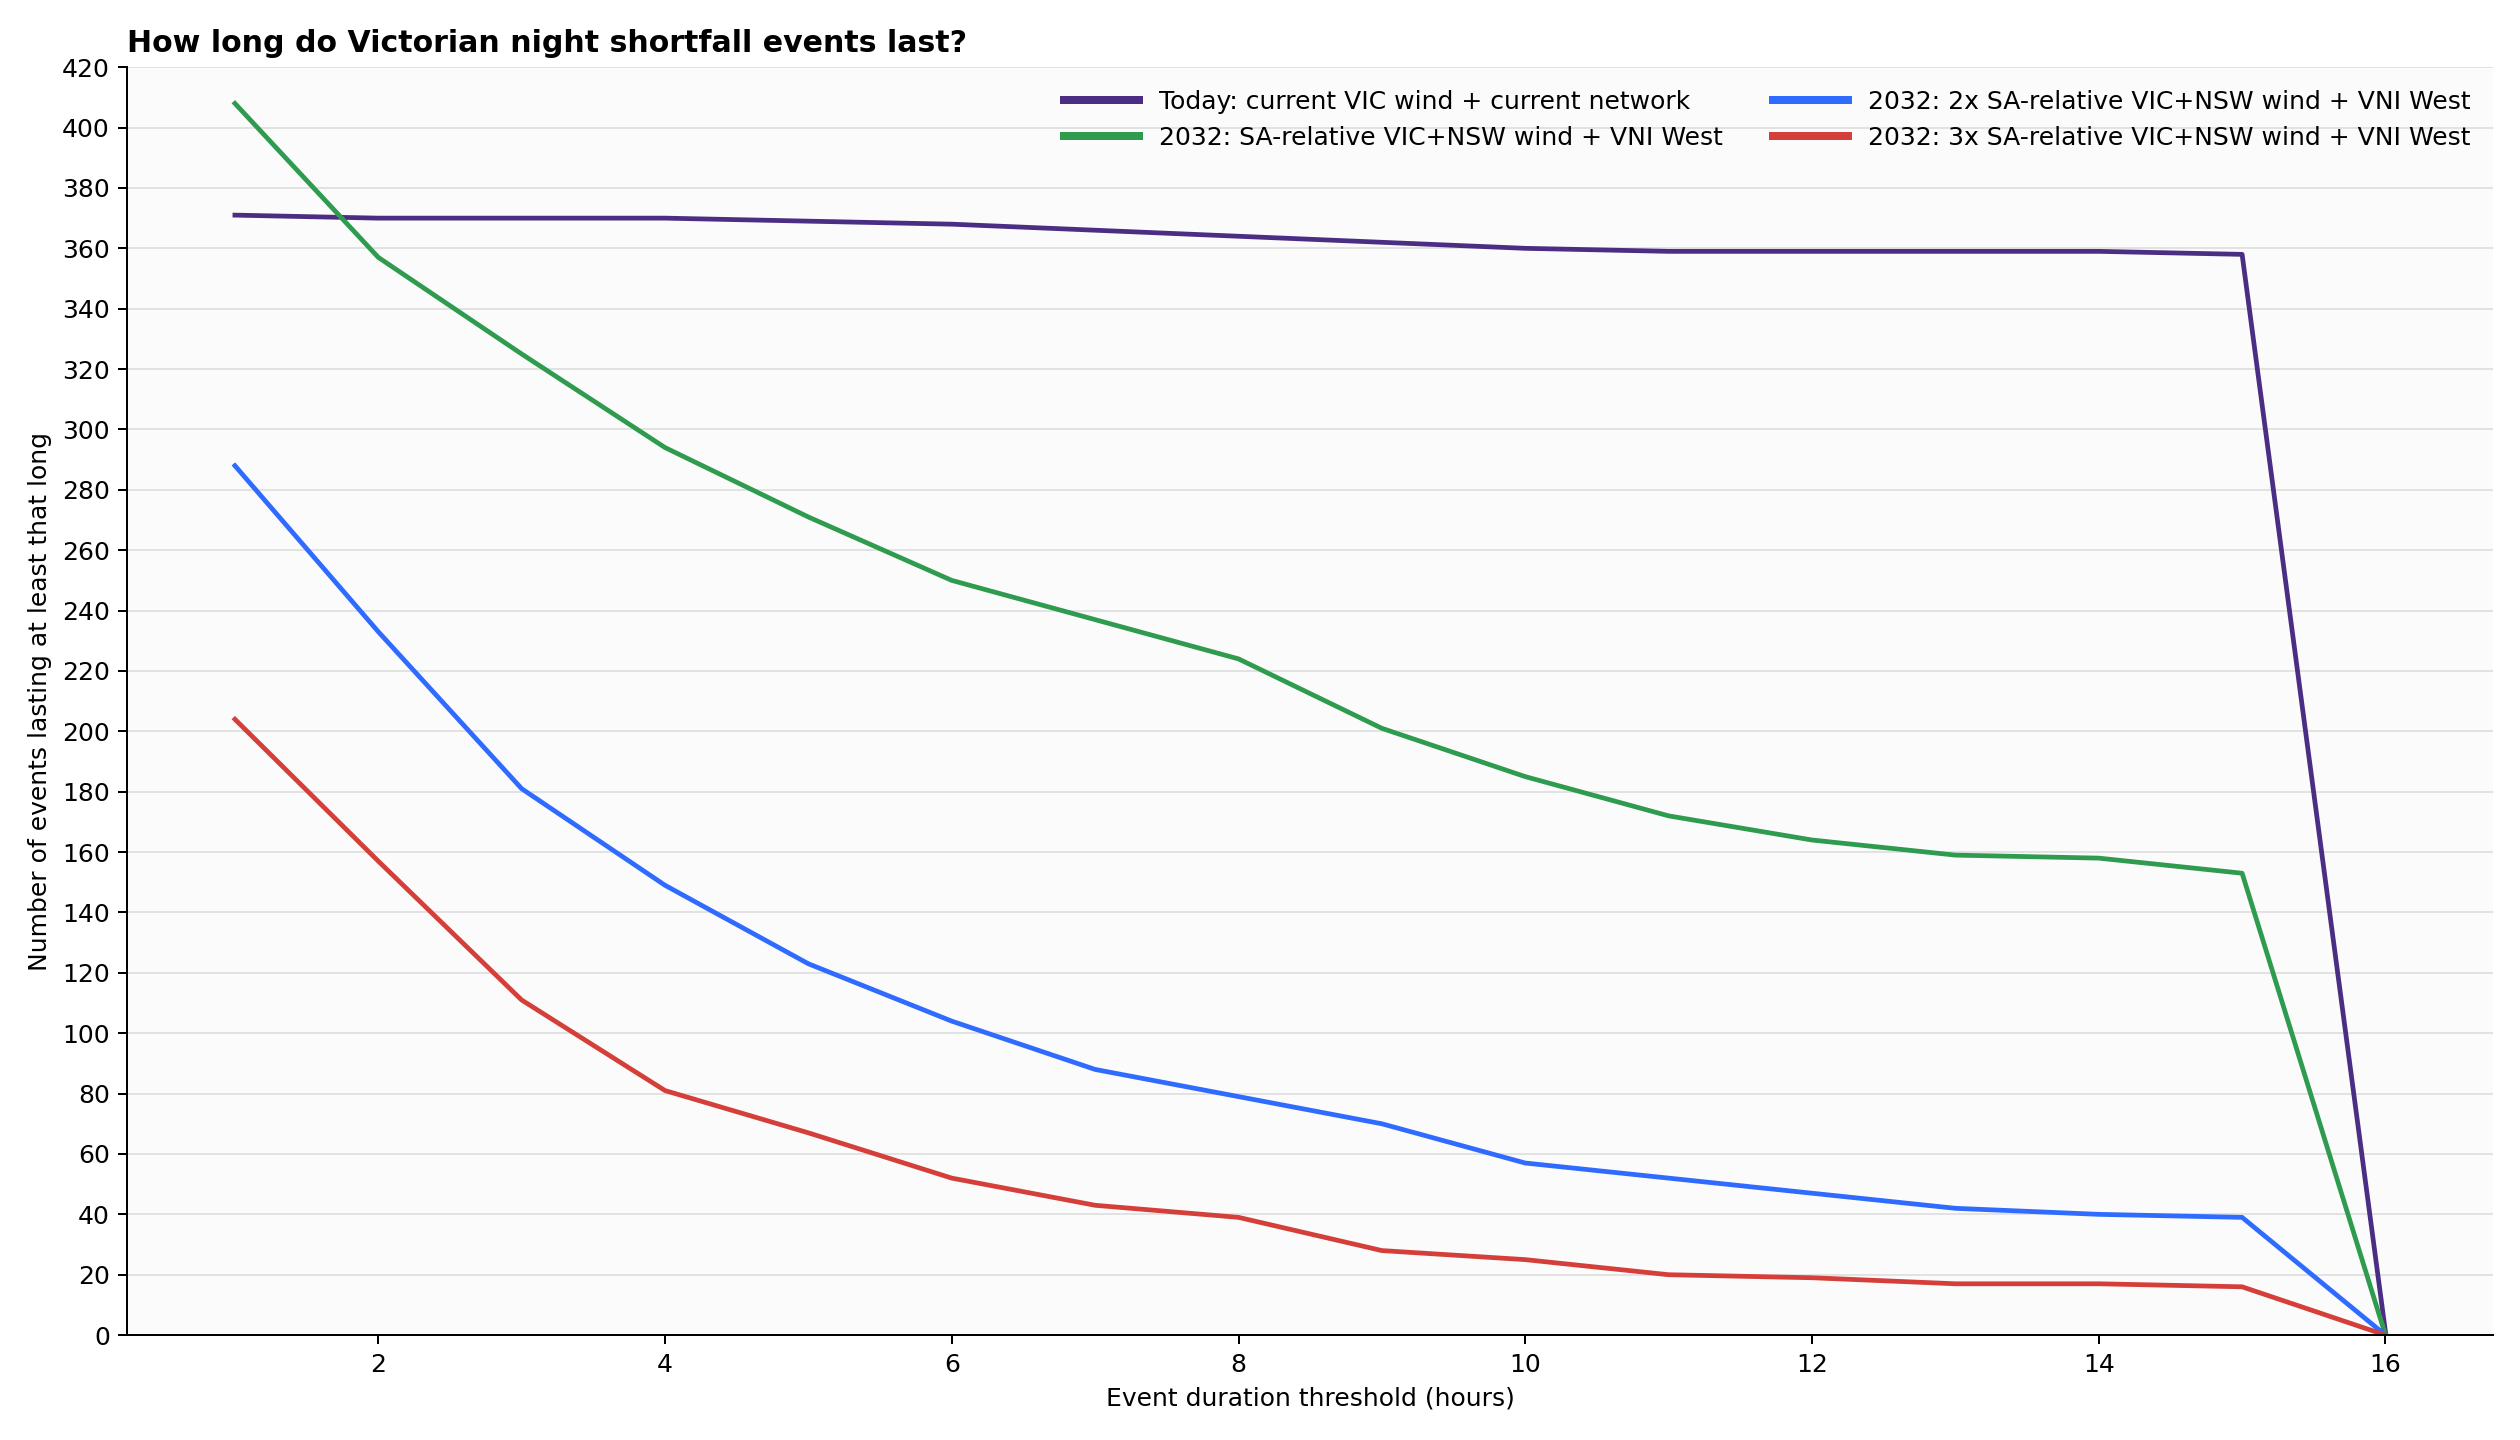
The same thing shows up in energy terms. Remaining night shortfall falls from about 9.5 TWh to about 8.2 TWh at the SA-relative step, from about 5.4 TWh to about 3.1 TWh at 2x, and from about 3.7 TWh to about 1.6 TWh at 3x.
So this clearly helps. A lot.
But it also reveals something else. Once NSW scales too, the 3.6 GW NSW→Victoria cap starts to matter. It binds in only 0.1% of selected hours at the SA-relative step, but in 33% of hours at 2x and 56% at 3x.
That is useful, because it shows the problem changing shape again.
At first, Victoria’s problem is not enough local wind.
Then, even after Victoria builds much more wind, the wider system still does not have enough wind often enough.
But once NSW grows too, the bottleneck starts to shift back to transmission.
Even then, Victoria still does not become South Australia. The numbers are much better, but the tail remains real.
If you point to South Australia and say, “see, a high-renewables system can work”, it’s true — for the case where that system has big interconnects to larger neighbours.
If you’re the big neighbour, the problem is much harder.
More wind helps. Bigger interconnectors help. But they do not turn Victoria into South Australia.
South Australia after sunset is a difficult but tractable tail problem.
Victoria after sunset is still a much bigger system problem.
And that is why South Australia is not a template.
Comments
Nothing yet. Say the first thing.
Sign in to join the conversation.