
One of the standard objections to a highly renewable South Australian grid goes something like this:
Solar disappears in the evening. Wind is unreliable. And when South Australian wind is weak, Victorian wind is probably weak too. So interconnectors will not save you. They may help at the margin, but once the sun goes down you are still in trouble.
That sounds plausible. But it is also vague. So I wanted to test it more concretely.
I started with actual 2025 wind and demand data, and then narrowed the problem to the hours that matter most for this question: 5pm to 8am Adelaide time, when solar is effectively absent and the system has to lean on some mix of wind, interconnectors, storage, gas and demand response.
This is not a dispatch model, and it is not a formal market simulation. It is a set of structured thought experiments using real data. The question is not “what would the market do in every 5-minute interval?” The question is simpler and more physical:
How much can wind and interconnection shrink South Australia’s night-time supply problem?
Before getting to the night-time charts, it is worth starting with a simpler question.
The calendar-2025 correlation plot is a useful first check.
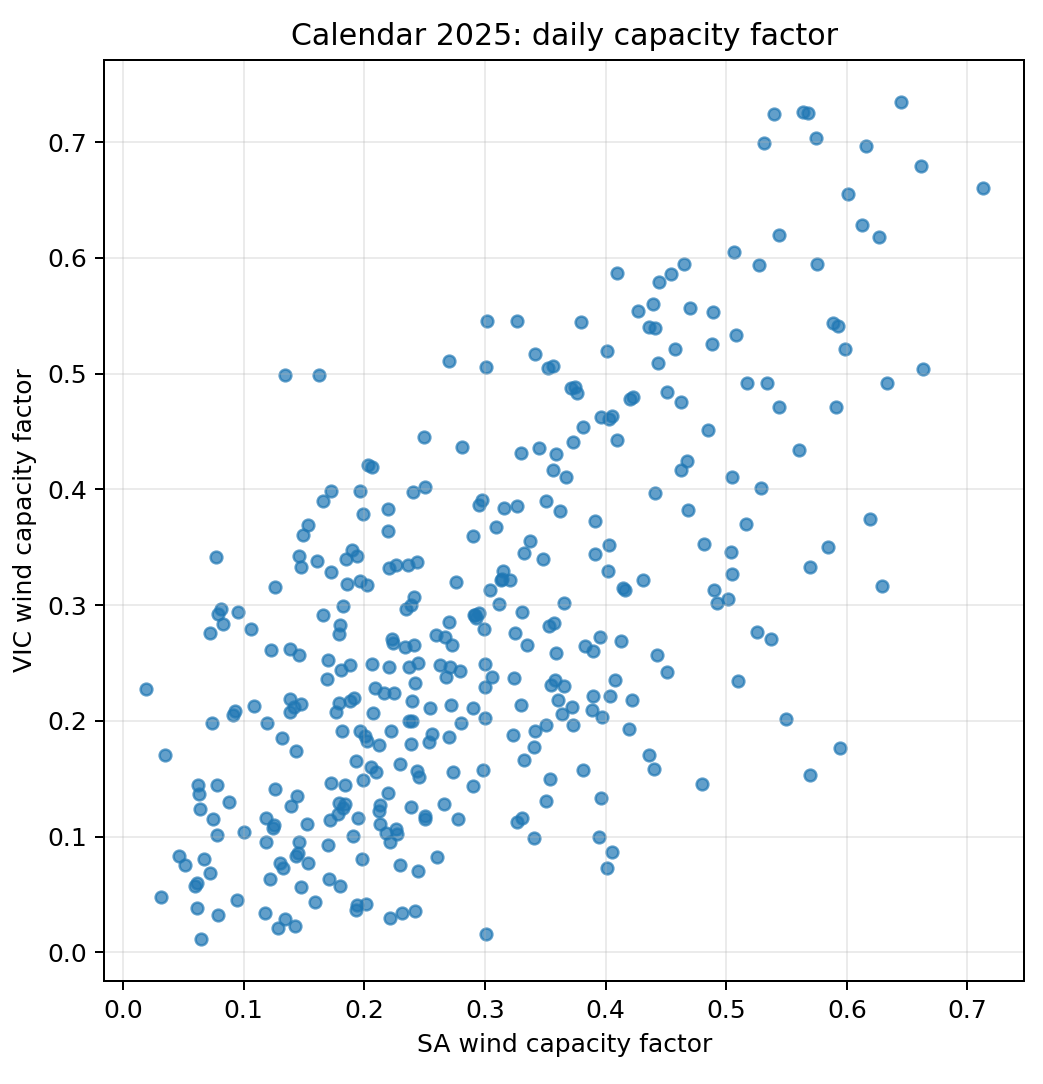
This uses all 24 hours, not just the evening and overnight period. It shows that South Australian and Victorian wind are positively correlated, which is what you would expect from large shared weather systems. But it also shows that they are far from perfectly locked together.
That matters.
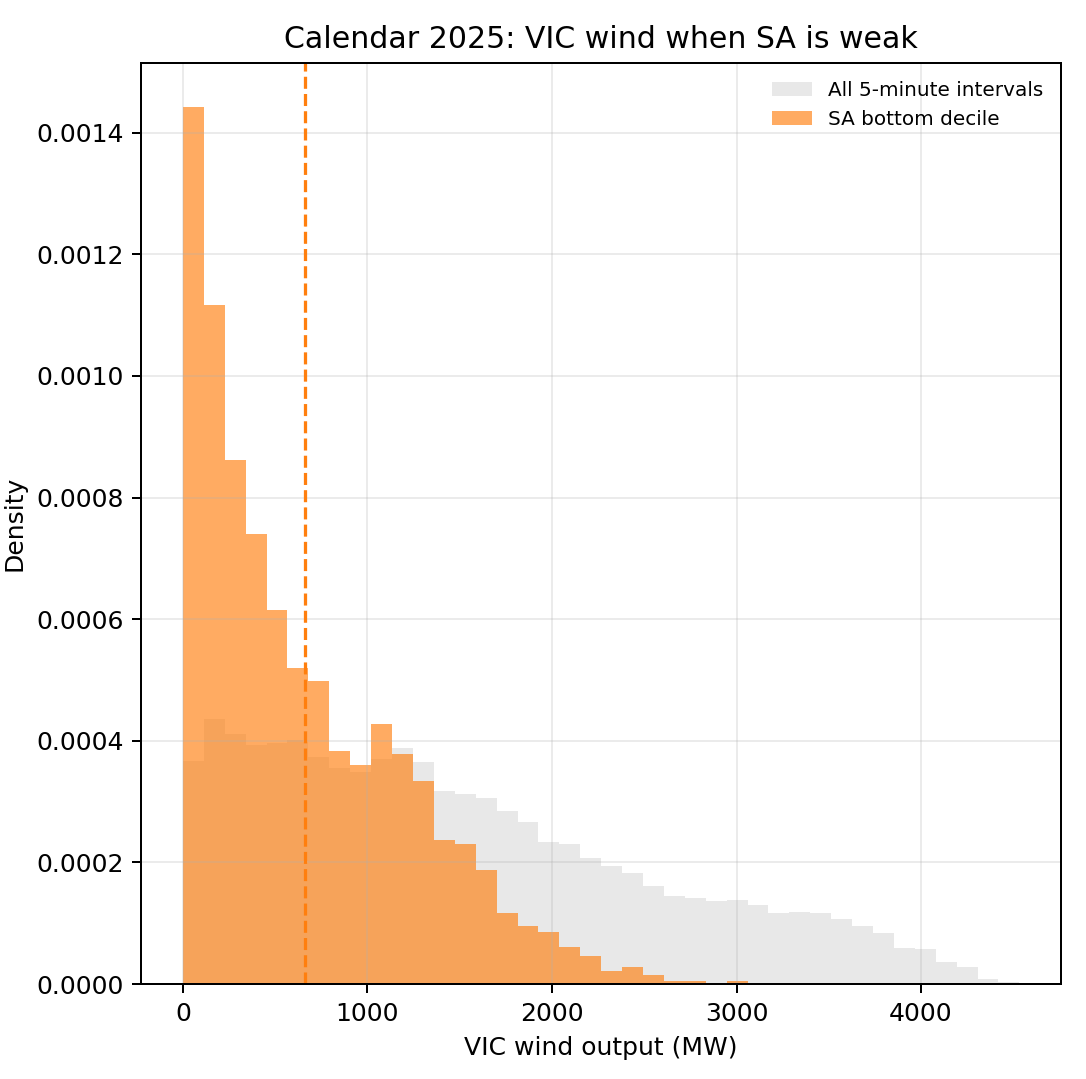
The 2025 results say that when South Australian wind falls into its bottom decile, Victorian wind still averages about 660 MW. Victoria is also in its own bottom decile only about 31% of those times. So the two regions are clearly not independent — joint weak-wind periods happen much more often than they would if the two systems were unrelated — but nor are they simple clones of each other.
That is the first important point.
Victoria helps, but not perfectly.
It is neither a magic insurance policy nor a useless one.
That is also why I would not dwell too long on the correlation charts. They tell us the meteorological relationship is helpful but incomplete. What readers really want to know is what that means once the sun has gone and actual demand still has to be met.
So I restricted the data to 17:00 to 08:00 Adelaide local time across calendar 2025 and looked first at South Australian demand on its own.
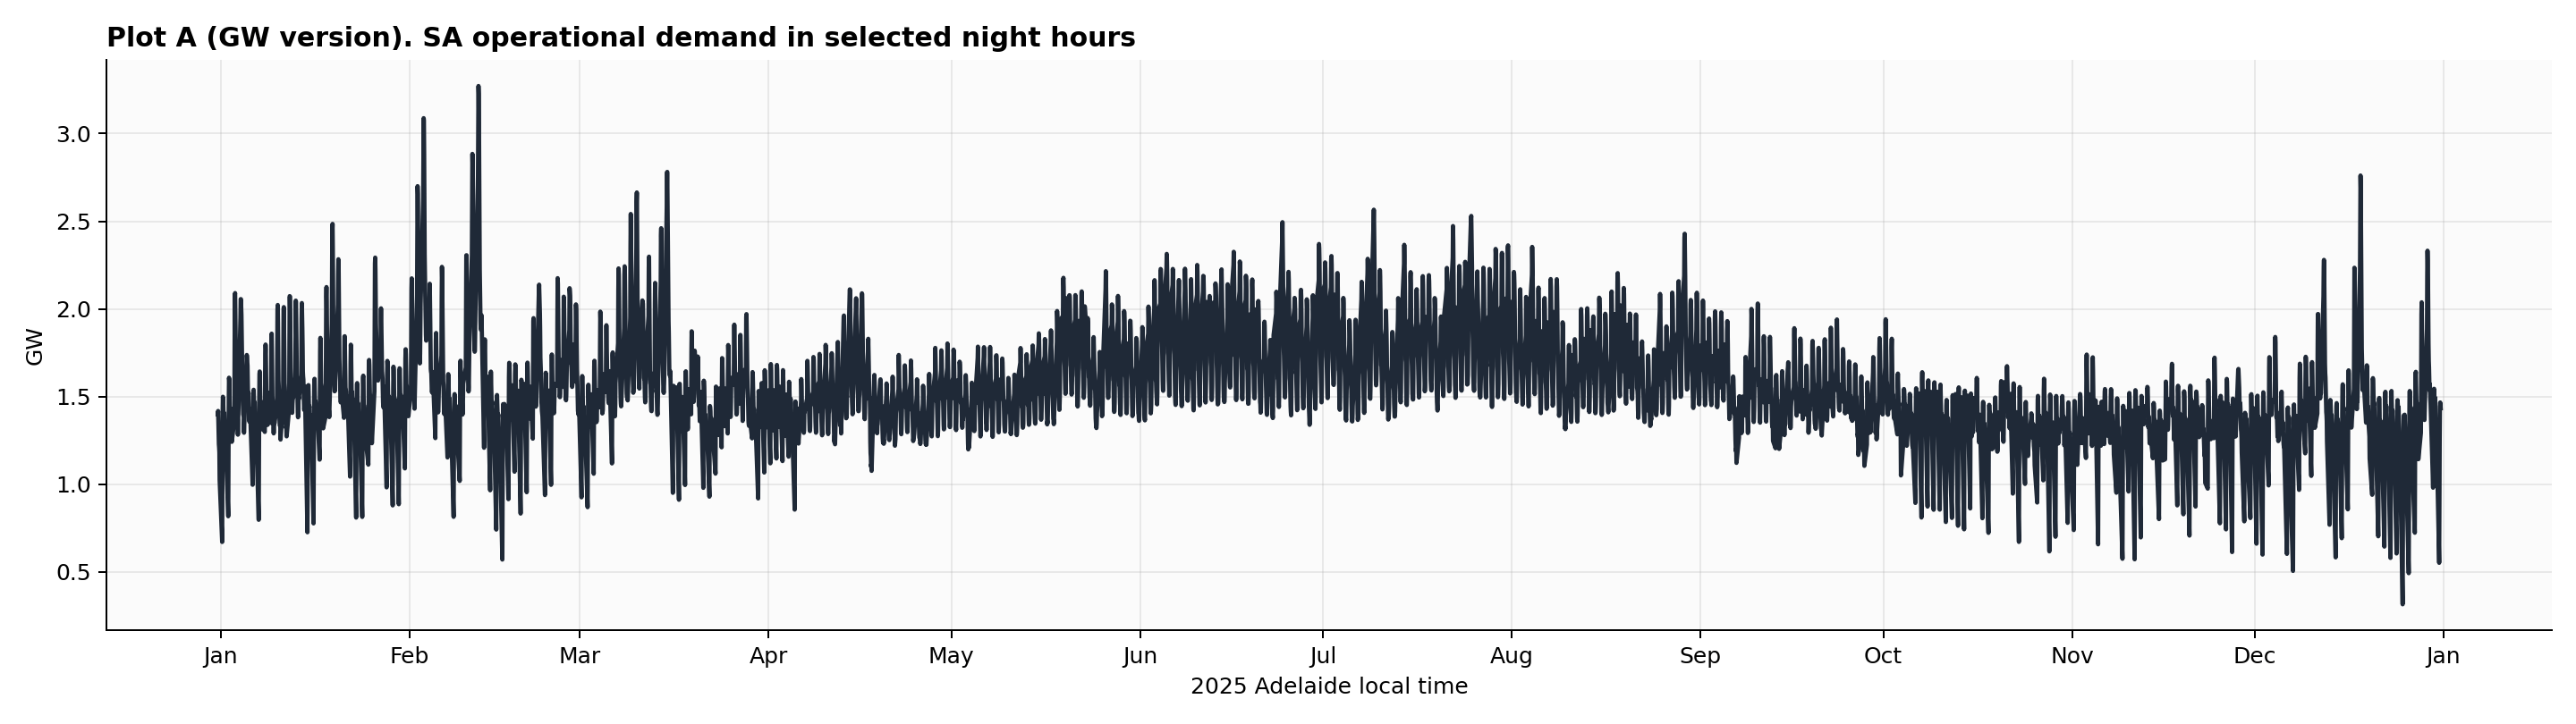
That chart does something important: it grounds the discussion in scale.
Average demand in those selected hours is about 1.56 GW. It moves around through the year, with winter evenings and mornings generally higher, and with some sharper spikes at other times. Once solar is gone, that load still has to be covered. The problem does not disappear just because rooftop PV did a lot of work in the middle of the day.
This is the load that the rest of the exercise is trying to meet.
The next obvious question is: what does the wind look like against that demand?
In Plot B I put South Australian demand alongside South Australian wind and Victorian wind. The eastern line here is best thought of as an available weather envelope, not as something South Australia can necessarily import in full.
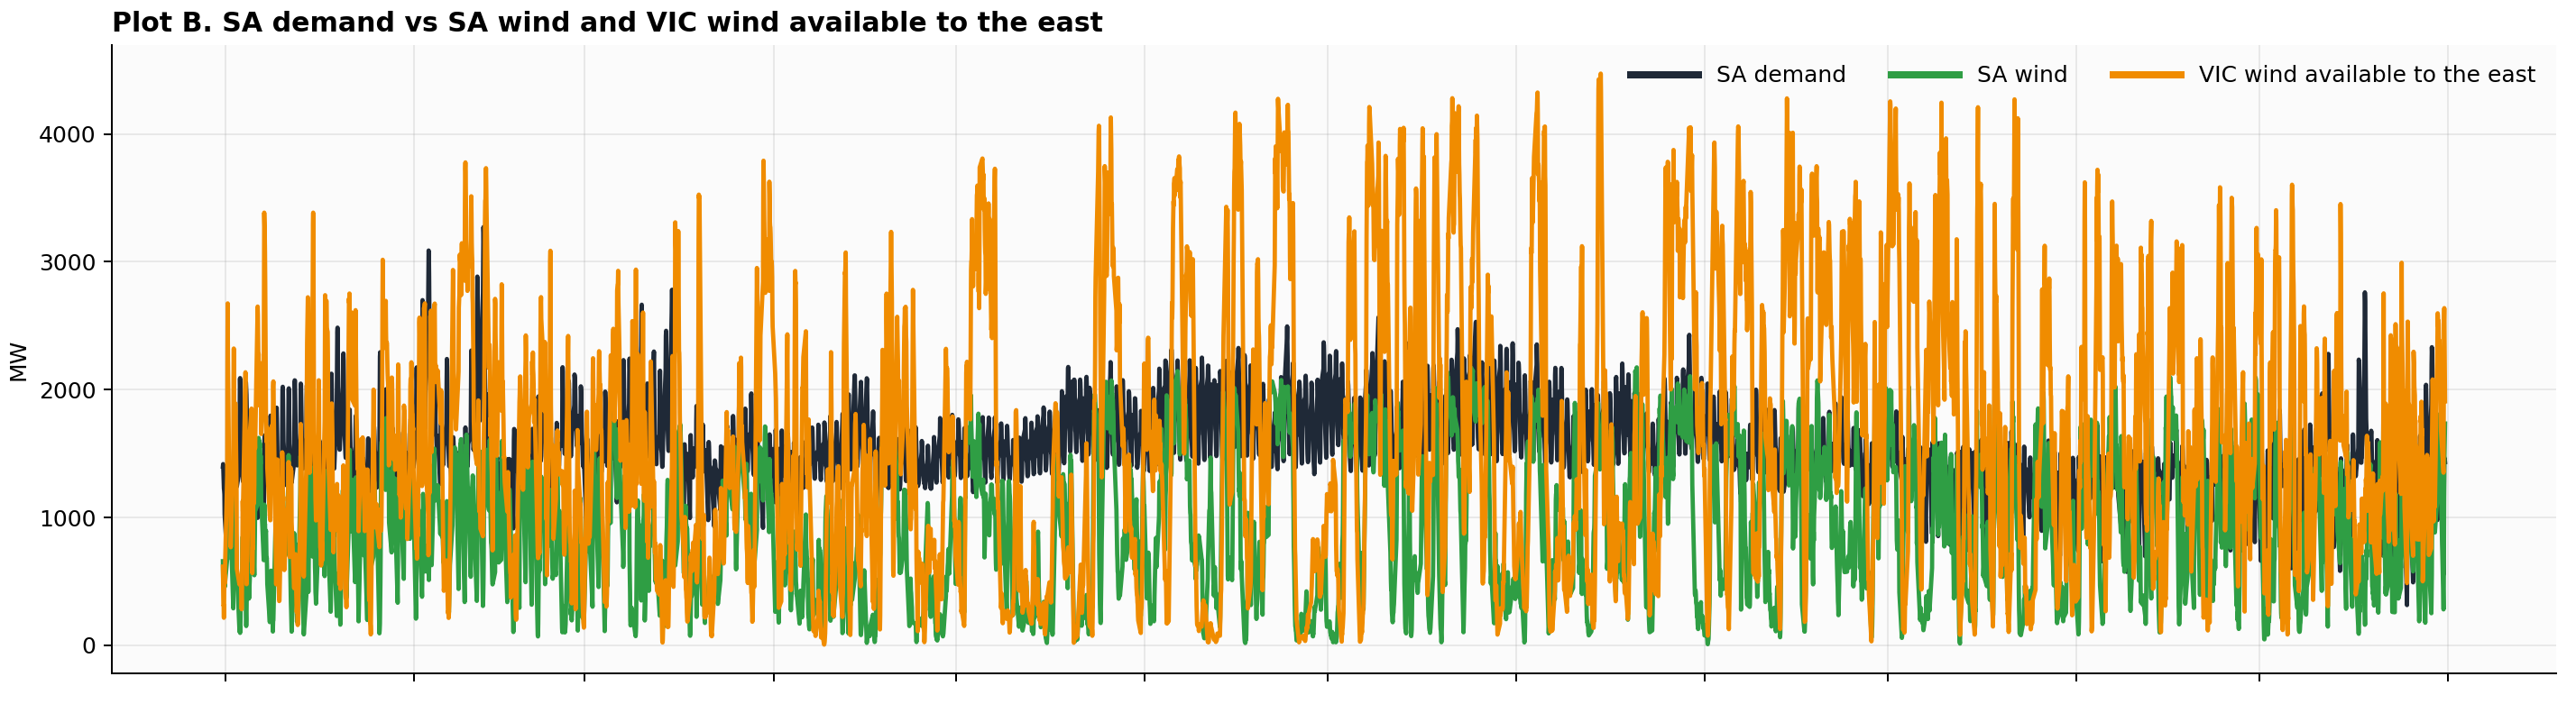
Two things jump out.
The first is that South Australian wind alone often does a meaningful amount of work, but it also has plenty of weak periods. That is no surprise.
The second is more interesting: Victorian wind is often substantial even when South Australian wind is unimpressive. Not always. But often enough to matter.
This is the visual version of the earlier correlation result. The weather diversity is real. But at this stage it is still just potential help, not actual deliverable help.
So the next step is to stop pretending that all eastern wind is freely available.
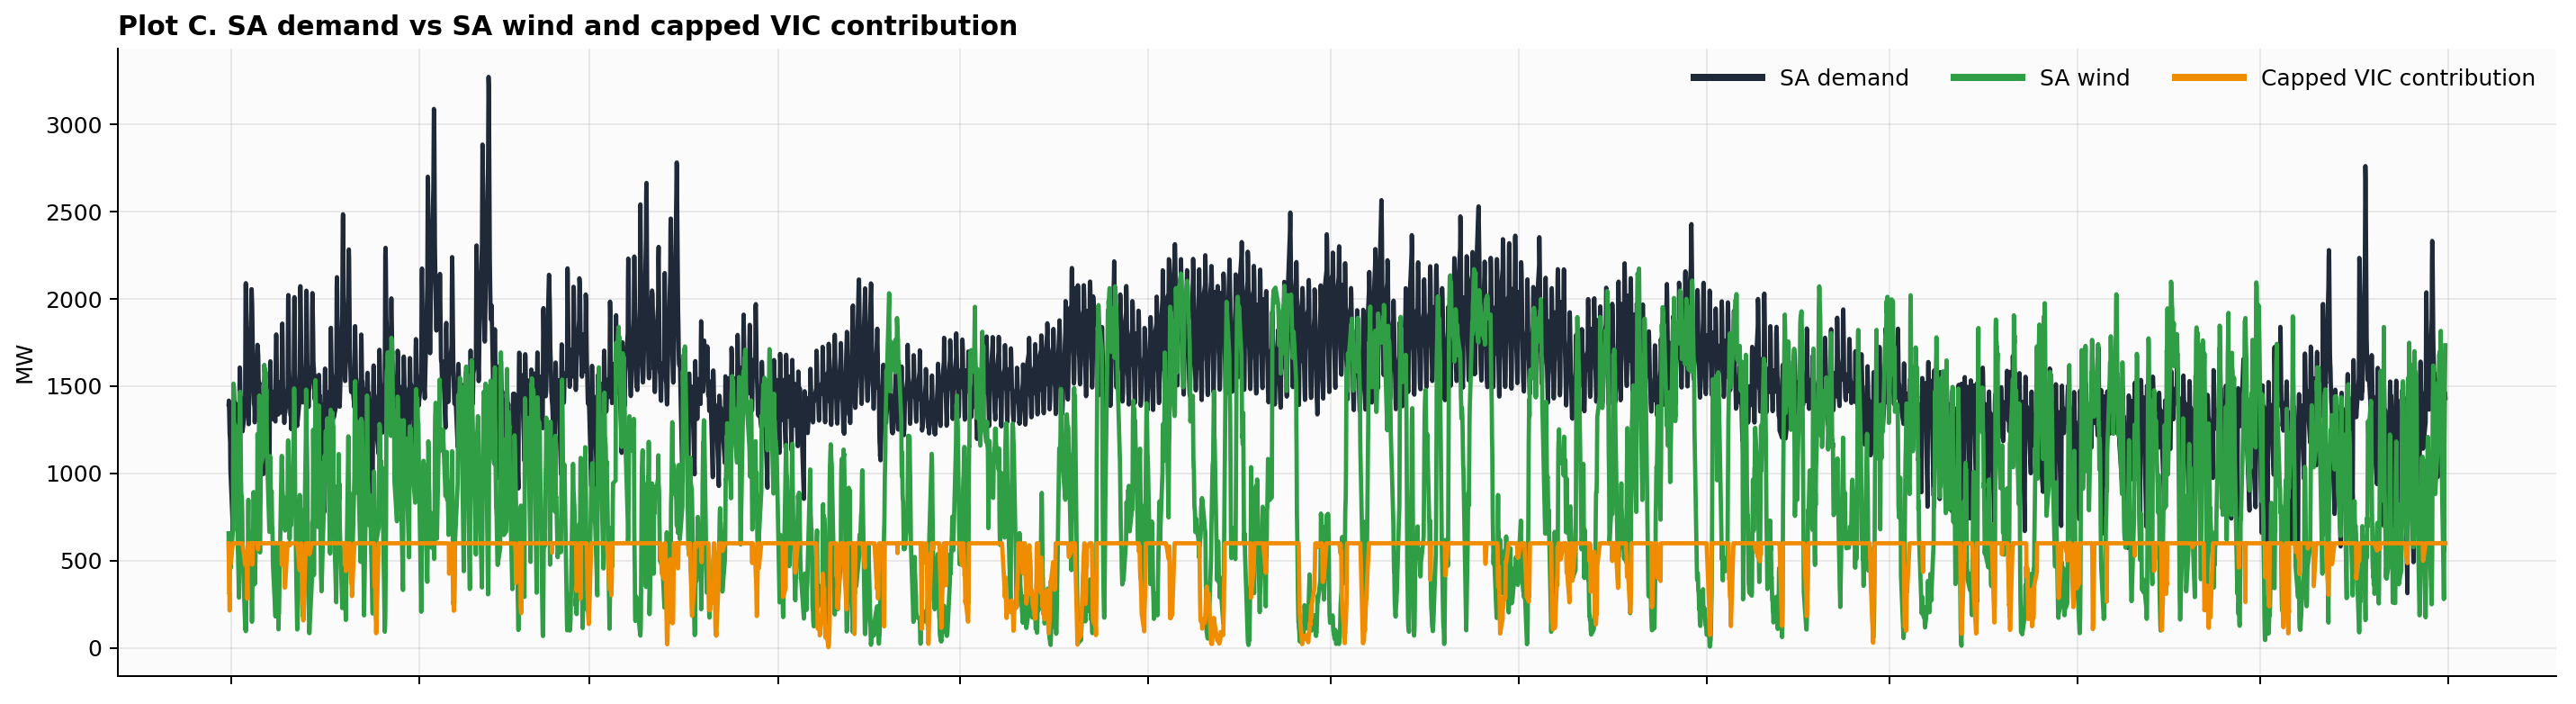
In Plot C, I cap the Victorian contribution. Now you can see the bottleneck much more clearly. The eastern line is suddenly flattened at the cap in many intervals. The problem is no longer just meteorology. It is transmission.
This is a crucial transition in the story.
When people say “Victoria can help South Australia,” that is true in a weather sense. But what the grid actually cares about is not how windy Victoria is in the abstract. It cares about how much of that wind can get through when South Australia needs it.
That is why interconnectors matter. Not because they create energy, but because they convert geographic diversity into usable support.
The next thought experiment is to stop looking only at Victoria and instead look east more broadly.
In Plot D I add Victoria plus NSW wind as an unconstrained eastern envelope.
This is where the picture becomes much more encouraging.
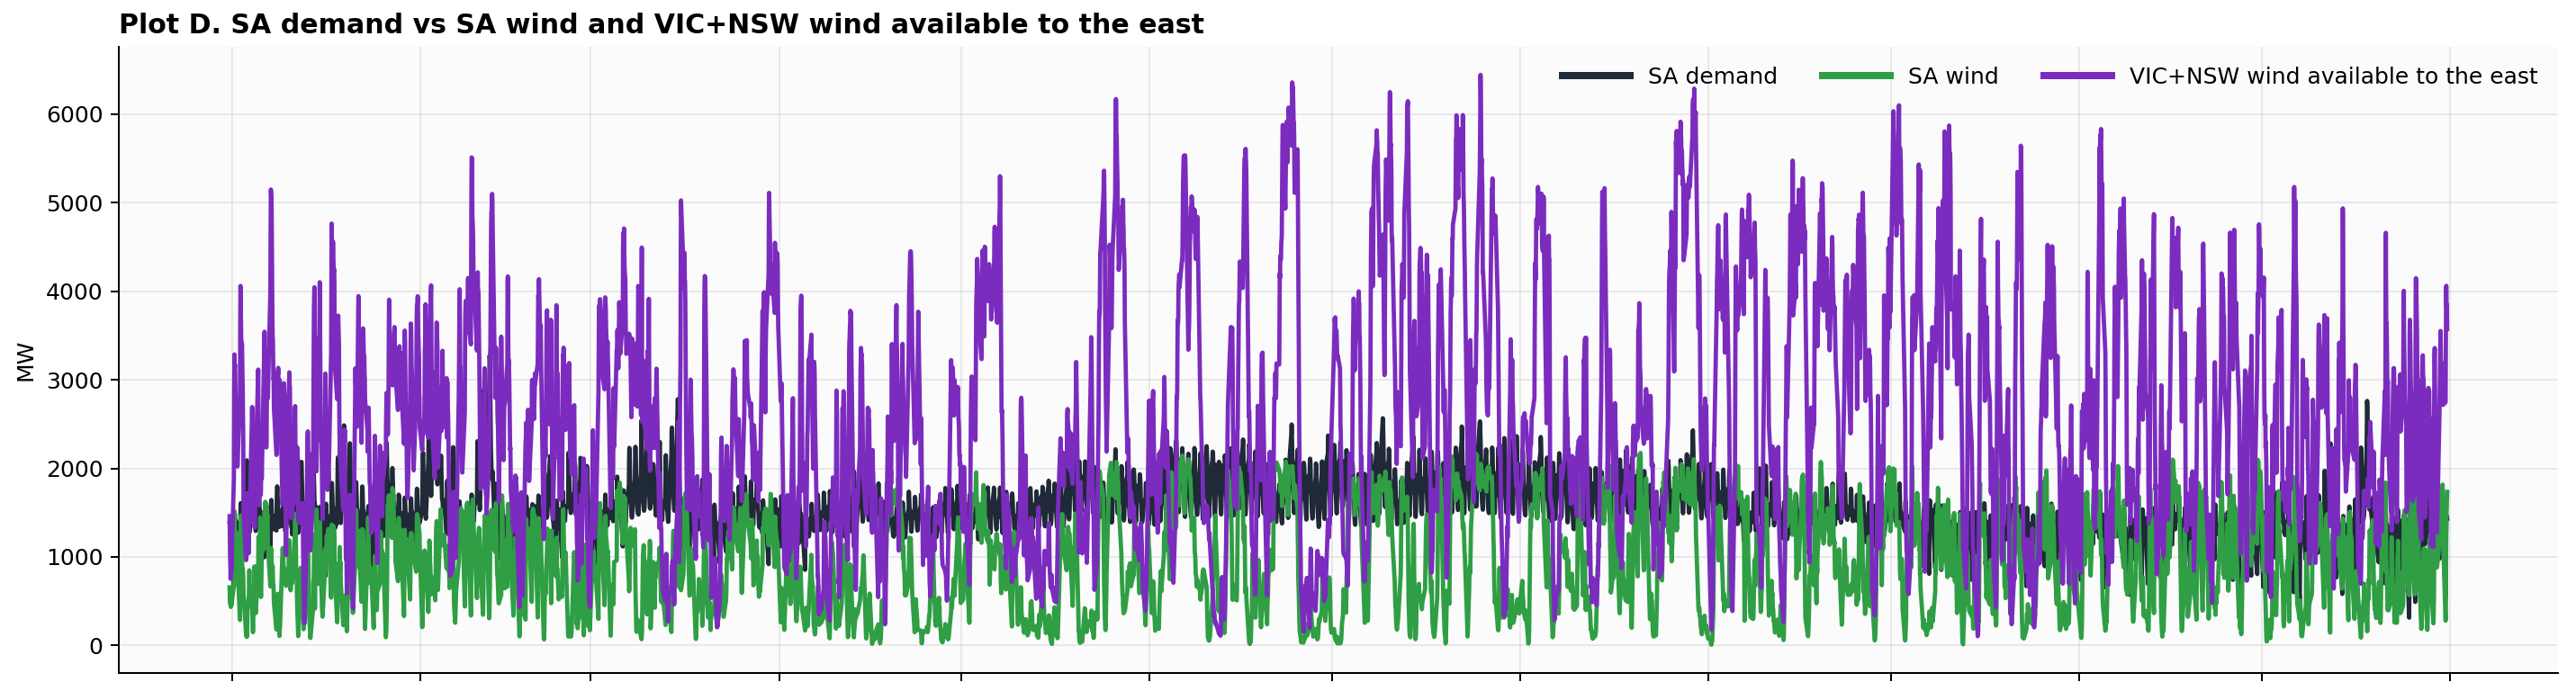
Once NSW is included, the eastern weather resource becomes much larger. On many nights there is a lot of wind somewhere to the east, even when South Australian wind is not doing much. The supply potential is clearly there.
But again, this is still only a weather envelope. It is not yet a deliverable supply line.
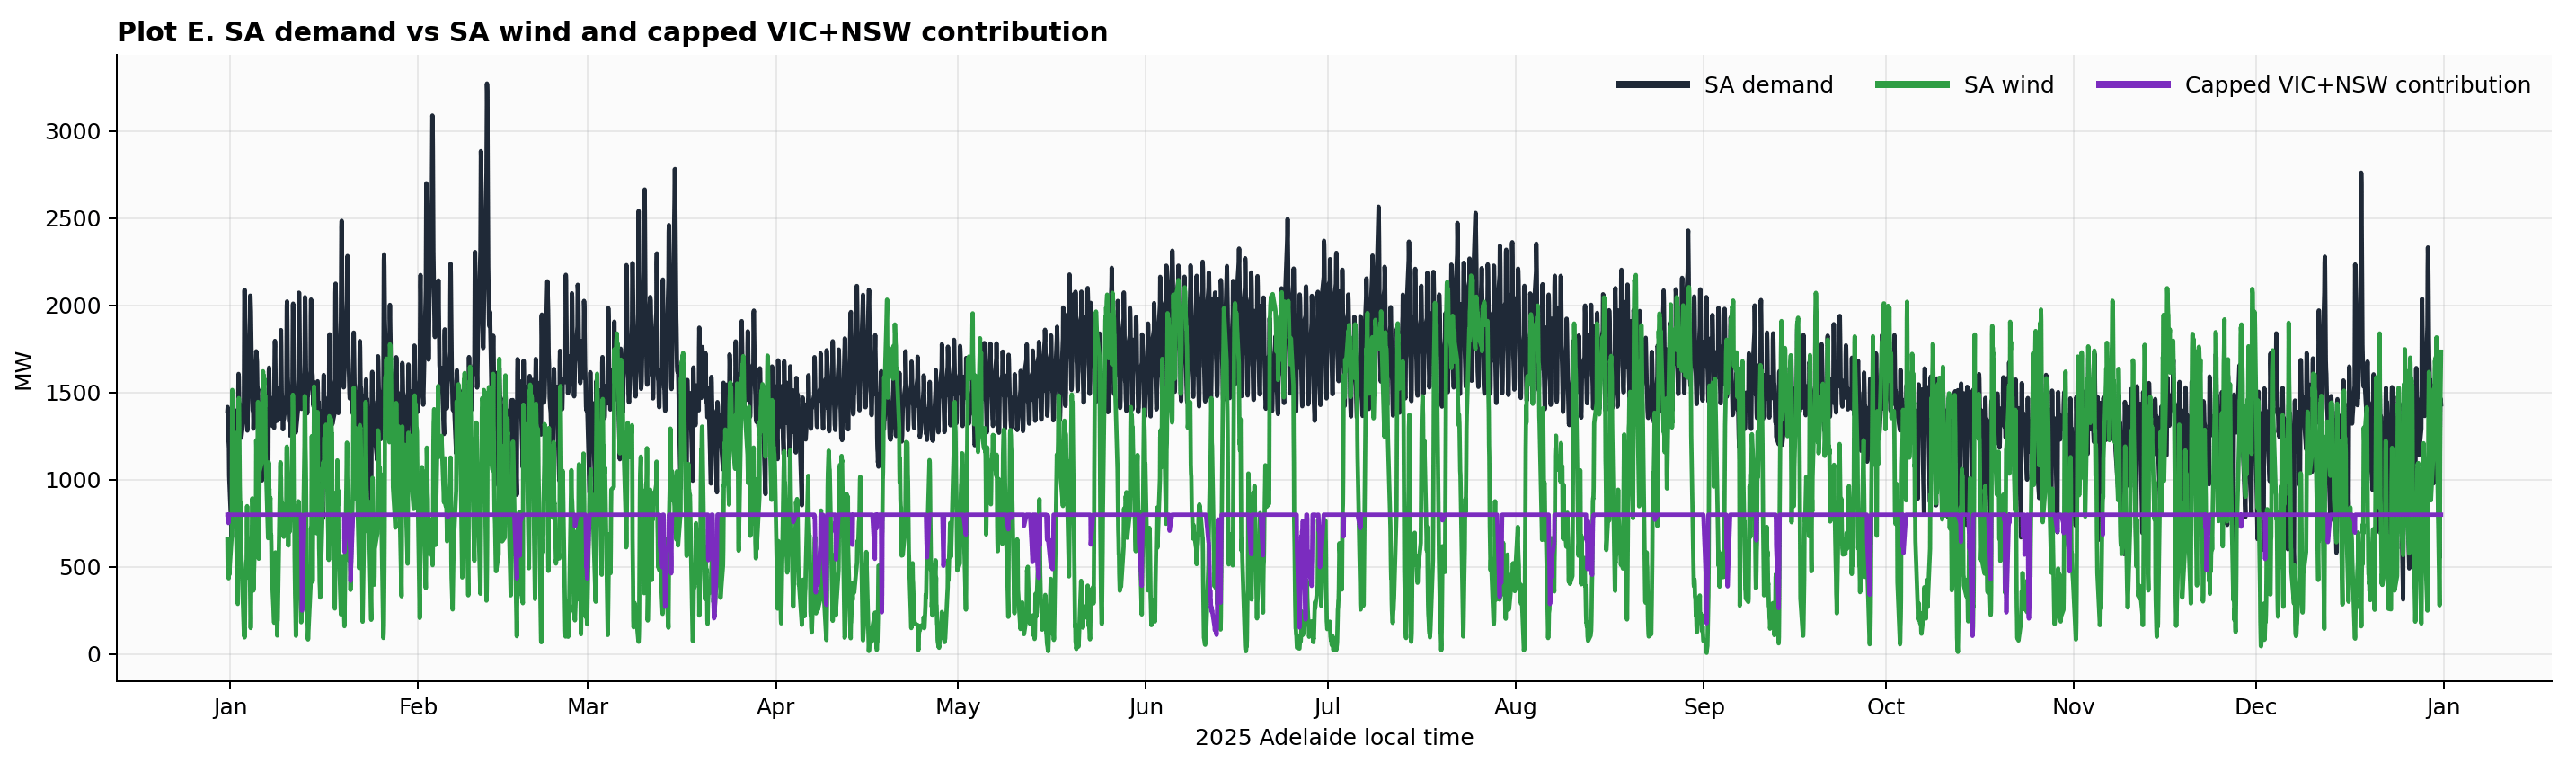
Plot E then applies a cap to the combined eastern contribution.
And this is where the tension in the system becomes very easy to see. There are many hours when the eastern wind resource is plainly there, but the deliverable contribution is pushed flat against the cap. In those moments the limiting factor is not the existence of wind. It is the size of the pipe.
That is a big deal.
It means that, in the hours where solar is gone, part of the problem is not “there is no renewable energy available.” Part of the problem is “there is renewable energy available, but the network cannot move enough of it into South Australia.”
That is not the whole problem. But it is very much part of it.
I then pushed the exercise further with a stylised stronger-eastern-support case.
To be clear, this is not a fantasy number pulled from thin air. Current plans are for Project EnergyConnect Stage 2 to lift the South Australia–southern NSW interconnector from today’s 150 MW Stage 1 to 800 MW in both directions, and AEMO says that also lifts nominal Heywood capability to 750 MW. AEMO’s latest timetable has PEC Stage 2 entering service in late 2026 and reaching full capacity in 2027; HumeLink, the new 500 kV NSW backbone linking Wagga Wagga, Bannaby and Maragle, is also scheduled for 2027. So this stronger-eastern-support case should be read not as today’s grid, but as a stylised version of the network planners are trying to build over the next couple of years.
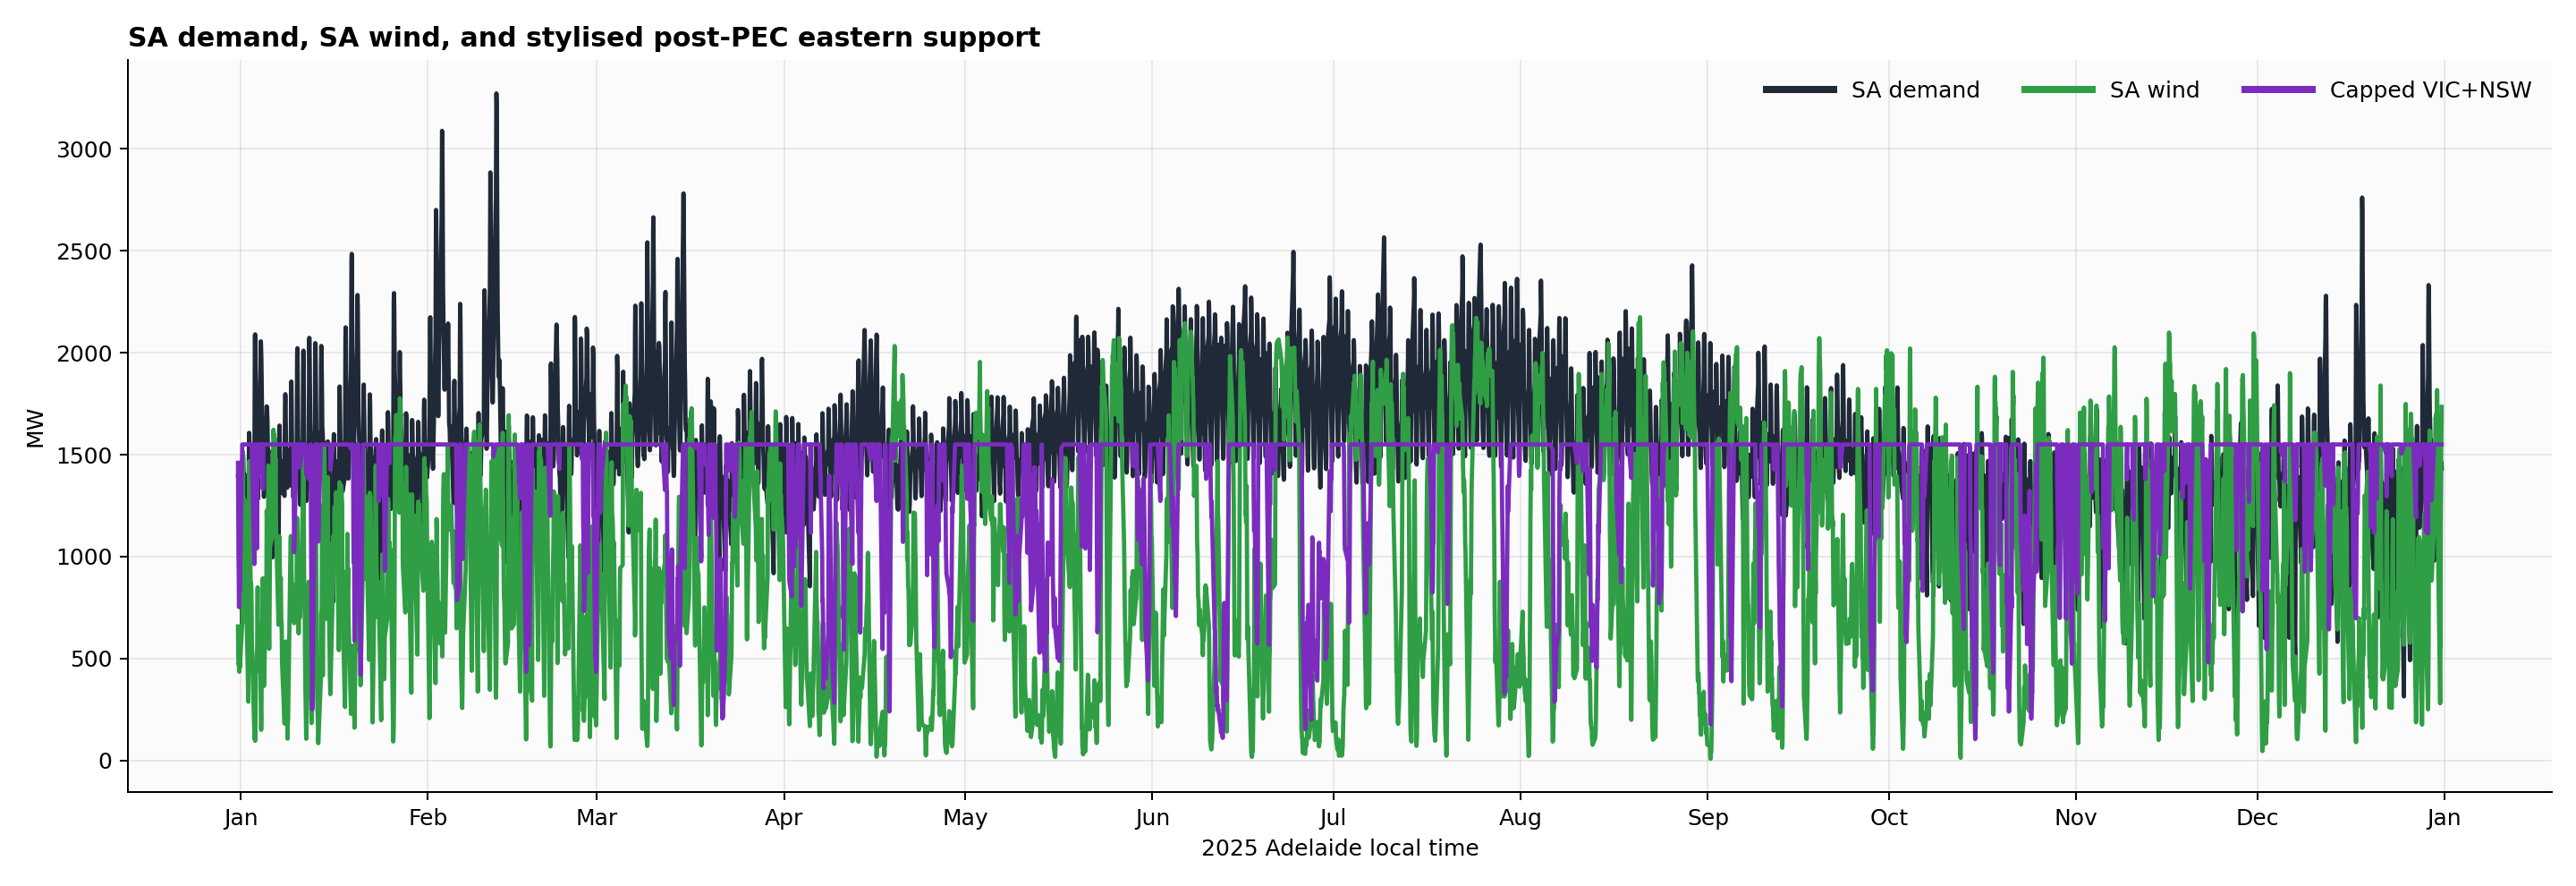
That is what the separate post-PEC-style plot is for.
Here the picture changes markedly. South Australian wind plus strong capped eastern support gets much closer to demand for a very large share of the selected hours. The gap does not disappear, but it starts to look much more like a tail problem — a problem of difficult residual hours — rather than a blanket impossibility across most of the night.
That is already more encouraging than the standard rhetoric would lead you to expect.
Chronological time series are good for intuition, but they are not the easiest way to compare cases.
So the next step was to rank the selected night hours from largest remaining shortfall down to zero shortfall, and draw duration curves. In these charts, lower is better.
This turns out to be a very clean way to see what each assumption is actually buying.
With South Australian wind on its own, the average remaining shortfall is about 648 MW, and there is no shortfall at all in only 19% of the selected hours.
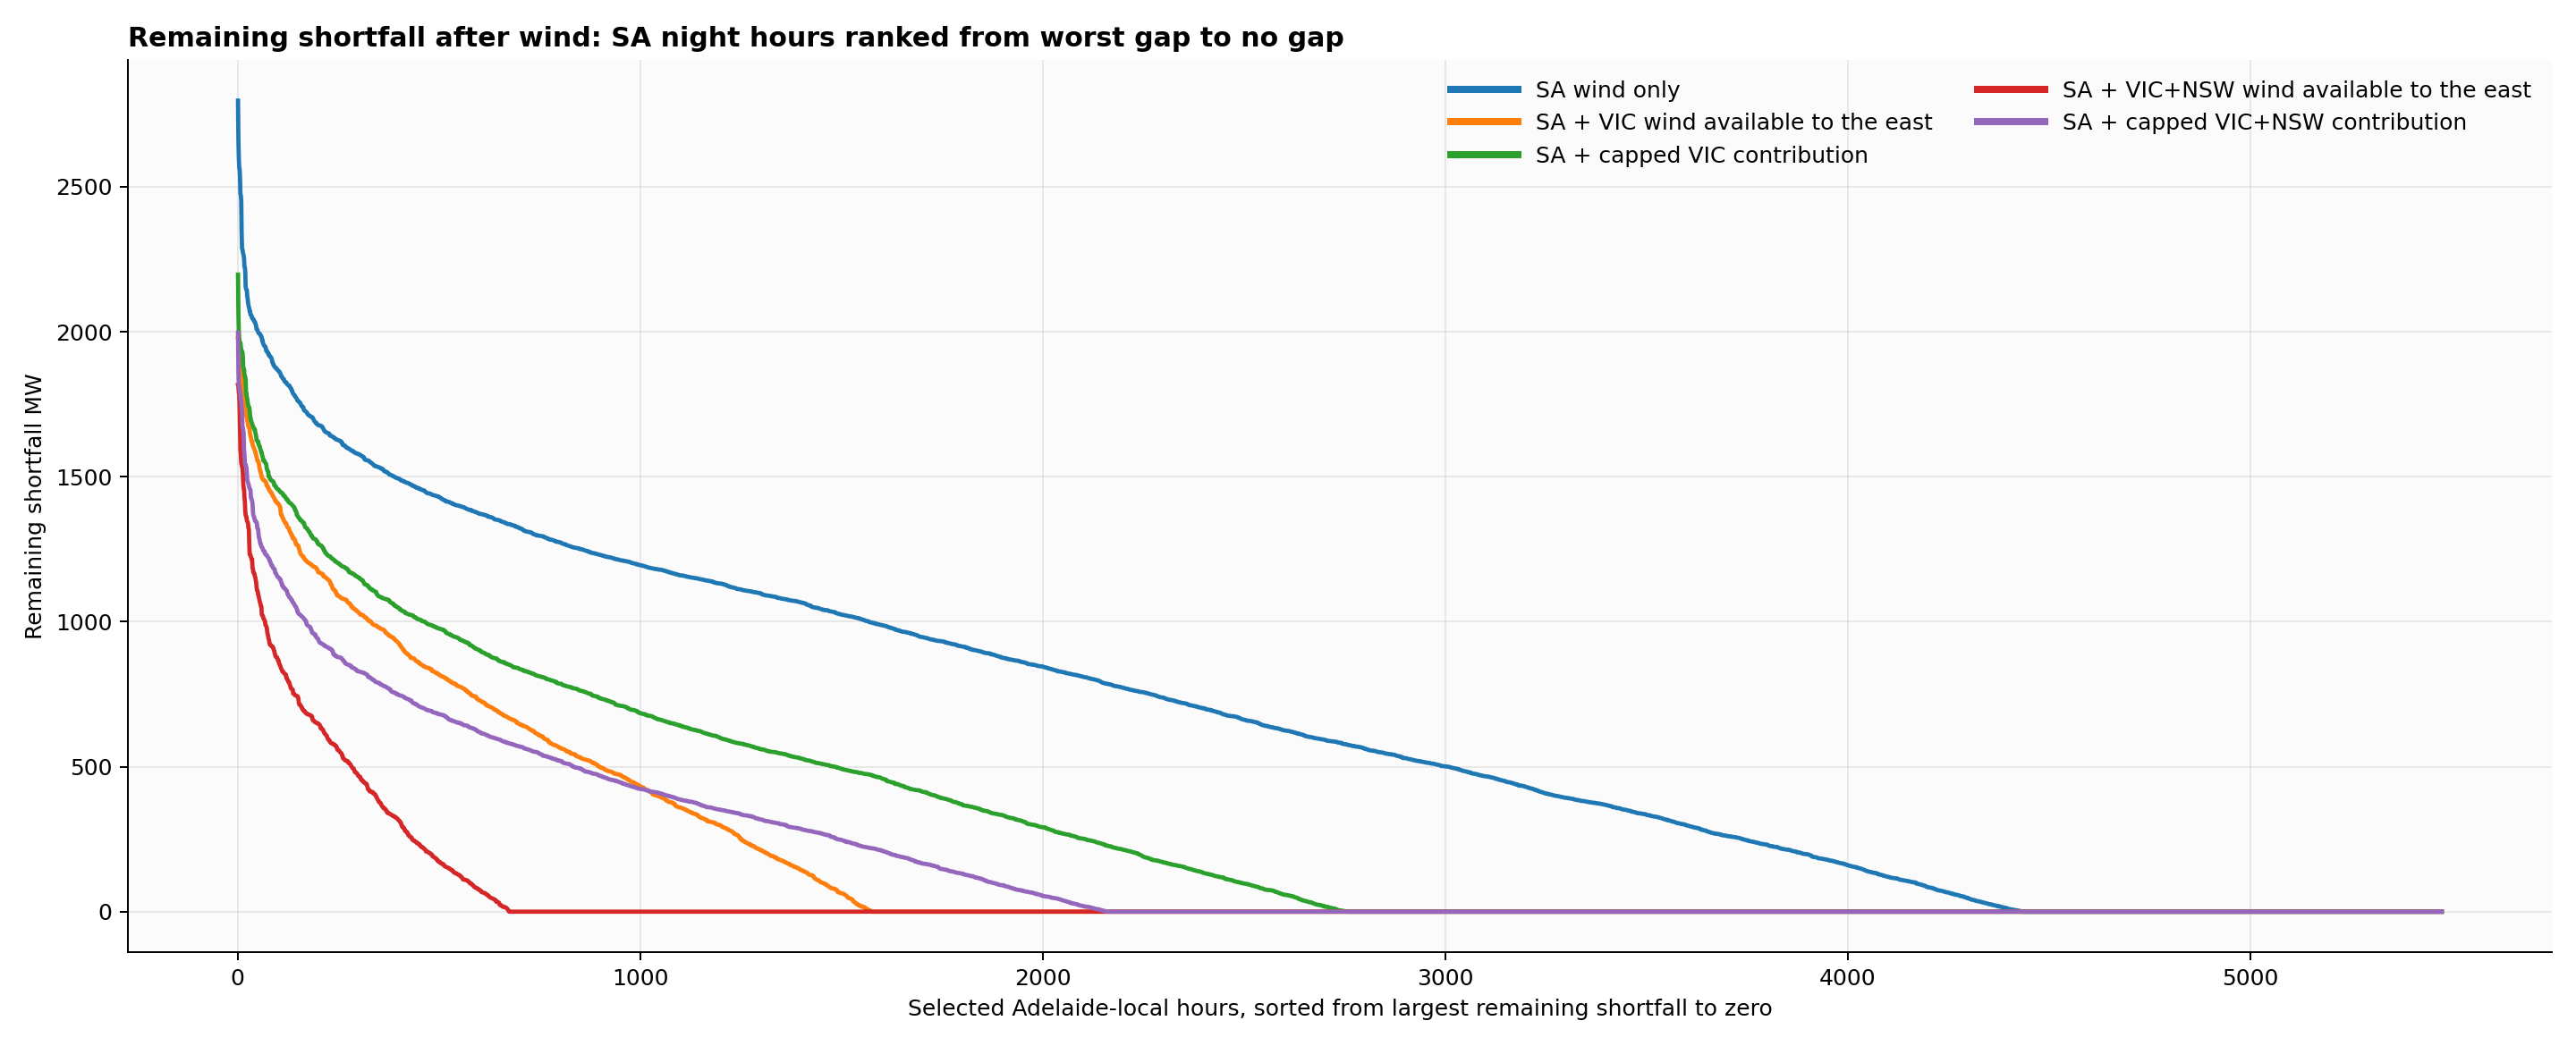
That is a useful baseline. South Australian wind does a lot, but on its own it leaves a substantial night-time gap.
A tightly capped eastern-support case helps, but not dramatically. Average shortfall falls to about 532 MW, and the no-shortfall share rises only to about 26%.
So a small amount of extra eastern transfer is nice, but it does not transform the problem.
I then tried simple overbuild thought experiments: SA wind x2 and SA wind x3. These are not physical build-out simulations. They are intuition-building scaling exercises.
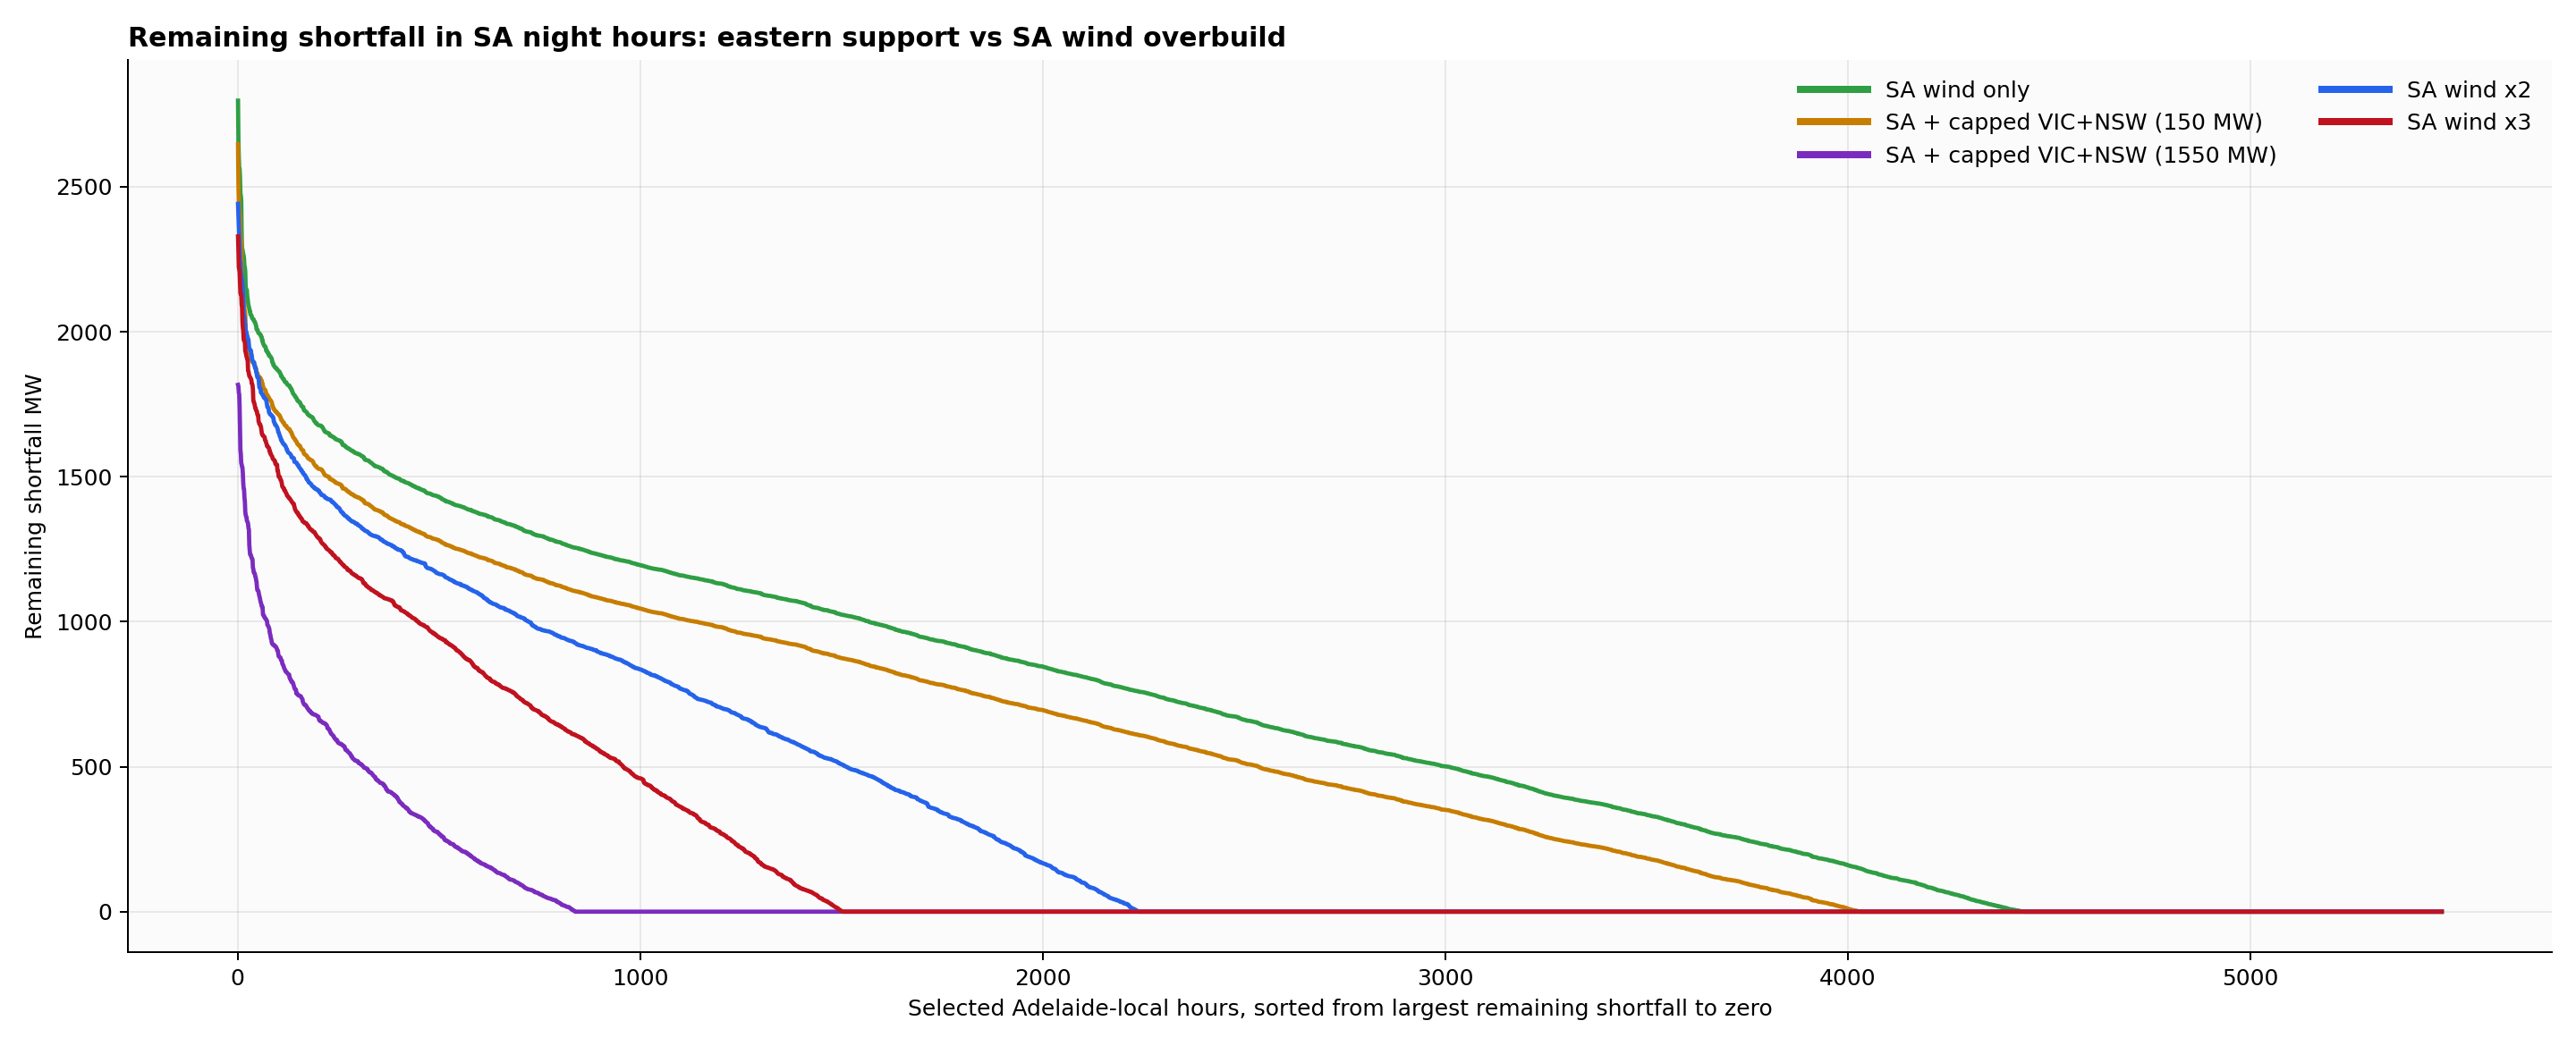
Doubling South Australian wind cuts the average shortfall to about 320 MW, with 59% of selected hours showing no shortfall.
Tripling it gets the average shortfall down to about 202 MW, with 72.5% of hours showing no shortfall.
So local overbuild clearly helps — and helps a lot.
But the really striking comparison is this:
Under the stylised strong-eastern-support case (purple line in figure above), the average shortfall falls to just 67.9 MW, and 84.7% of selected hours show no shortfall at all.
That is the result that surprised me most.
On this particular set of assumptions, stronger interconnection does more to shrink South Australia’s night-time gap than simply doubling or even tripling South Australian wind on its own.
That does not mean local wind build-out is unimportant. It means geography plus transmission is doing an enormous amount of work.
The last chart is, to me, the most encouraging one.
It asks a more refined question. Suppose strong eastern support exists. Suppose South Australia can already pull heavily on Victorian and NSW wind in difficult hours. What extra does South Australian wind overbuild still buy you on top of that?
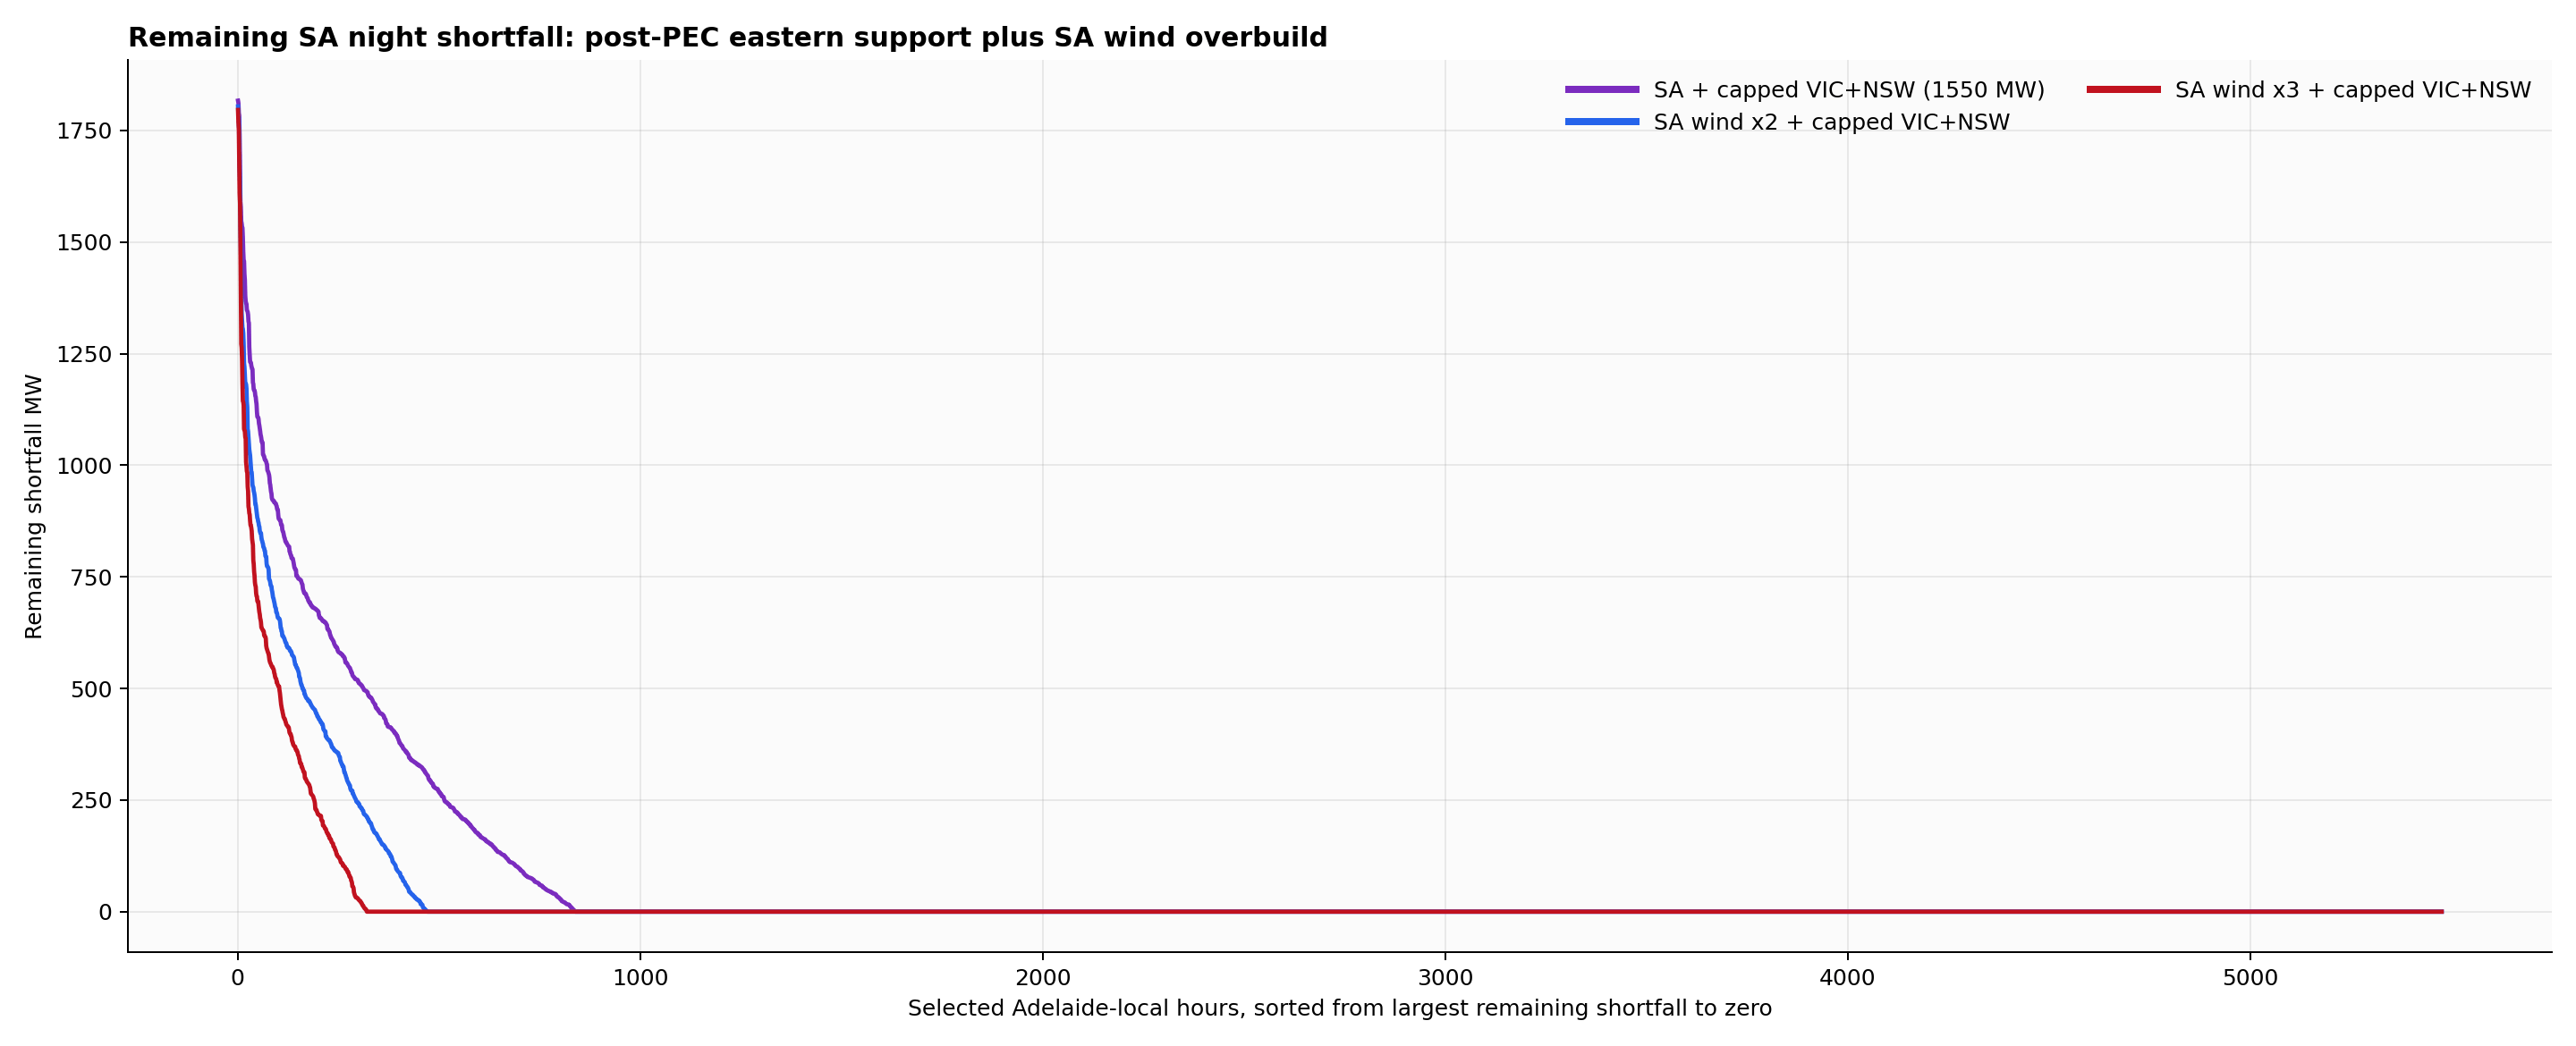
The answer is: still quite a lot, but in a more marginal way.
With strong capped eastern support alone, the average remaining shortfall is about 67.9 MW, and 84.7% of selected hours have no shortfall.
Add 2x South Australian wind, and the average shortfall falls to about 37.2 MW, with the no-shortfall share rising to 91.4%.
Add 3x South Australian wind, and the average shortfall falls further to about 23.6 MW, with the no-shortfall share rising to 94.2%.
That is a nice result because it shows the roles are complementary.
Interconnection does not make local wind unimportant. And local wind overbuild does not make interconnection unimportant. The two work together.
The eastern connection gets you a very long way. Additional local wind then makes the remaining difficult tail smaller still.
I think the basic message is now fairly clear.
At night, South Australia is not saved by any single magic answer. Not by local wind alone. Not by interconnectors alone. Not by a fantasy that some other region is always windy when South Australia is not.
But neither is it trapped in the simplistic story that “once solar is gone, renewables are basically useless.”
What the data suggests is something much more practical:
Wind diversity across SA, Victoria and NSW is real, but incomplete
Transmission turns that diversity into usable support
Stronger eastern links can make a very large dent in South Australia’s night-time gap
Further South Australian wind overbuild can then push the remaining tail down further still
That does not eliminate the need for storage, gas, demand response, or other firming tools. It changes the size of the remaining problem.
And that is the key point.
The issue after sunset is not necessarily a giant all-night cliff. Under reasonably strong wind and transmission assumptions, it becomes a much smaller set of difficult hours at the edge of the distribution.
That is still an engineering problem. But it is a far more tractable engineering problem than the usual caricature suggests.
These are simple, transparent thought experiments. They are not a full dispatch model. The strong-eastern-support case is stylised, not an official simultaneous transfer limit. The South Australian wind x2 and x3 cases are scaling exercises, not construction schedules.
But those caveats do not weaken the central result.
They sharpen it.
Because the first-order point is robust: wind plus interconnection can make a very large dent in South Australia’s solar-free hours. And when you combine stronger eastern support with more South Australian wind, the residual night-time problem becomes smaller again.
That does not prove the whole system is solved.
It does show that, after sunset, the problem is much less hopeless — and much more interesting — than either boosters or skeptics usually admit.
Two caveats matter. First, Victoria and NSW may need some or all of that wind themselves; these charts show availability and transfer envelopes, not a full market-clearing dispatch outcome. Second, South Australia is a relatively small region connected to much larger neighbours. That is a much easier problem than asking whether the same trick could carry Victoria. That is a separate question — and probably a subsequent article.
The next question is not just how often shortfalls appear, but how they cluster. One isolated short hour is a very different engineering problem from ten or twelve consecutive hours of low residual supply.
Sources: AEMO NEMWeb public data. Demand is South Australia’s Five-minute Actual Operational Demand series; wind output is aggregated from unit-level Actual Generation and Load SCADA data for wind DUIDs in SA, Victoria and NSW. Overnight charts use Adelaide local time and include only the 5pm–8am window in calendar 2025.
Comments
Nothing yet. Say the first thing.
Sign in to join the conversation.