Building a Local AI Agent in Go -- Part 7: Observability
Part 7 of 7. The four visibility layers that ship with the agent -- verbose CLI logs, the live web dashboard + SSE event stream, OpenTelemetry traces, and OpenTelemetry and Prometheus metrics.

CTO/Co-Founder @SmartTechLabs - System Architect, AI, ML, LLM Consulting, Embedded, Data Spaces, Observability, Digitalization Consulting, WebRTC&VR/AR/MR. Start-Ups. Consulting
Live Last read · last published · next check
Part 7 of 7. The four visibility layers that ship with the agent -- verbose CLI logs, the live web dashboard + SSE event stream, OpenTelemetry traces, and OpenTelemetry and Prometheus metrics.
Companion to the blog series.
Part 6 of 7. Pointing the agent at any LLM endpoint -- Lemonade, LM Studio, vLLM, Ollama, OpenAI / Groq / Together / Mistral / DeepSeek / OpenRouter, Google Gemini, and Anthropic Claude
Part 5 of 7. Extending the agent with narrow MCP servers, smart web fetching via llms.txt, Lemonade Server management for AMD, running the full system end-to-end, and operational troubleshooting.
Part 4 of 7. A file-by-file walkthrough of every source file in the agent: entry point, config, agent loop, LLM client, MCP manager, tool parser, events, web dashboard, REST API, HITL and more..
Part 3 of 7. The core agent loop: how the LLM and tools alternate, ten distinct termination paths, per-query safety limits, and handling models that encode tool calls differently.
Part 2 of 7. What MCP is, how the JSON-RPC protocol works under the hood, how tools plug into the agent, and how MCP fits into the broader agent ecosystem.
Build your own Agent in Golang. Use local and cloud LLM models.
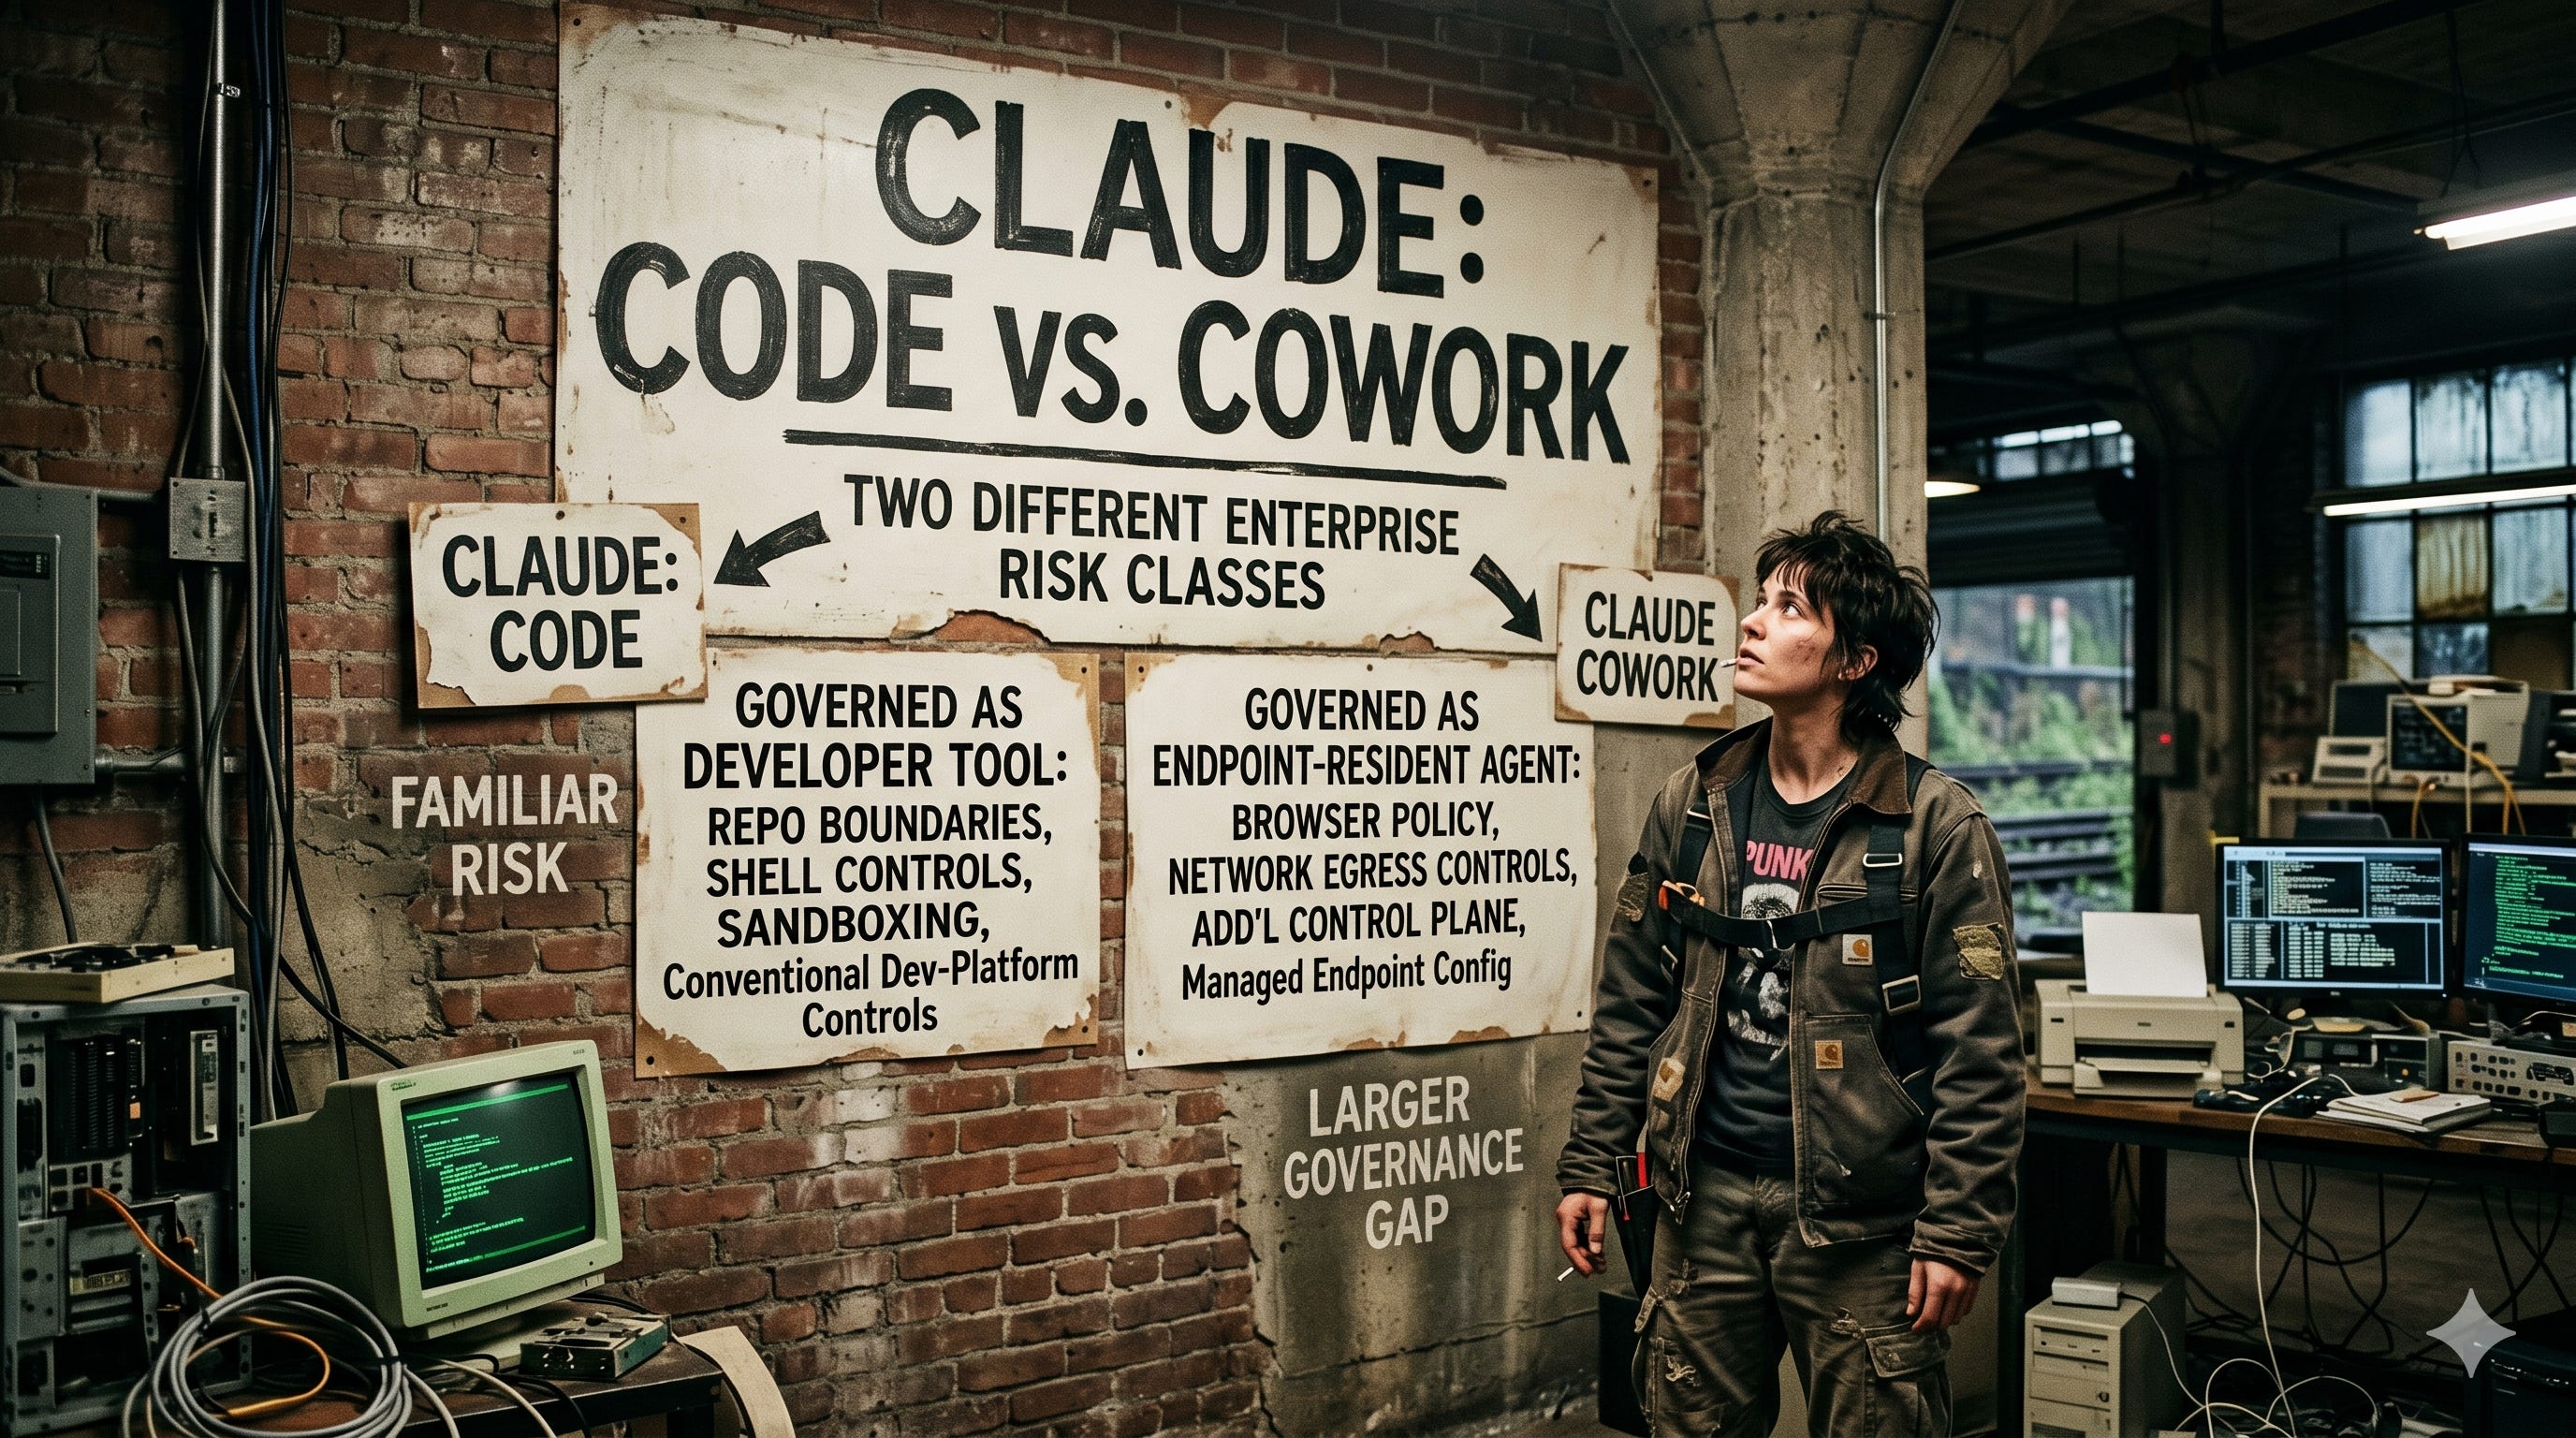
A technical paper on agentic productivity, audit gaps, telemetry design, and enterprise control planes
A short journey connecting a few dots along the road - ending up in dangerous Agent-Land anyways.