
Series: Part 1: Introduction & Motivation | Part 2: Understanding MCP | Part 3: The Agent Loop | Part 4: Inside the Codebase | Part 5: Operations & Extending | Part 6: Running It Yourself | Part 7: Observability | Building a Local AI Agent in Go -- Bonus: Agent Setup & Usage Guide | GitHub
Check the code on GitHub. Let me know if and how you are using it in your projects.
In Part 3 we covered the agent loop and its termination logic. Now let’s walk through every file in the codebase to see how each concern is separated.
The agent is ~5,000 lines of Go spread deliberately across many small files plus one reference MCP server. The split reflects responsibility: orchestration in agent.go, the loop in session.go, termination heuristics in policy.go, stateless helpers in util.go, the HTTP scaffold in web.go with each surface (REST query, REST admin, MCP gateway) in its own web_*.go sibling. This section walks through each file top-down, from the entry point to the narrowest component.
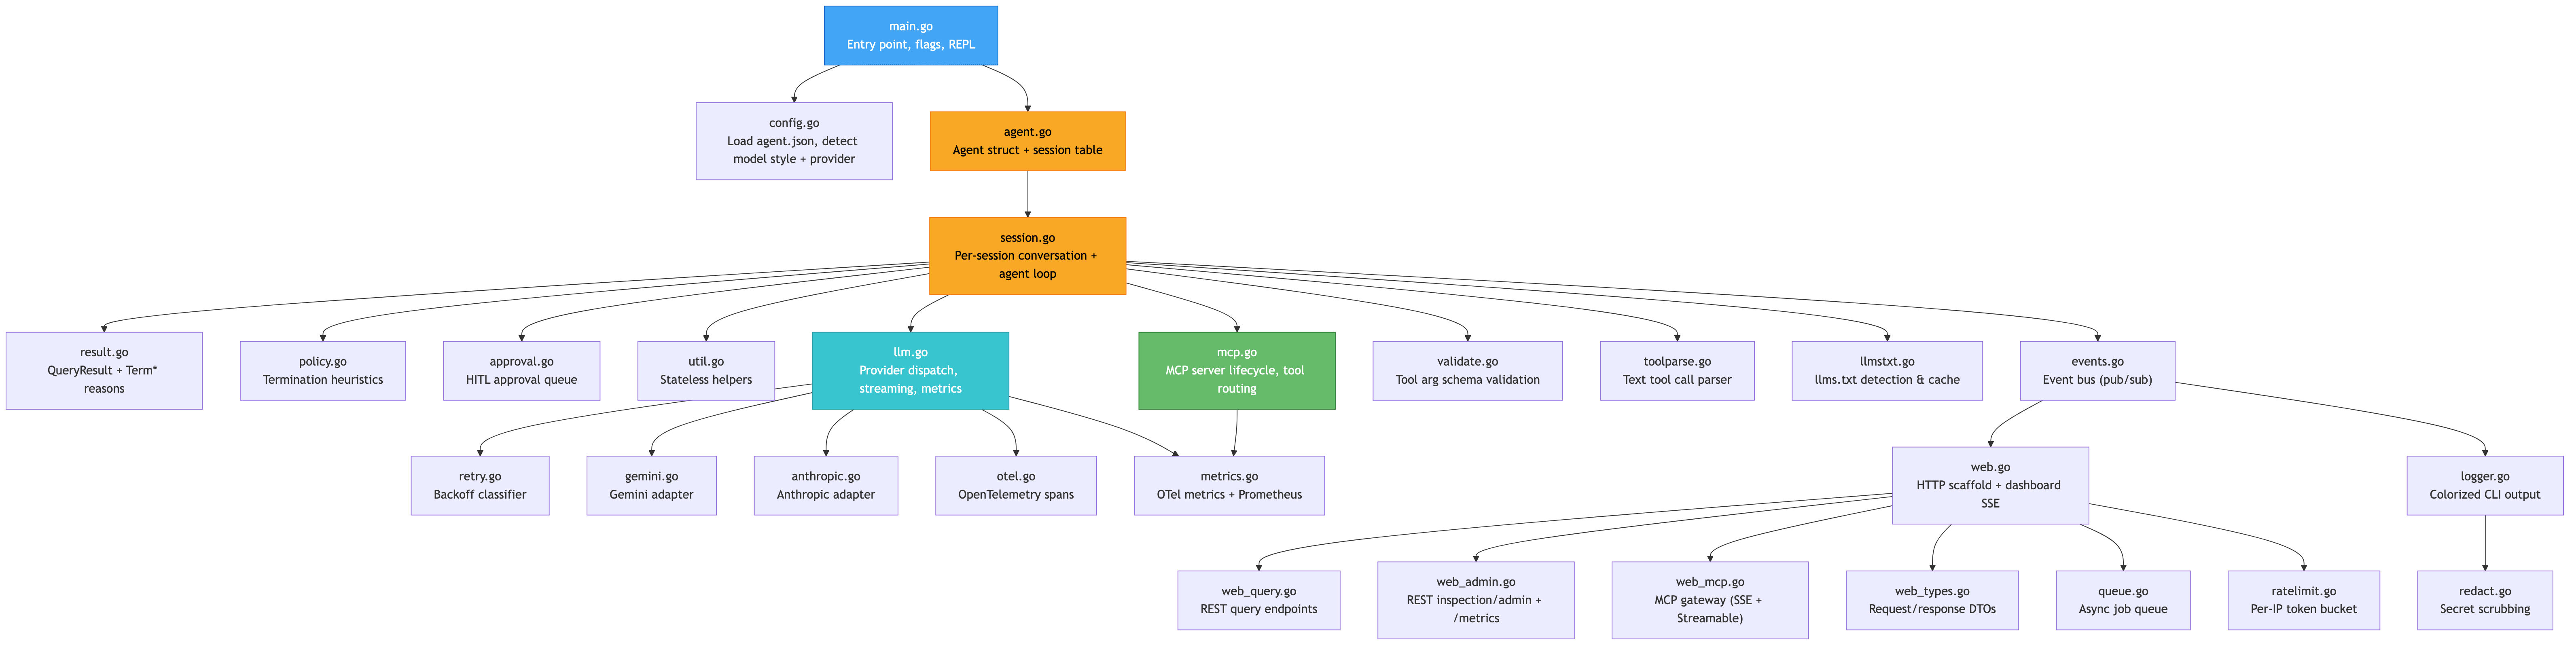
The orchestrator that wires everything together: parses flags, loads config, starts the web dashboard, creates the agent, and runs either single-query or interactive mode.
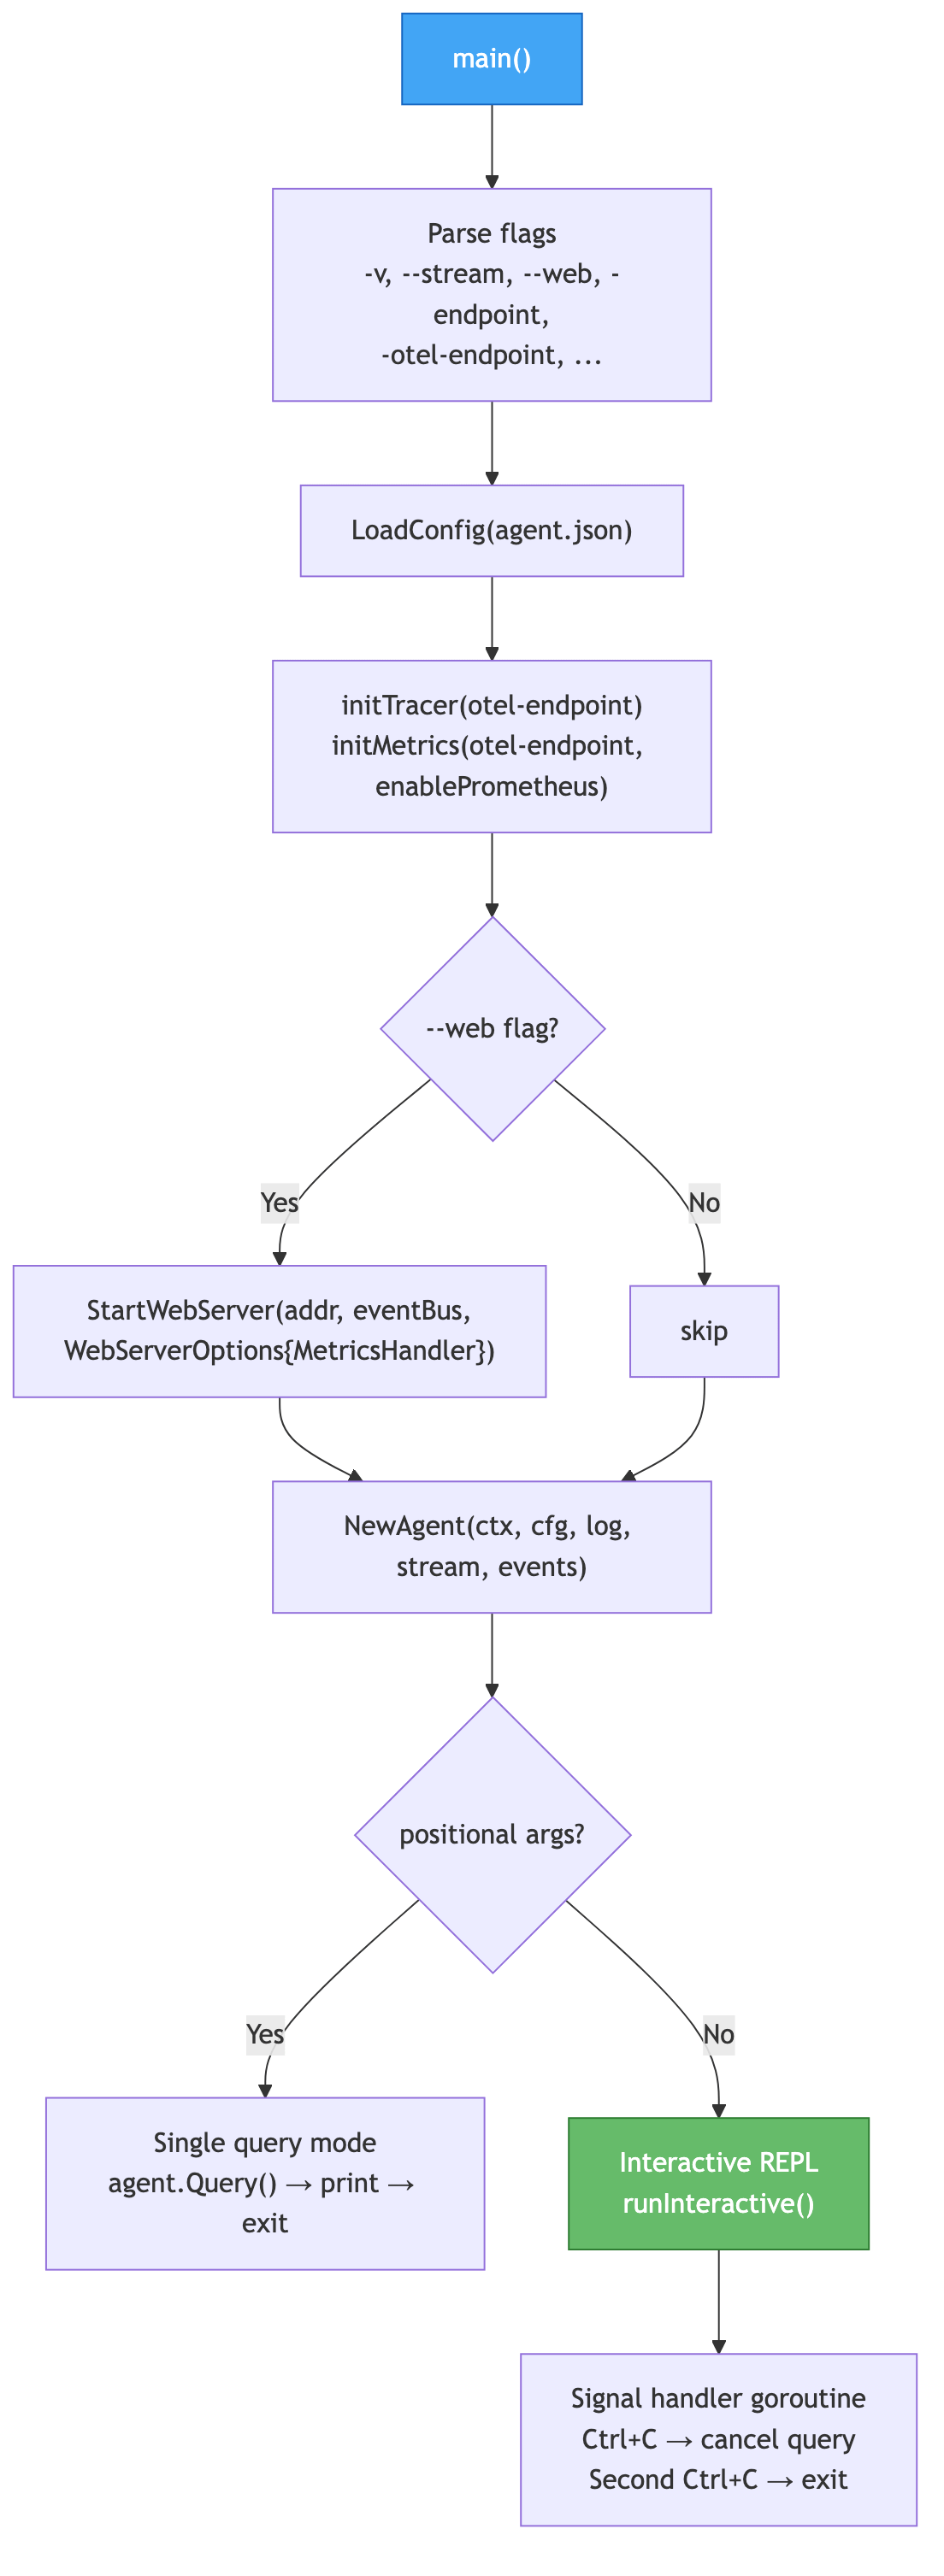
main.go also wires the two halves of the observability stack: initTracer sets up the OTLP/HTTP tracer when -otel-endpoint is set, and initMetrics -- right after it -- sets up the metric pipeline (OTLP push when -otel-endpoint is set, Prometheus pull when -web is set; either, both, or neither). The Prometheus http.Handler it returns is threaded into WebServerOptions.MetricsHandler so the web server can mount it at /api/v1/metrics. See metrics.go further down for what gets recorded.
Key design: the interactive mode uses per-query context cancellation. Each query gets its own context.WithCancel. When Ctrl+C arrives, only the running query’s context is cancelled -- the agent stays alive and returns to the prompt.
go
// Per-query context that Ctrl+C can cancel independently.
queryCtx, cancel := context.WithCancel(rootCtx)
queryMu.Lock()
queryCancel = cancel  // Signal handler will call this on Ctrl+C
queryMu.Unlock()
resp, err := agent.Query(queryCtx, input)
Loads agent.json, expands environment variables, normalizes the endpoint URL, detects the tool call style from the model name, auto-detects the LLM provider from the endpoint URL, and resolves defaults for all optional fields.

The AgentConfig struct holds everything:
go
type AgentConfig struct {
    Model         string         // "Qwen3-Coder-30B-A3B-Instruct-GGUF"
    EndpointURL   string         // "http://localhost:13305/api/v1"
    Provider      LLMProvider    // "auto" (default), "openai", "gemini", "anthropic"
    Servers       []ServerConfig // MCP server definitions
    ToolCallStyle ToolCallStyle  // "auto", "native", "text"
    LLMsTxt       LLMsTxtMode    // "auto", "prefer", "ignore"
    MaxResultLen  int            // max tool result chars (default 16000)
    MaxToolRounds int            // max loop rounds (default 10)
    SystemPrompt  string         // from PROMPT.md or inline
}
Provider auto-detect (detectProvider) is a one-pass URL scan: a *googleapis.com host routes to the Gemini adapter, *anthropic.com to the Anthropic adapter, anything else to the OpenAI-compatible client. Lemonade, LM Studio, Ollama, vLLM, llama.cpp, OpenAI itself, Groq, Together, Mistral, and DeepSeek all flow through that last branch with no per-vendor code -- they speak the same wire format.
Model detection uses simple string matching -- qwen → text style, llama/mistral/gpt- → native. This is deliberately naive and overridable via -tool-style.
Owns the durable shared state: the LLM client, the MCP manager, the snapshot of registered tools, the logger, the event bus, and the table of live sessions. NewAgent wires everything up and starts the idle-session reaper; GetOrCreateSession / LookupSession / DeleteSession are the session-table API. The CLI’s implicit “default” session is created here so single-shot queries work without the caller knowing about sessions at all.
agent.go also owns the startup checkContextSize() probe: on local OpenAI-compatible backends that expose llama.cpp’s /slots endpoint (Lemonade, LM Studio, plain llama.cpp) it reads the actual n_ctx value and warns if it’s below 8192. Cloud providers (Gemini, Anthropic) and backends without /slots skip the check silently.
What it deliberately doesn’t own: the agent loop. That lives in session.go so per-session concurrency falls out naturally -- two REST clients with different session_ids run their loops in parallel, two with the same session_id are serialised by the session’s own mutex.
Each Session holds its own history []openai.ChatCompletionMessage plus the metadata the agent loop needs (recent tool fingerprints, failed-tool counter, run mutex). Query / QueryWithLimits / QueryDetailed enter the loop on a session.
The loop itself is the diagram below. Same shape regardless of which file holds the for-statement; what session.go adds is per-session isolation, history bookkeeping, and the surface area the per-query safety limits clamp against.
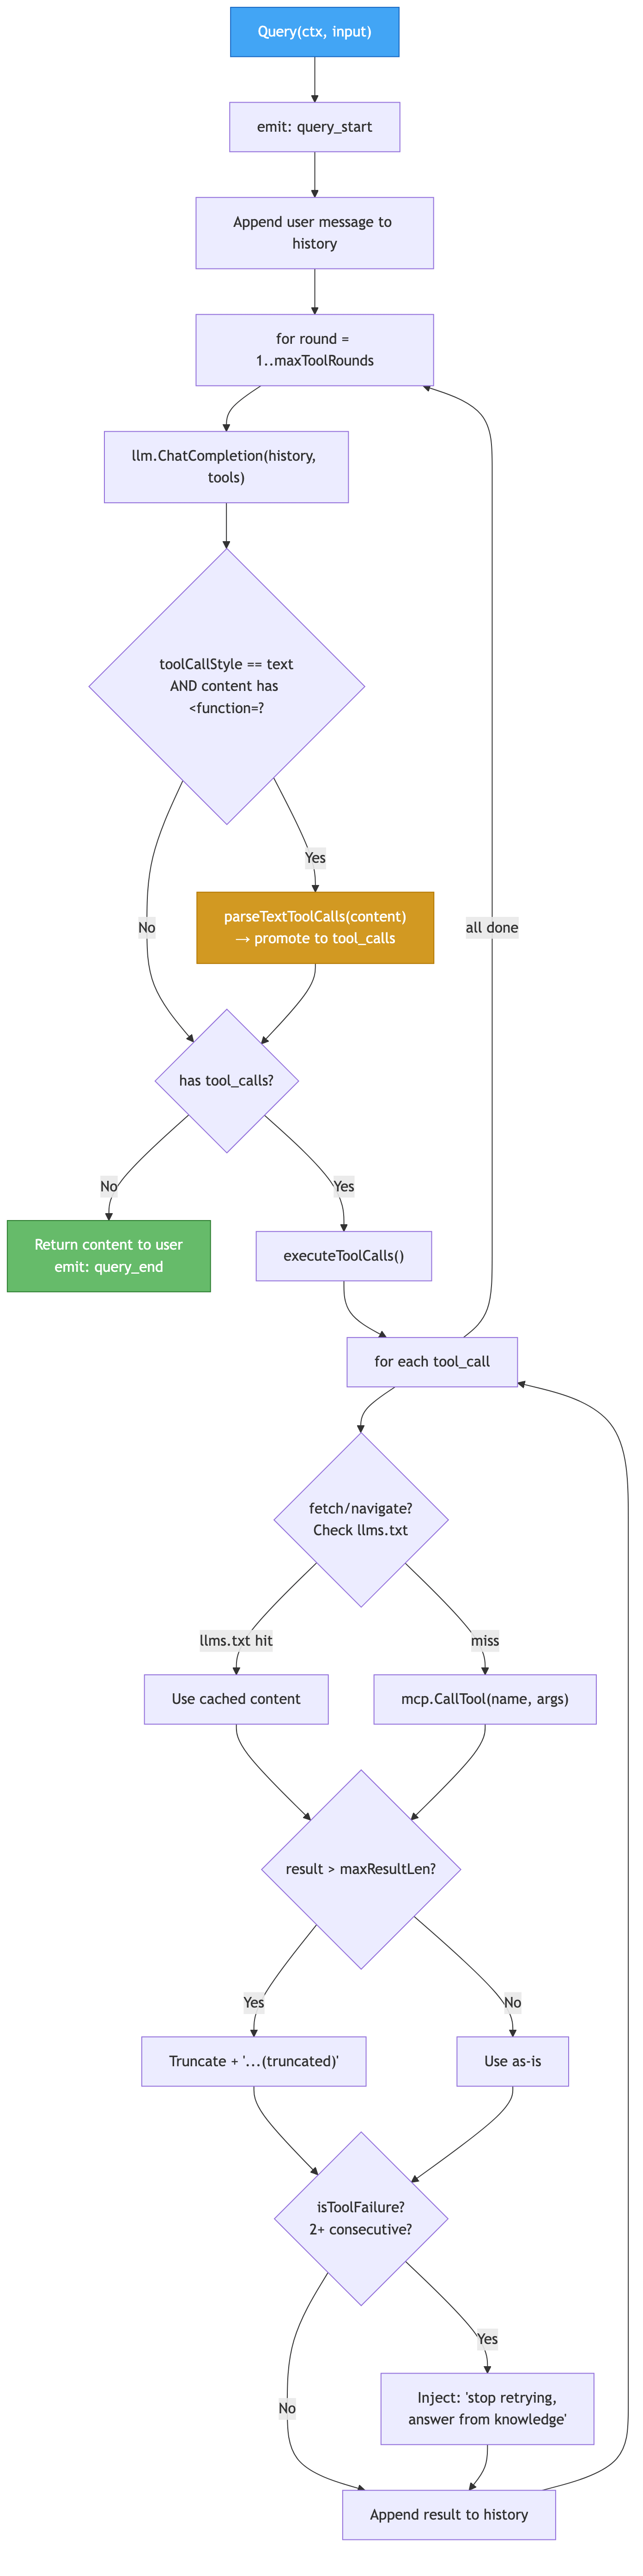
Tool execution is concurrent with a cap. When the LLM emits several tool calls in one response, executeToolCalls (in session.go) runs them in parallel behind a semaphore fixed at maxParallelToolCalls = 4. This is a deliberate compromise: unbounded fan-out could exhaust file descriptors on stdio MCP servers, blast rate limits on any tool that proxies to an external API, and make the dashboard unreadable; serial execution throws away easy speedups when the model fires off independent reads. Four is enough to hide I/O latency for typical fetch/browser mixes without any of the failure modes. Phase 1 (the I/O) runs concurrently; phase 2 (history append, failure bookkeeping) runs serially in the order the LLM requested -- so assistant → tool_result pairs still line up when the next round reads the history back.
What every query returns, and the controlled vocabulary that describes how it ended.
QueryResult is always non-nil. Even hard errors come back wrapped in this shape, so callers (the CLI, the REST handlers, the MCP gateway) don’t have to branch on nil vs error — they branch on IsSuccess() or on TerminationReason.
TerminationReason is always set, drawn from a fixed set of Term* constants:
TermCompleted— happy path, LLM produced a final answerTermMaxRounds,TermTokenBudget,TermTimeout,TermLoopFingerprint— soft limits the loop hitTermTerminalError— non-retryable API error (perpolicy.go)TermLLMError,TermToolError— backend/tool failures we couldn’t recover from
That vocabulary is the same string metrics.go uses as a counter label (agent_queries_total{termination_reason="..."}), and the same one the dashboard groups rounds by. One spelling, three audiences.
Answer and Error are mutually informative, not mutually exclusive. On success, Answer is set and Error is empty. On hard errors, Answer is empty and Error is set. On early stop after a soft limit, both can be non-empty — the agent synthesised a partial answer (Answer) and recorded which budget it ran into (TerminationReason + Error).
REST responses serialize QueryResult directly. MCP tools/call responses attach the same fields under the spec-reserved _meta key (io.llm-agent/* namespace) so external MCP clients see them without redefining the response shape.
Two functions, both substring-matching policies that decide when to give up:
isTerminalError(err)-- returns true for errors that should abort the loop immediately rather than be retried: 401/403/404, “unauthorized”, “invalid api key”, “permission denied”, “quota exceeded”. These are the things where retrying just burns budget. Substring-matched on a lower-cased error string because Go’snet/httpand most LLM SDKs return errors as plain strings without typed status codes; the trade-off is that an unrelated message containing one of these tokens (rare but possible) will also be treated as terminal.isToolFailure(result)-- returns true for empty results and for the few error markers we’ve seen in practice from MCP servers (error:prefix,(no results),(no content),{"error":...}JSON). Markers are anchored to the start of the trimmed result so legitimate tool output discussing errors in passing isn’t flagged. There is intentionally no minimum length floor -- a previous version mis-classified valid short responses likePort 8000: idle(16 chars).
Both are advisory: false positives bound the agent earlier than necessary but don’t corrupt data. When MCP gains structured error envelopes (it doesn’t standardize them today) we’ll switch to typed checks.
While most of the flow works automatically in loops till the result is reached or our exit filters kick in, we also have the human-in-the-loop gate. This optional gate pauses tool execution until a human approves. Configured per-agent with requireApproval: ["glob-pattern", ...]in agent.json; tools whose names match any of those patterns block before dispatch.

Two safety properties matter. Fail-safe timeout -- a pending approval that nobody resolves within approvalTimeoutSeconds (default 60) auto-denies, so a query can’t hang forever waiting on an operator who’s left for lunch. Argument redaction -- the approval event runs the same Redact() pass as logs, so an operator approving a tool call doesn’t see API keys or tokens that happened to land in the args.
A denied call doesn’t fail the loop; it returns a permission denied tool result and the LLM moves on (usually answering “I’d need approval for that”). That’s deliberate -- denial is a routine outcome, not an exceptional one.
Turning it on. The shipped agent.json files don’t set requireApproval, so out of the box every tool call runs without prompting -- requiresApproval() short-circuits to true whenever the pattern list is empty. There’s no CLI flag; activation is config-only. Add a glob list to the agent config:
json
{
  "model": "Qwen3-8B-GGUF",
  "endpointUrl": "http://localhost:13305/api/v1",
  "requireApproval": ["write_*", "browser_navigate", "execute_*"],
  "approvalTimeoutSeconds": 60,
  "servers": [ ... ]
}
Then drive the queue from any operator surface. The dashboard renders pending requests inline (see Part 7), but the REST endpoints are equally usable from a script or another agent:
bash
curl http://localhost:3131/api/v1/approvals
curl -X POST http://localhost:3131/api/v1/approvals/appr-abc123 \
  -H 'Content-Type: application/json' -d '{"approved": true}'
The operator-side flow -- event payloads, dashboard integration, and how this becomes the enforcement point for a future policy engine -- is covered in Part 7 § Approval events and the HITL queue.
A small kit used across the loop and the dashboard: truncateLog (shorten strings for log output), summarizeMessages (render the history transcript for the dashboard’s context panel), historySize (cheap character-count proxy for “is this conversation getting too big”), extractURL (pull the url field out of a tool-call args blob, used by the llms.txt fast path), countTrailingMatches (counts repeated trailing entries in a slice, used by the loop fingerprint detector). Nothing here holds state or has side effects beyond returning a value -- they live in their own file so agent.go and session.go stay focused on orchestration.
The provider dispatcher. LLMClient holds three possible backends -- a go-openai client for OpenAI-compatible endpoints, a GeminiClient, and an AnthropicClient -- and routes every ChatCompletion call to whichever one matches the configured provider. Handles streaming and non-streaming requests, measures TTFT and token metrics, retries transient errors (429/503/504, mid-stream EOF, connection refused), and includes a debug HTTP transport for verbose mode.
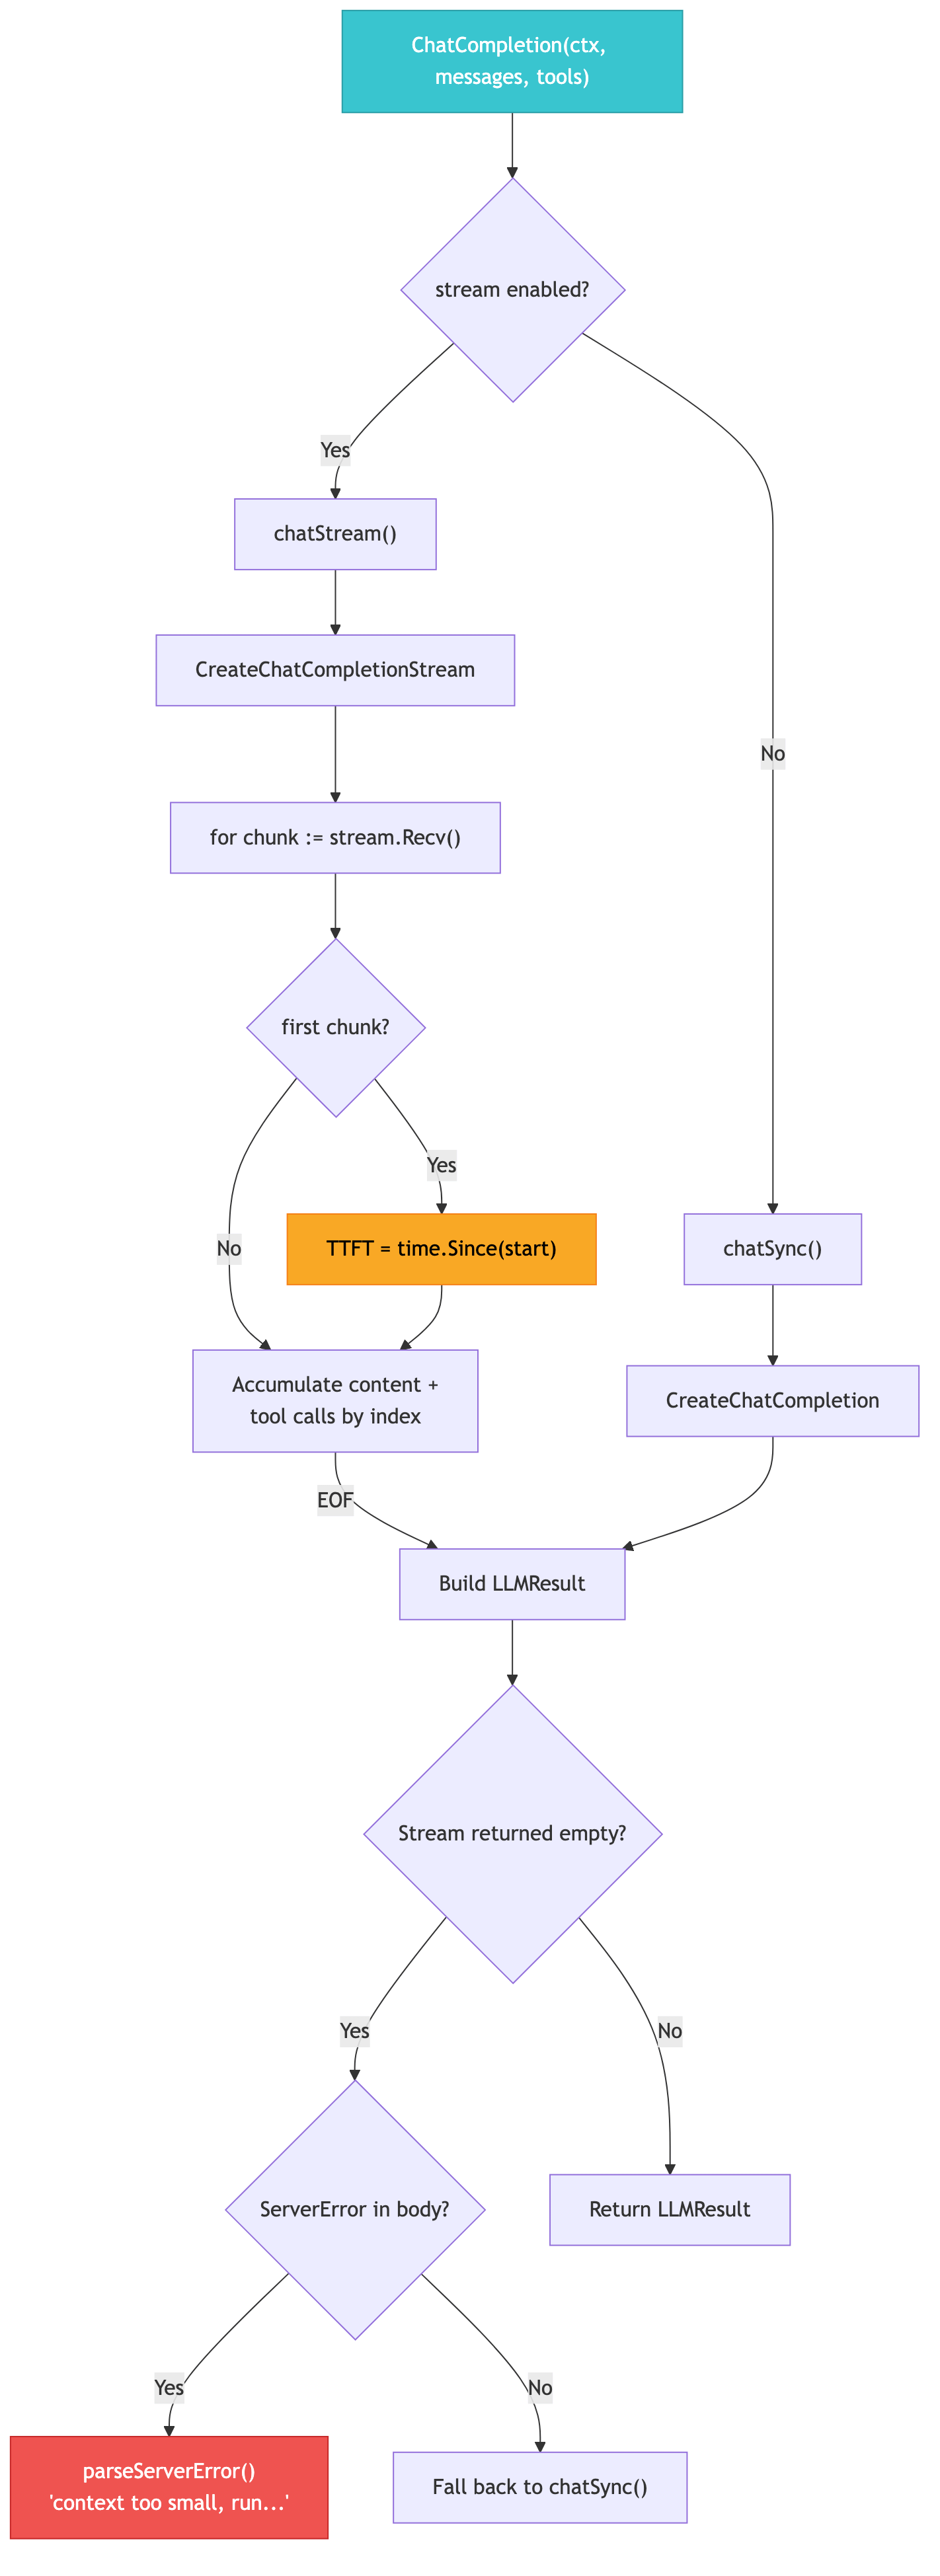
The LLMResult carries everything downstream consumers need:
go
type LLMResult struct {
    Message      openai.ChatCompletionMessage  // content + tool_calls
    FinishReason string                         // "stop", "tool_calls", "length"
    Usage        LLMUsage                       // prompt/completion/total tokens
    TTFT         time.Duration                  // time to first token
    Elapsed      time.Duration                  // total response time
    ServerError  string                         // raw error from stream body
}
In verbose mode, llm.go injects a debugTransport that wraps http.DefaultTransport. It logs every HTTP request/response and captures the first 500 bytes of streaming bodies via a peekReadCloser -- this is how we discovered that Lemonade sends context-size errors as raw JSON inside SSE streams.
retryWithBackoff is the wrapper llm.go::ChatCompletion uses to absorb transient failures. The interesting part is the classifier — isRetryable(err) — that decides which errors are worth a second attempt:
Retry: 429 (rate-limited), 503 (service unavailable), 504 (gateway timeout),
connection refused, mid-stream EOF,i/o timeout,connection reset, and the specific OpenAI-SDK error wrappers around those.Don’t retry: 4xx other than 429 (caller’s fault — won’t get better on retry), terminal errors per
policy.go::isTerminalError, and context cancellation (the caller already gave up).
Default is three attempts with exponential backoff (200 ms × 2ⁿ) plus 50 ms of jitter so concurrent agents don’t synchronize their retries. The exponential matters more than the jitter for handling sustained server-side issues; the jitter just prevents thundering herds.
Context cancellation bypasses the whole thing: ctx.Err() short-circuits before the next attempt so a Ctrl+C or wall-clock timeout exits immediately rather than waiting out the backoff.
Translates between the OpenAI chat-completion shape the agent loop speaks and Google’s google.golang.org/genai API. The adapter is intentionally one-way: the rest of the codebase never sees a Gemini-specific type.

Two interesting bits:
Tool-call IDs are synthesized. Gemini’s
functionCallparts don’t carry a stable ID the way OpenAI’stool_calls[].iddoes. The adapter mintscall__so the loop can pair tool results back to calls when it serializes history for the next round.System messages move. OpenAI puts the system prompt inline in
messages; Gemini takes it out-of-band on the request assystemInstruction. The adapter strips system messages from the converted history and routes them to the right field.
Token usage maps from usageMetadata (promptTokenCount, candidatesTokenCount, totalTokenCount) so TTFT/tok-per-sec metrics work the same way as for OpenAI-compatible backends.
Same shape as gemini.go, but against Anthropic’s Messages API. Translates between OpenAI’s tool_calls and Anthropic’s tool_use content blocks.

A few Anthropic-isms the adapter hides from the loop:
tool_resultis a content block, not a role. OpenAI sends tool results as messages withrole: "tool"; Anthropic sends them astool_resultcontent blocks inside ausermessage. The adapter rewrites the history into Anthropic’s shape on the way out and back into OpenAI’s shape on the way in.System prompt moves to the top-level
systemfield, like Gemini.Stop reasons are normalized:
end_turn/stop_sequence→stop,tool_use→tool_calls,max_tokens→length. The loop’sfinishReasonchecks keep working unchanged.
Manages the full MCP lifecycle: spawn subprocesses, handshake, discover tools, filter with allowTools, build the toolMap, and route tool calls at runtime.
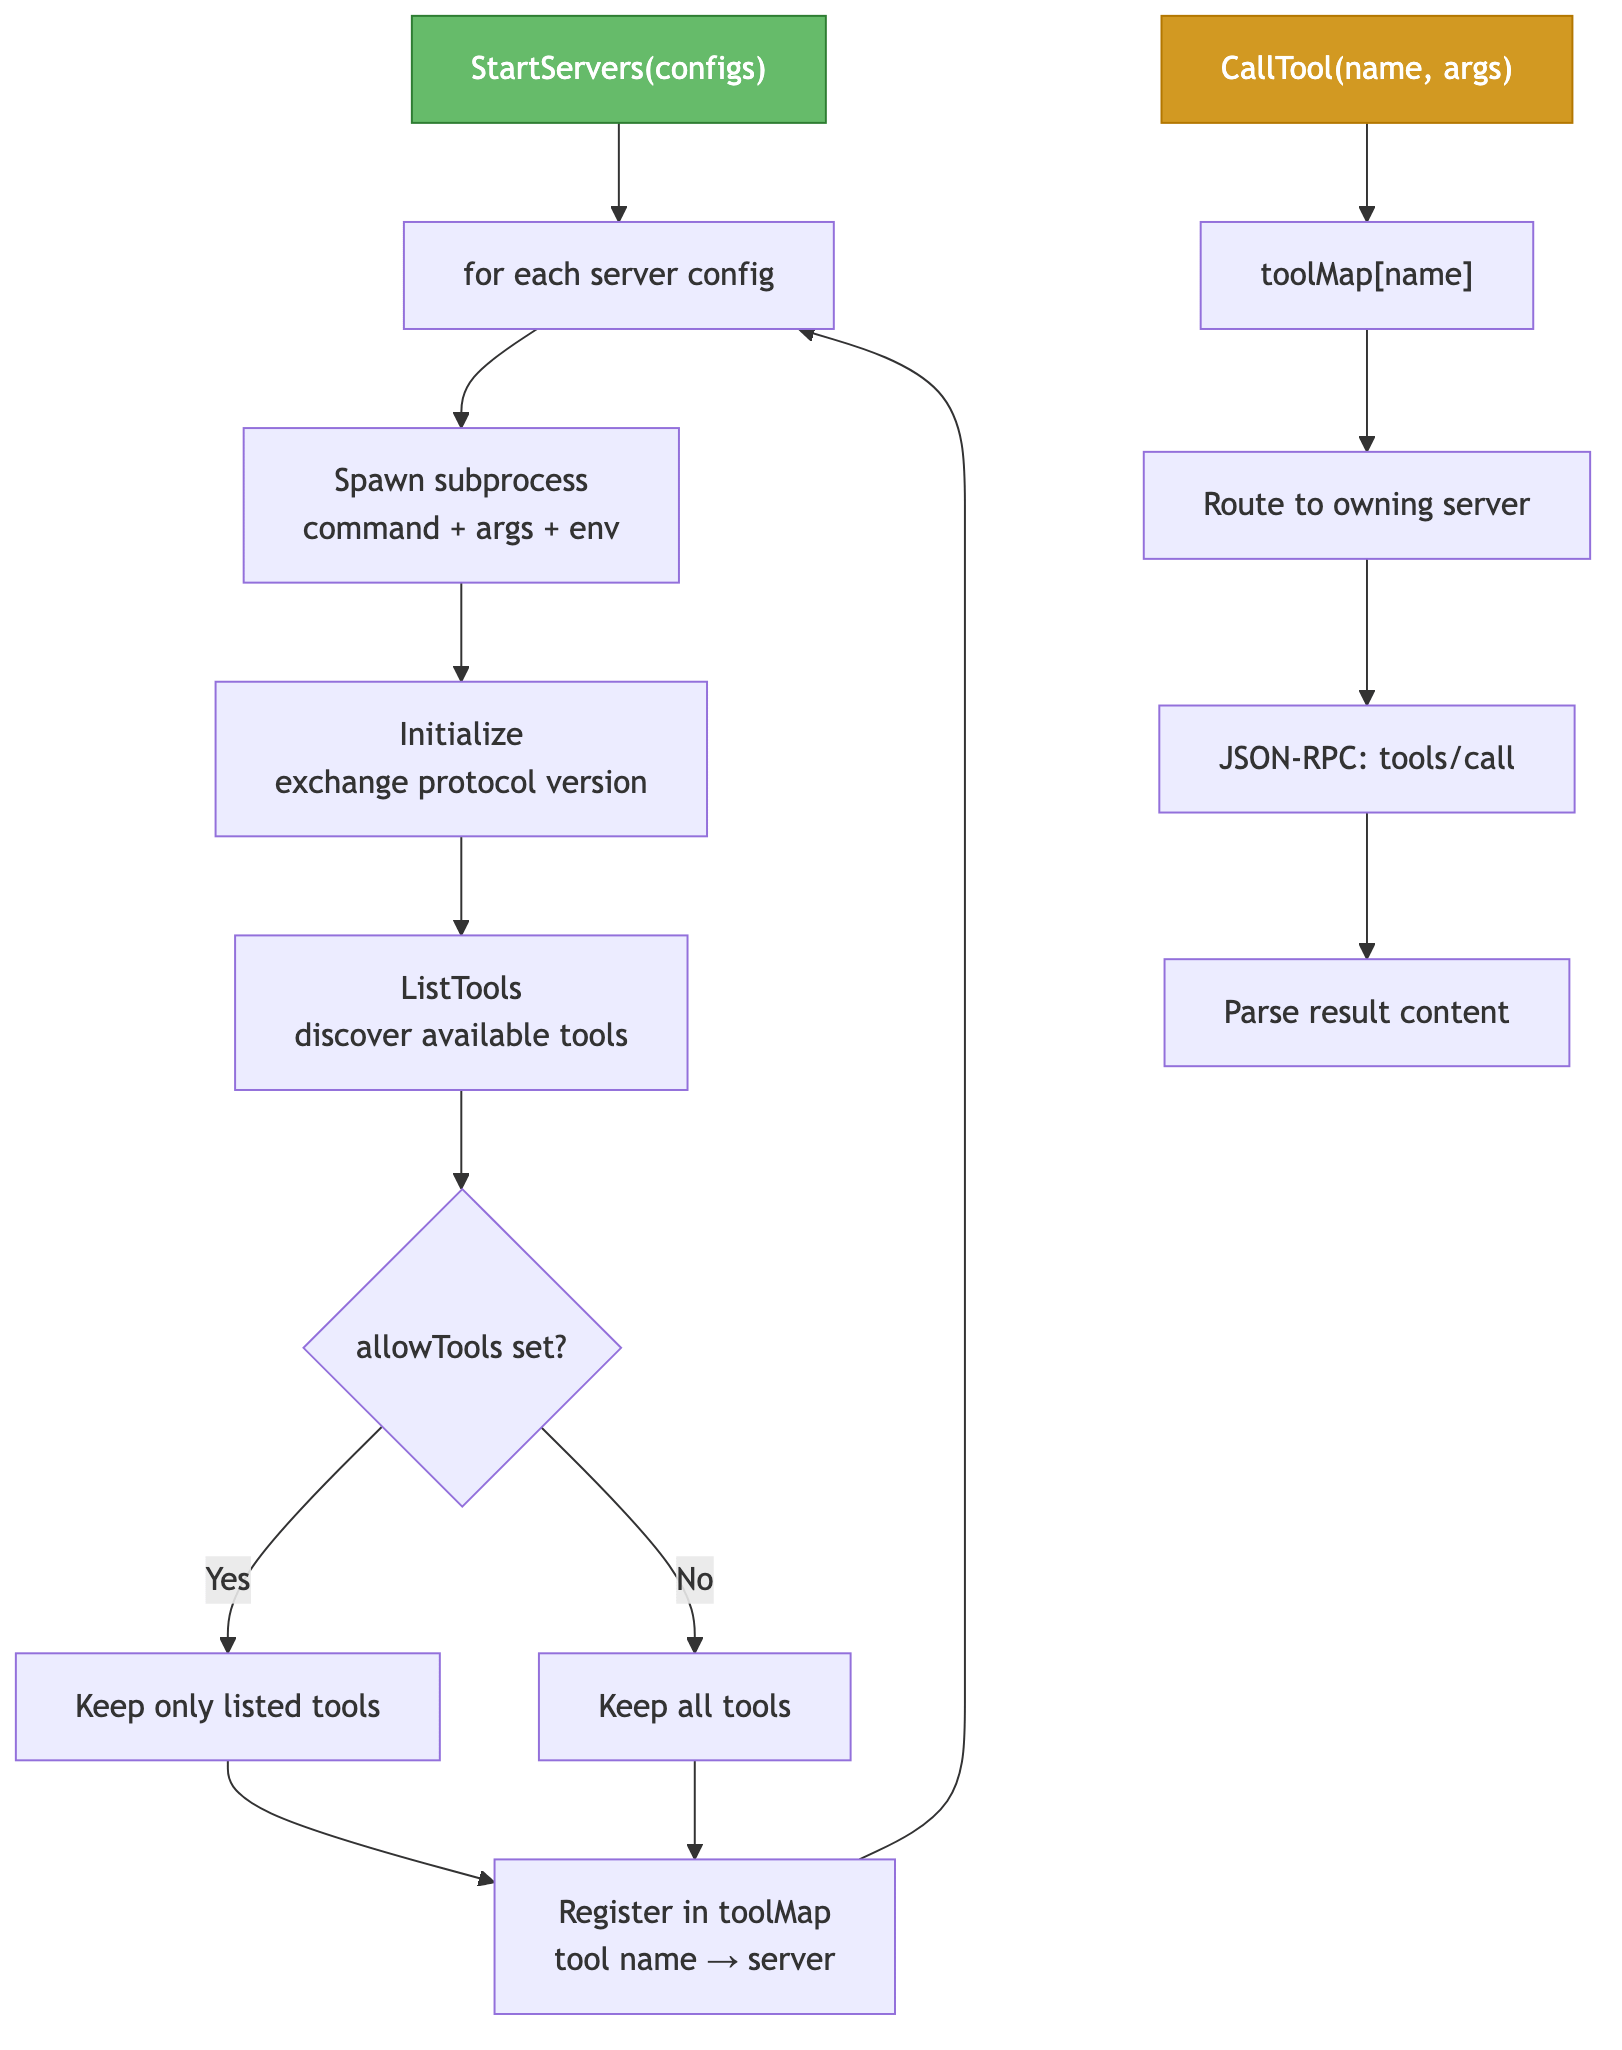
The toolMap is a flat map[string]*mcpServer. Since tool names must be globally unique across every registered MCP server, a single map lookup routes any tool call to the correct subprocess in O(1). The trade-off: no namespacing. If two servers happen to ship a tool with the same name (say both have a search), whichever loaded second overwrites the entry -- so when you combine servers, use each one’s allowTools field to whitelist a disjoint set. The alternative would be server-prefixed names like playwright.browser_click, but that bloats every tool schema the LLM sees and makes cross-server ecosystems awkward, which is why the flat-map-plus-whitelist approach won.
OpenAITools() converts all MCP tool schemas to OpenAI function definitions. It does a JSON round-trip to preserve the full schema including fields that mcp-go‘s typed struct might drop.
Handles models like Qwen that embed tool calls as <function=...> text markup instead of structured tool_calls. This is the adapter that makes text-style models work in the same loop as native ones.

The inferType() function is critical -- without it, maxResults: "5" (string) causes MCP schema validation errors. It tries ParseInt, ParseFloat, and boolean literals before falling back to string.
The gate between “the LLM emitted a tool call” and “the MCP subprocess runs it”. Each MCP server declares an inputSchema (JSON Schema draft 7) for every tool; ValidateToolArgs walks the JSON arguments the LLM produced and confirms they match — required fields present, types correct, no unknown keys when the schema says additionalProperties: false, enum values within the declared set.
Why a separate file rather than letting the MCP server reject malformed calls?
Faster failure path. Schema errors come back inside the loop as a tool result starting with
error:, whichisToolFailure(policy.go) recognises. The LLM gets feedback in the same round it made the bad call, instead of waiting for a round-trip to the subprocess.Lower attack surface. The validator runs in-process before any data hits the subprocess, so even a misbehaving MCP server doesn’t see arguments that didn’t match its own declared schema.
Better error messages. “missing required field
port“ is more useful to the LLM than whatever string the subprocess decides to return.
The implementation is deliberately conservative: it handles the subset of JSON Schema the MCP ecosystem actually uses in practice (object/array/string/number/boolean/integer with required, enum, and the additionalProperties switch) rather than the full draft 7 spec. When MCP eventually pins a tighter schema profile, this is the file that grows.
Intercepts URL fetches to check if the domain provides an llms.txt file -- a curated AI-optimized site summary. Results are cached per domain.
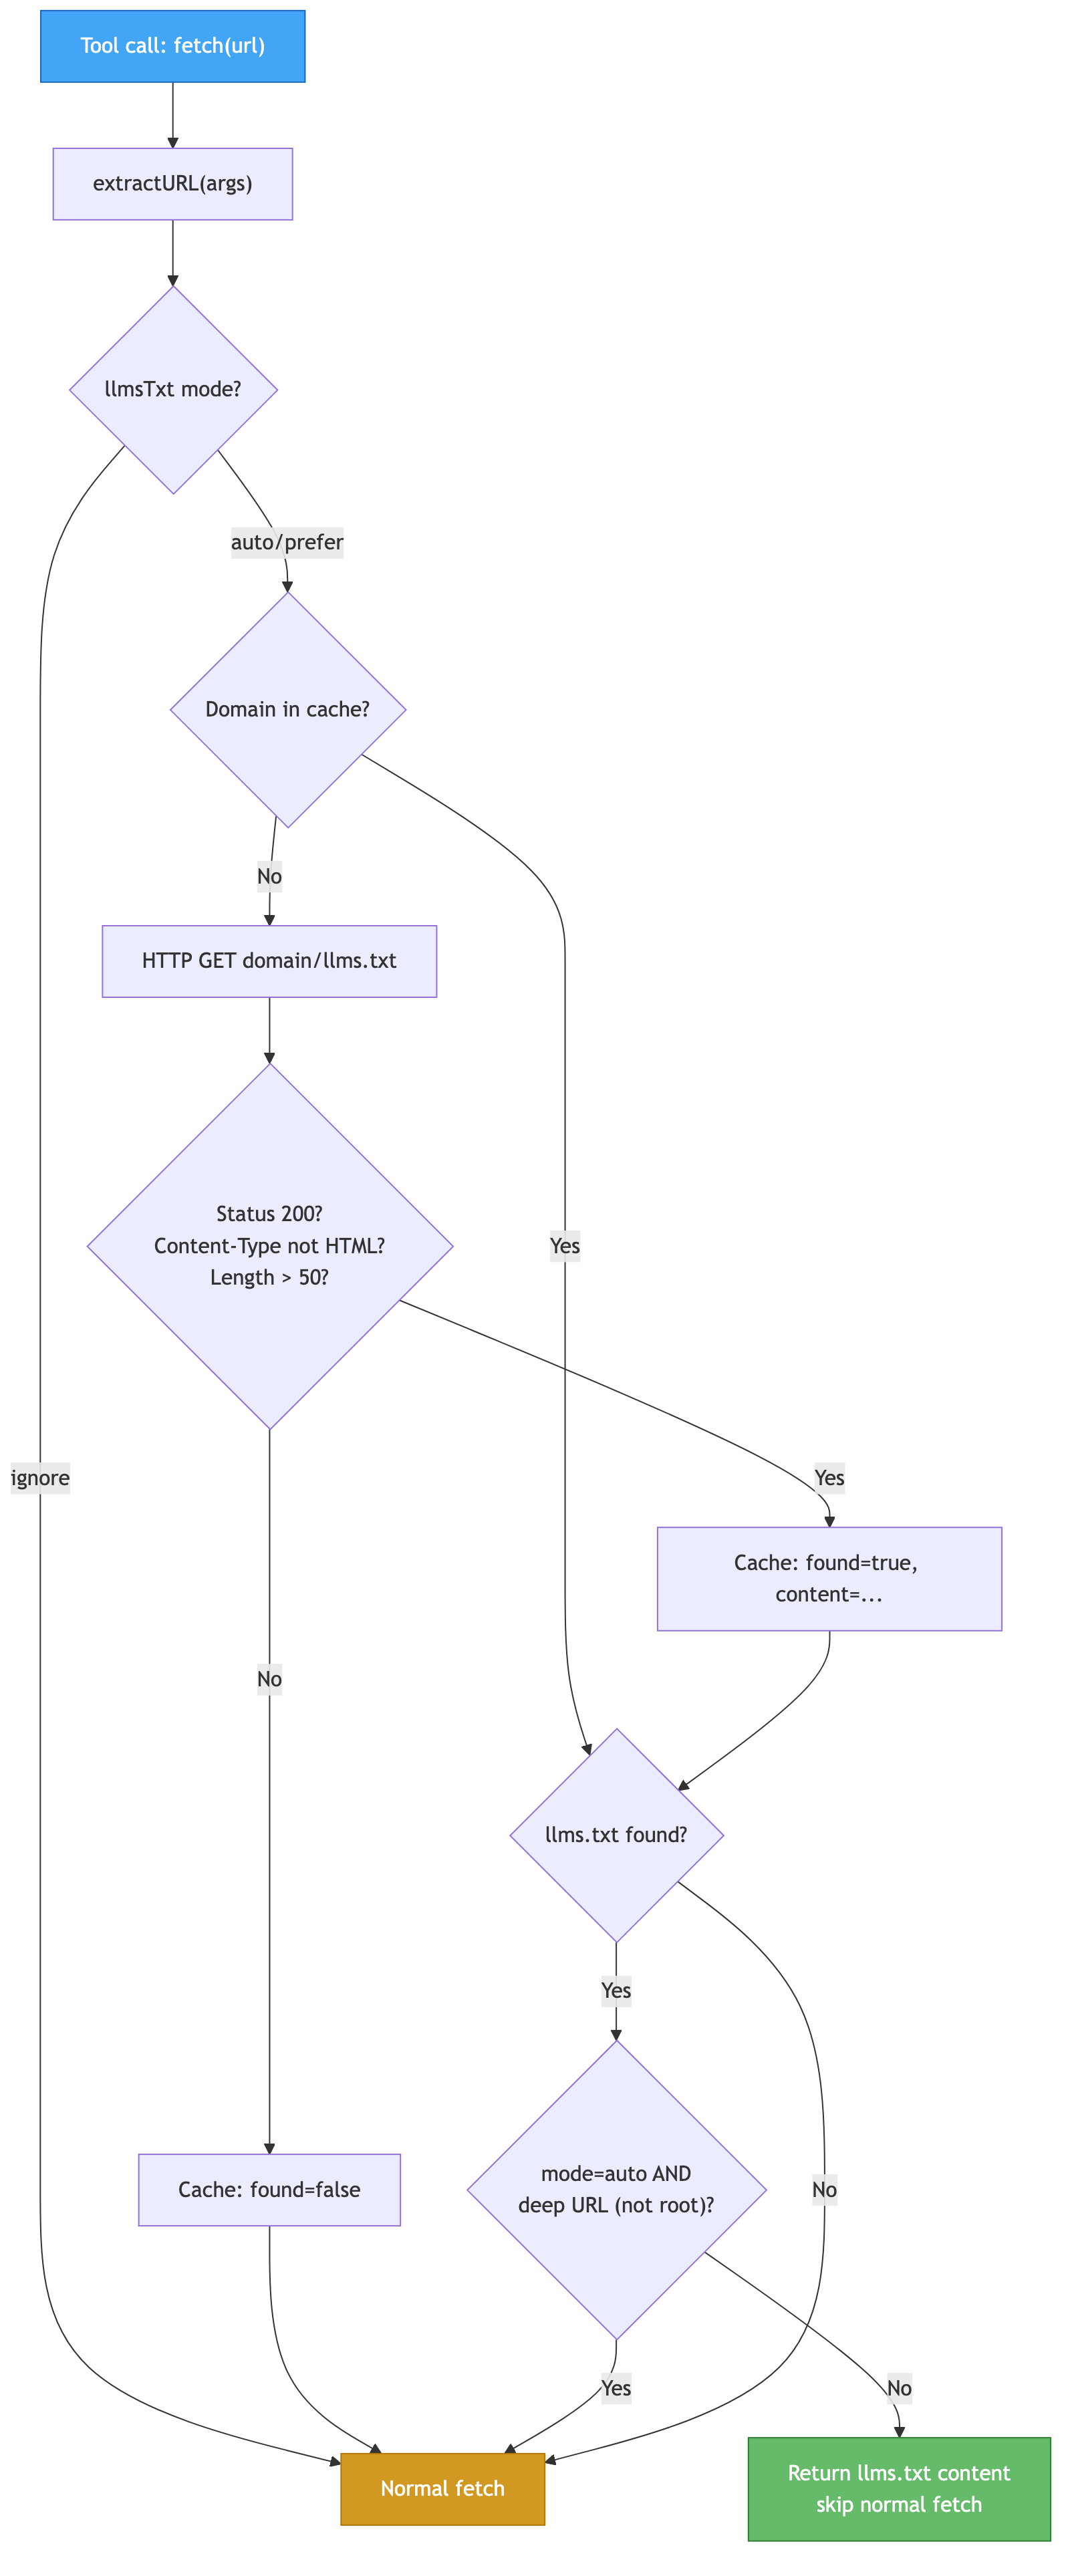
The cache is domain-level with a mutex for concurrent access. The HTTP client has a 10-second timeout and follows up to 3 redirects.
A pub/sub broadcaster that decouples the agent loop from its consumers (CLI logger, web dashboard, OTEL). The agent emits events; consumers subscribe independently.
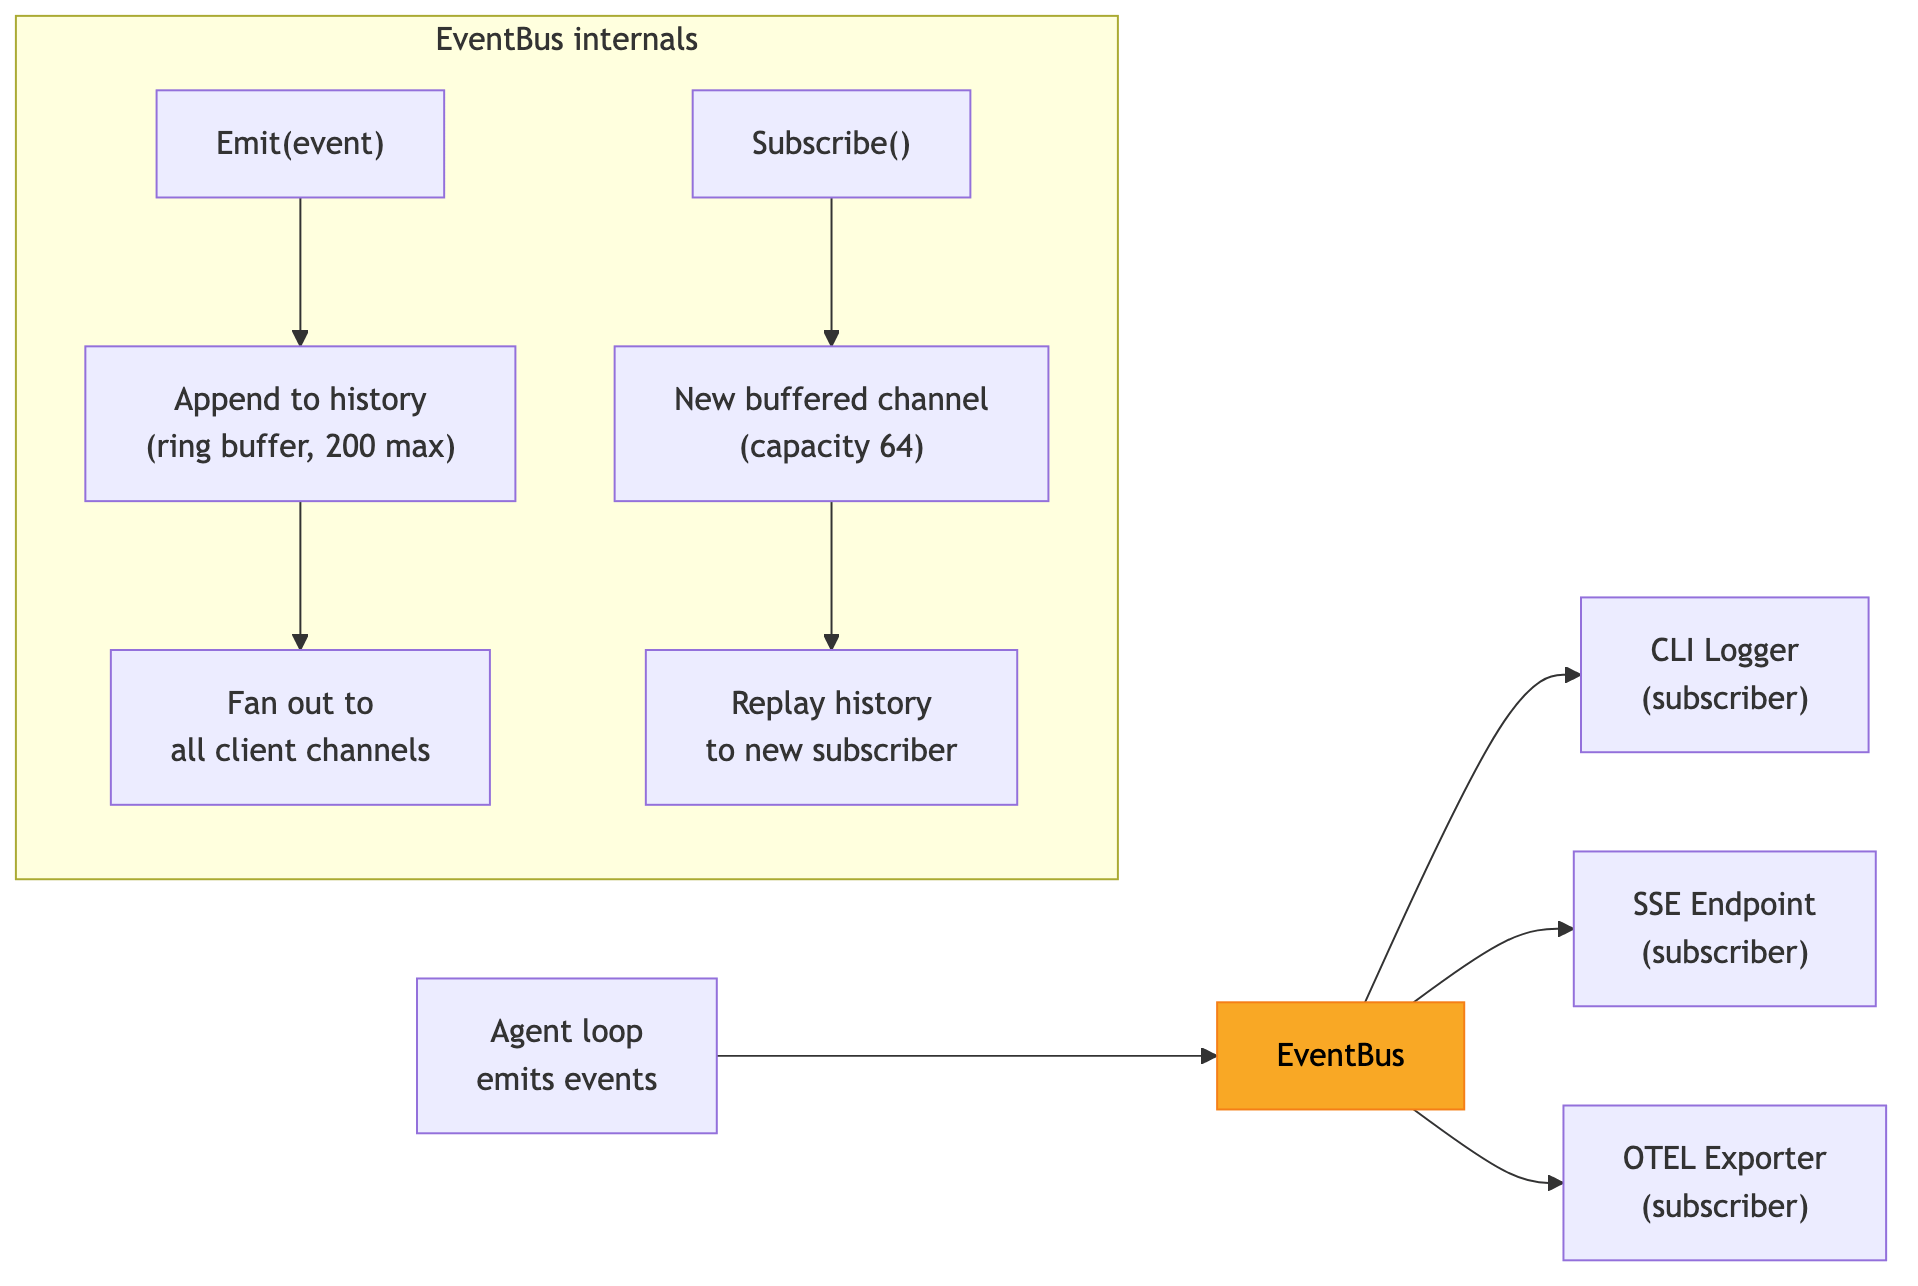
Events are structs with a Type (querystart, llmrequest, llmresponse, toolcall, tool_result, etc.) and a Data payload containing metrics and content. New subscribers receive the full history replay, so opening a new browser tab shows the complete session.
The history ring is bounded at 200 events (events.go). This is the right size for a single long query or a handful of shorter ones; anything older rolls off silently. If you need a persistent audit trail -- compliance, replay-for-debugging, long-term analytics -- don’t build on top of SSE replay. Attach an OTEL exporter instead and let the trace backend (Jaeger, Tempo, Honeycomb, ...) handle retention. The SSE ring is for live and near-live operator visibility, not archival.
The web server is the network face of the agent. It serves three audiences from one port, split across five files for clarity:
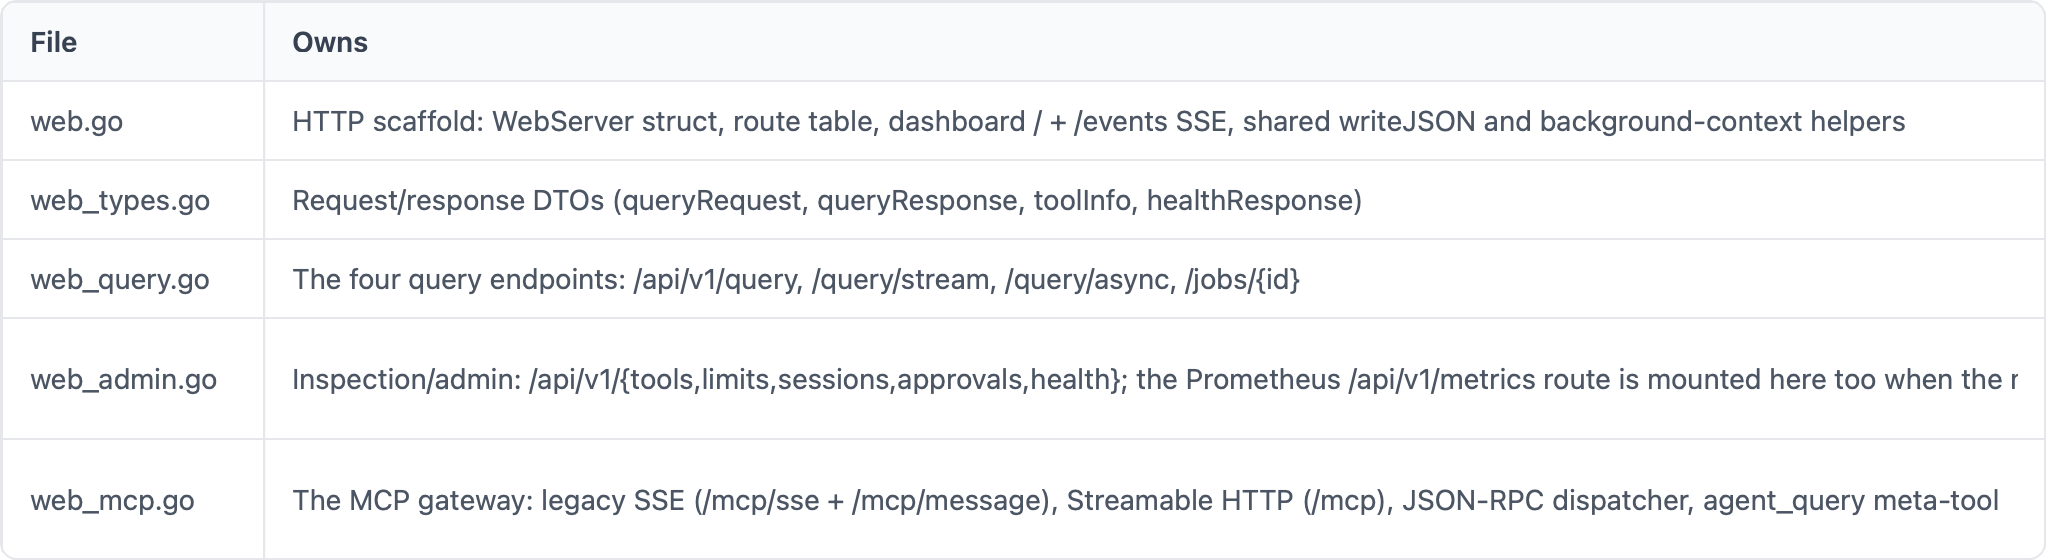
The route table all lives in web.go so a reader can see the whole HTTP surface in one place; each handler then lives next to its kin in the appropriate sibling file.
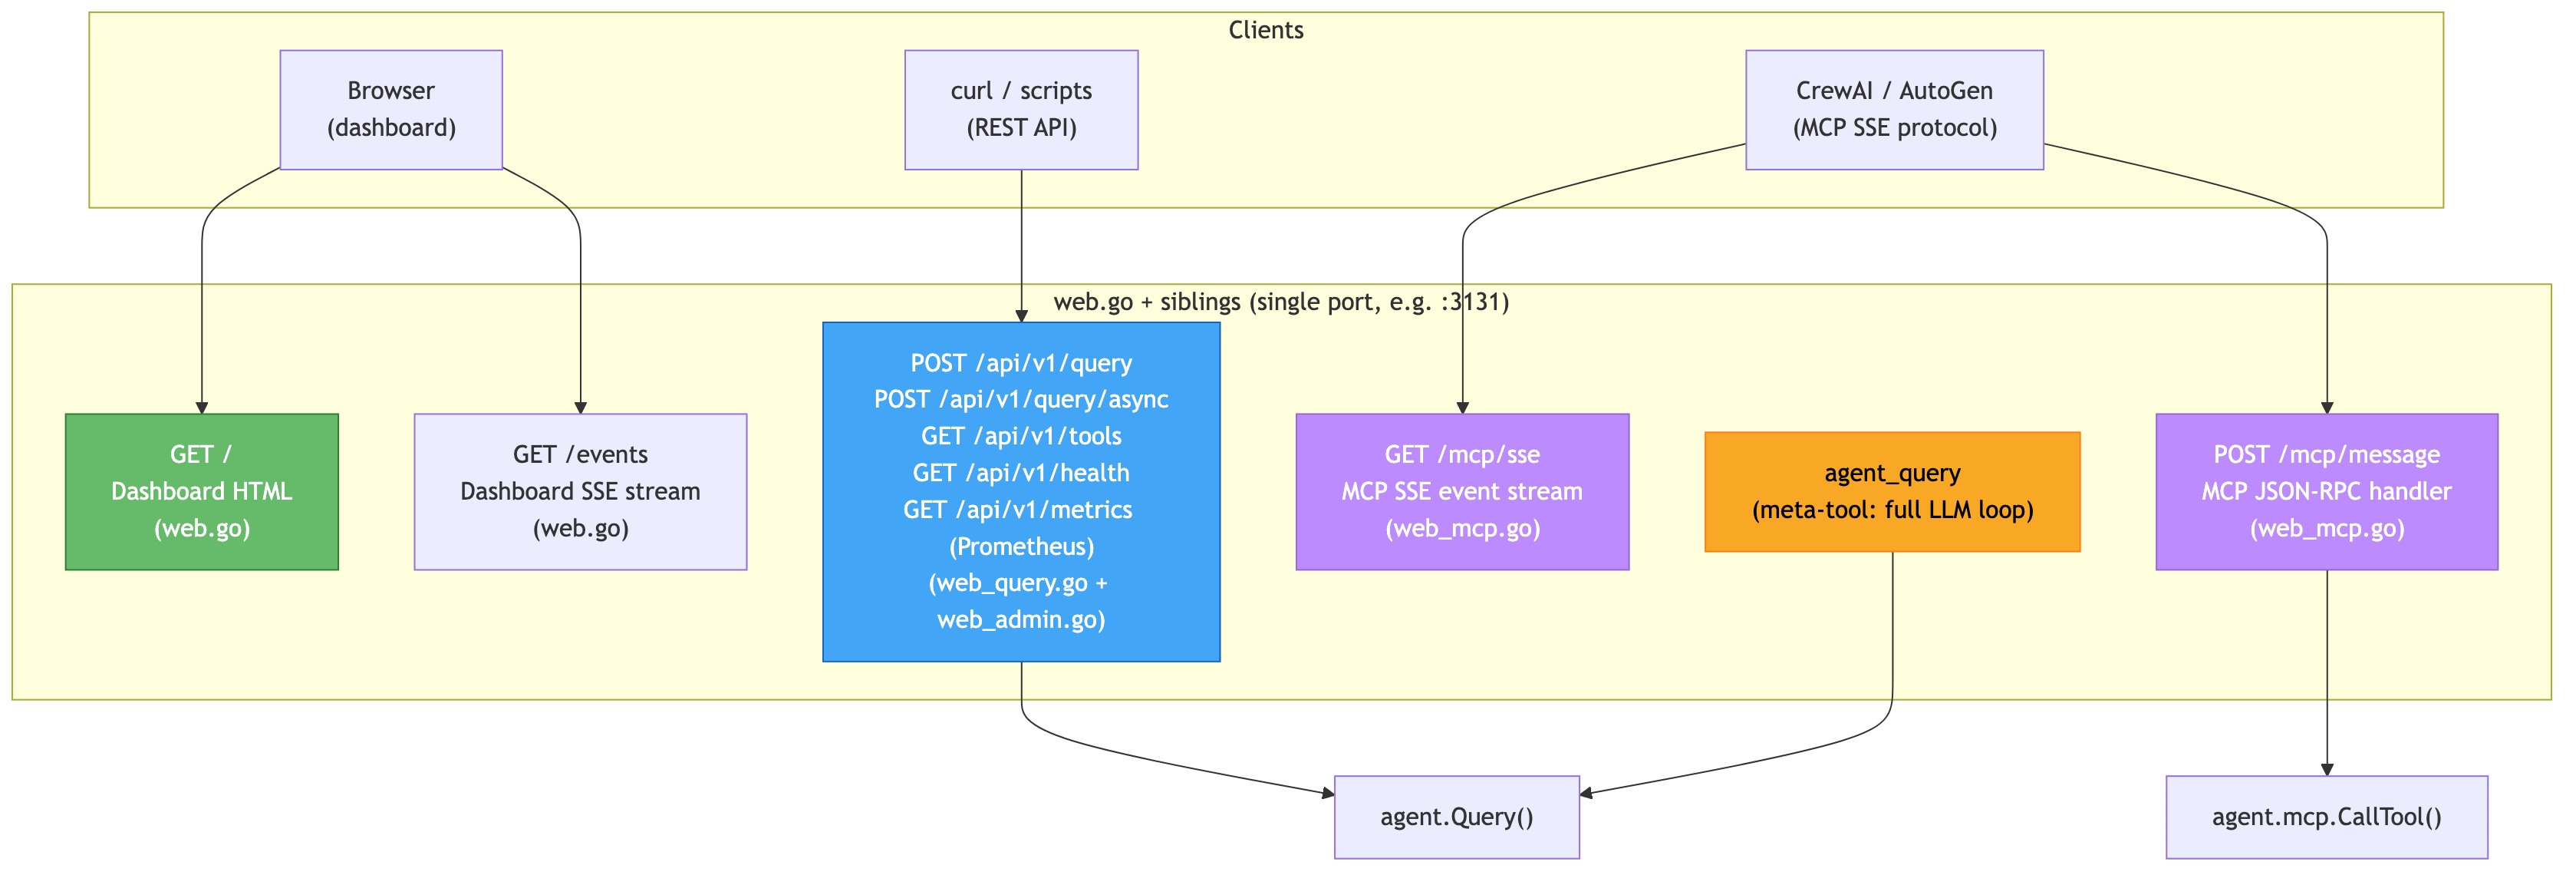
Dashboard (/, /events): HTML + SSE for the browser visualization.
REST API (/api/v1/*): Sync, streaming, and async queries plus a job queue. External apps send natural language and get answers.
MCP SSE Gateway (/mcp/sse, /mcp/message): The standard MCP protocol over SSE. External MCP clients (CrewAI, AutoGen, LangGraph) connect here and see two levels of access:
agent_query-- a meta-tool that takes natural language, runs the full LLM agent loop (reasoning + tool calls), and returns a complete answer. This is agent-to-agent delegation over MCP.All raw tools --
check_port,fetch,browser_navigate, etc. called directly, no LLM involved.
This means an external agent can either ask our agent to think (”is port 13305 in use?”) or use our tools as its own (”call check_port with port 13305”). The agent_query meta-tool makes the agent callable as a tool by other agents -- the foundation for multi-agent orchestration.
Real-world example -- Terminal 1 holds the SSE stream, Terminal 2 sends an agent_query:
bash
# Terminal 2:
curl -X POST "http://localhost:3131/mcp/message?sessionId=mcp-1" \
  -H "Content-Type: application/json" \
  -d '{"jsonrpc":"2.0","id":2,"method":"tools/call","params":{"name":"agent_query","arguments":{"query":"is port 13305 in use?"}}}'
# → returns 202 Accepted immediately
The full answer arrives on the SSE stream in Terminal 1:
event: endpoint
data: http://localhost:3131/mcp/message?sessionId=mcp-1
event: message
data: {"id":2,"jsonrpc":"2.0","result":{"content":[{"text":"Port 8000 is currently
  in use by a process named \"lemonade-router\" with PID 467250. The process is
  listening on both IPv4 (127.0.0.1:8000) and IPv6 ([::1]:8000) addresses.\n\n
  If you need to free up this port, you could terminate the process using:\n
  \nkill 467250\n
typetext : ping 2026-04-13T09:52:44+02:00
The agent internally ran the full loop -- called the LLM, which decided to use check_port, executed it, and synthesized a natural language answer. The external client just sent a question and got a complete response.
The synchronous REST endpoint blocks until the agent finishes -- fine for sub-second port checks, painful for a multi-round web-research query. queue.go is what POST /api/v1/query/async uses to fire-and-poll: the request returns a job_idimmediately, the queue runs jobs serially in a single worker goroutine (the agent isn’t safe to run concurrently against the same conversation), and GET /api/v1/jobs/{id} returns status/result. The queue is bounded -- new submissions past capacity get a 429 rather than unbounded memory growth -- and respects the same per-query limits as the sync path.

IPLimiter is a token-bucket cap per source IP, applied selectively. Mutating endpoints — POST /api/v1/query, /query/stream, /query/async, /mcp/message, /mcp — pass through limiter.Wrap(). Read-only endpoints (/api/v1/{health,tools,limits,sessions,metrics}, /events, /mcp/sse) bypass it: a Prometheus scraper polling /metrics every 15 seconds shouldn’t compete with query traffic. The HITL approval endpoints also bypass — a blocked query is waiting on that resolution, and rate-limiting the unblock would deadlock.
The default cap is 60 requests/minute per IP, configurable via the -rate-limit flag (0 disables the limiter entirely). Buckets refill continuously rather than at fixed intervals, so a client doesn’t get punished for hitting the cap right at the minute boundary.
Source IPs come from RemoteAddr by default; IPLimiter.Wrap checks X-Forwarded-For first, so an agent behind a reverse proxy still caps per actual client rather than per proxy.
The ten termination paths above are enforced against server-configured defaults, but a single server can’t pick defaults that fit every caller. A CI smoke test wants timeout: 10; a deep-research task wants timeout: 600. Rather than force a global compromise, the agent lets each caller request per-query limits -- and clamps anything looser than the server’s maximum. The server stays authoritative; callers can only tighten.
The REST API accepts a limits body field:
bash
curl -X POST http://localhost:3131/api/v1/query \
  -H "Content-Type: application/json" \
  -d '{
    "query": "is port 13305 in use?",
    "limits": {"timeout": 30, "max_rounds": 3, "early_stop": true}
  }'
External MCP clients attach overrides to the standard _meta field on tools/call, using the vendor-prefixed keys the MCP specreserves for exactly this purpose:
json
{
  "jsonrpc": "2.0", "id": 1, "method": "tools/call",
  "params": {
    "name": "agent_query",
    "arguments": {"query": "quick port check"},
    "_meta": {
      "io.llm-agent/timeout": 30,
      "io.llm-agent/max_rounds": 3
    }
  }
}
The clamping logic is a one-liner:
go
func clampLimit(override, serverDefault int) int {
    if override <= 0          { return serverDefault } // Not set → use default
    if serverDefault == 0     { return override      } // Server has no cap → accept
    if override < serverDefault { return override    } // Client asked stricter → honor
    return serverDefault                                // Client asked looser → refuse
}
That’s the entire policy: client may tighten, never loosen. A malicious or buggy client asking max_rounds: 999999 just gets 10 -- the server’s cap. Discovery is via GET /api/v1/limits, which returns the current defaults and the available override channels. The dashboard displays them read-only in the sidebar so operators can see what’s actually being enforced.
The ten termination paths only work as a feature if the reason for termination escapes the agent and reaches the caller. Every query -- success, hard error, or early-stop -- returns a QueryResult carrying:
go
type QueryResult struct {
    Answer            string       `json:"answer"`
    Error             string       `json:"error,omitempty"`
    TerminationReason string       `json:"termination_reason"` // stable enum
    Details           string       `json:"details,omitempty"`
    RoundsUsed        int          `json:"rounds_used"`
    TokensUsed        int          `json:"tokens_used"`
    ToolCallsMade     int          `json:"tool_calls_made"`
    ElapsedMs         int64        `json:"elapsed_ms"`
    EarlyStopped      bool         `json:"early_stopped,omitempty"`
    Limits            *AgentLimits `json:"limits,omitempty"`
}
REST responses serialize it directly. MCP tools/call responses attach the same fields as io.llm-agent/* keys under _meta per the MCP spec convention. HTTP status codes also carry semantic information -- timeout maps to 504, non-retryable API errors to 502, user-cancel to 499 -- so a middleware can react without reading the body.
The key subtlety: timeout and user-cancel both enter the loop as context errors, but they carry different reasons. We use errors.Is(err, context.DeadlineExceeded) vs errors.Is(err, context.Canceled) to split them -- if we just looked at ctx.Err(), we’d conflate a CI timeout with a Ctrl+C. External clients need to react differently to those (retry with longer budget vs. stop), so distinguishing is worth the three lines of code.
Provides the verbose output using fatih/color. Each method is a no-op when verbose mode is off, so there’s zero cost when running without -v.

Everything that flows through the logger passes through Redact() first — see redact.go below for what that scrubs and why it’s its own file.
A single-purpose file that gets called from many places: the logger before it writes a line, the event bus before it emits a payload, OTEL span attribute encoding, the HITL approval-request event before it shows tool arguments to a human. The function — Redact(string) string — scrubs recognizable credential shapes (API keys with sk-/AIza/gsk_ prefixes, bearer tokens, JWT-shaped strings, a handful of provider-specific patterns) before the string leaves the process.
The guiding principle: treat logs as semi-public. They land in terminals that get screenshotted, in bug reports pasted into Slack, in OTEL backends multiple teams can read. A regex pass is cheap insurance against a credential leaking through a careless paste. Matches are replaced with [REDACTED] rather than removed, so debugging still has a positional anchor.
Performance: a fast-path “suspect marker” check (does the string contain sk-, key, token, bearer, …?) keeps the cost at roughly zero for the 99% of payloads that don’t carry anything sensitive — only strings that look like they might contain a secret get run through the full regex set.
Sets up OTLP HTTP export when --otel-endpoint is provided. Creates a TracerProvider with the service name llm-agent. All other files use a package-level tracer and the startSpan() helper. Make sure you have the OTel endpoint available - otherwise you see frequent error messages for each push tasdk.

When no endpoint is provided, the tracer is a no-op -- startSpan() returns dummy spans that cost nothing.
Sibling to otel.go, but for metrics instead of traces. Six instruments cover the three hot paths in the agent loop:
agent_queries_total(counter, labels:termination_reason) +agent_query_duration_seconds(histogram)llm_calls_total(counter, labels:provider,status) +llm_call_duration_seconds(histogram, labels:provider)tool_calls_total(counter, labels:tool,status) +tool_call_duration_seconds(histogram, labels:tool)
Instrumentation uses the named-return + defer pattern at three points -- Session.QueryDetailed (session.go), LLMClient.ChatCompletion (llm.go), and MCPManager.CallTool (mcp.go) -- so the recorders fire on every exit path (success, error, early stop) without each call site having to remember to record.
The interesting design choice is two transports for the same numbers:

OTLP pushes outward (agent initiates the connection to a collector); Prometheus pulls inward (a scraper hits /api/v1/metrics). Either, both, or neither can be active. When both flags are unset the recorders are no-ops — one nil check per call, effectively free. Part 7 covers when to pick which transport and the practical trade-offs.
A self-contained MCP server with zero external dependencies. Supports two transports: stdio (local, for agent.json) and SSE (network, for remote MCP clients). Exposes two read-only tools for port inspection.
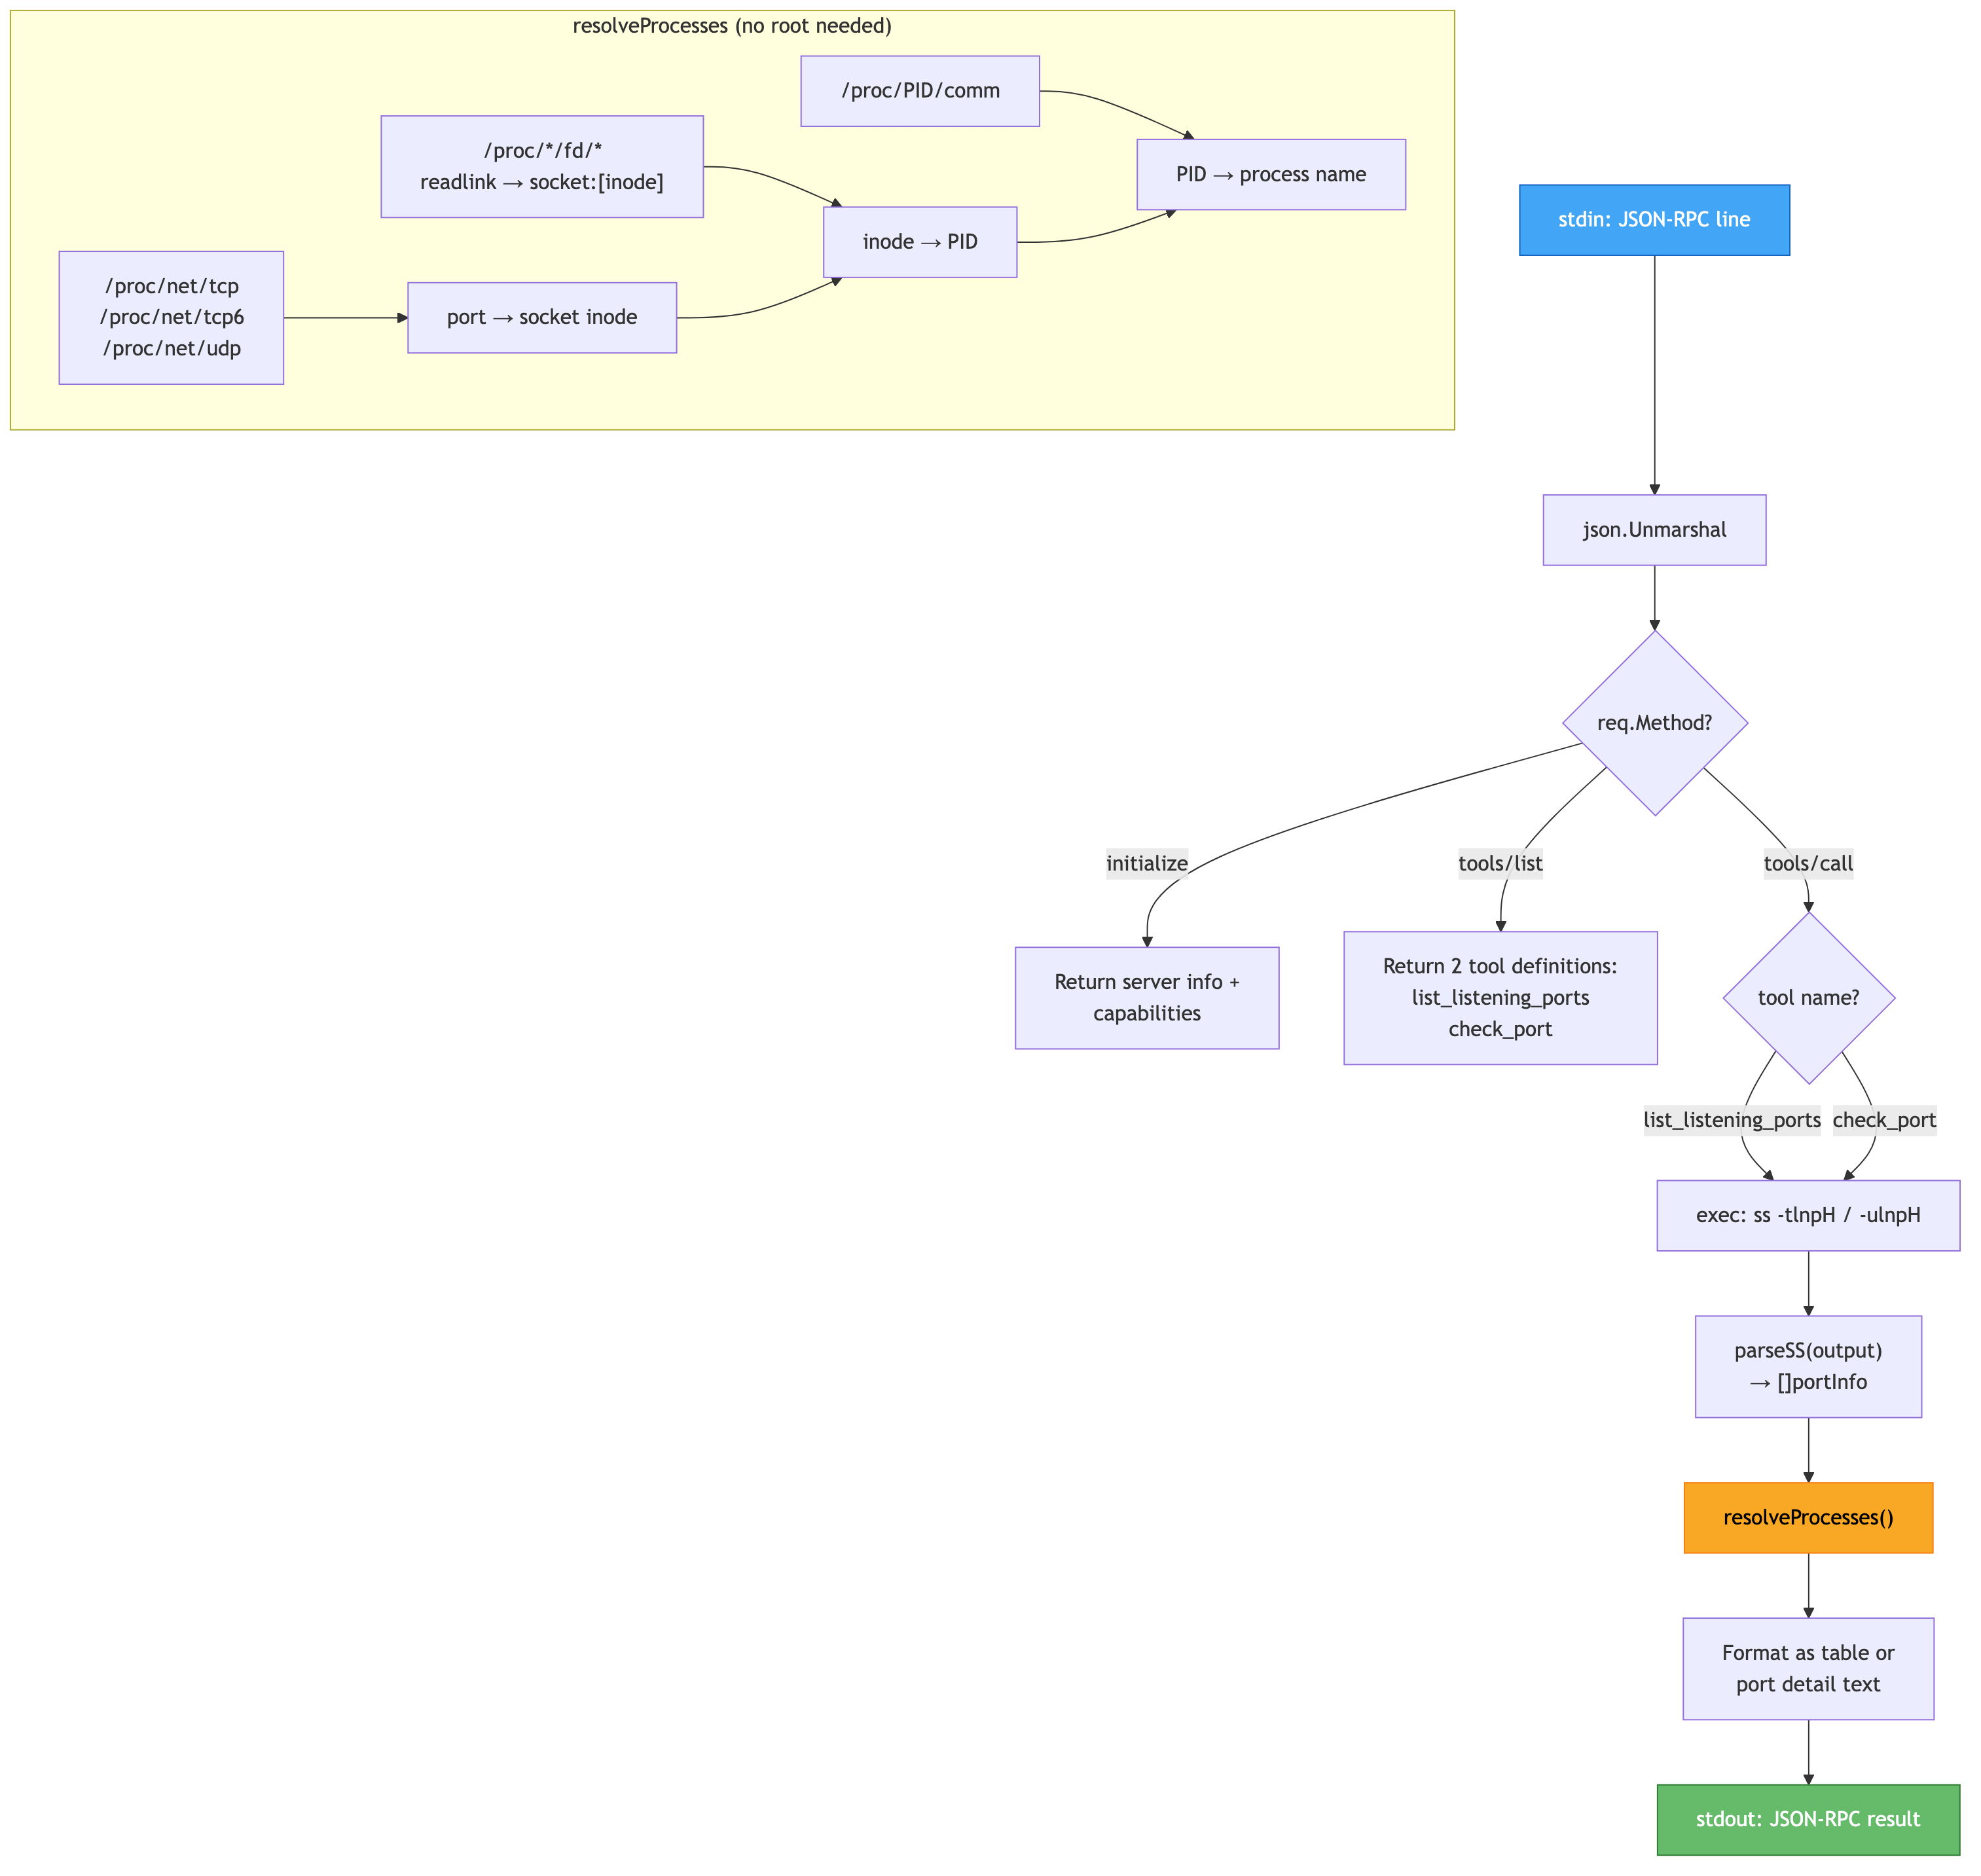
The process resolution is the most interesting part. Without root, ss can’t show which process owns a port (it needs CAP_NET_ADMIN). The server works around this by:
Reading
/proc/net/tcpto find the socket inode for each portScanning
/proc/*/fd/to find which PID has a file descriptor pointing tosocket:[inode]Reading
/proc/PID/commfor the process name
This gives process info for all ports owned by the current user. For other users’ ports, it adds a clear note: “Process info not available (port is owned by another user). Run with sudo for full details.”
The tool descriptions explicitly say “The result is a complete answer -- just report it to the user, no further lookups are needed” -- this prevents the LLM from going on a web search after getting a perfectly good local answer.
Previous: Part 3: The Agent Loop Next: Part 5: Operations & Extending -- the narrow server principle, llms.txt, server management, and operational troubleshooting.
After that, the series continues with Part 6: Running It Yourself (every supported LLM backend, recipes and trade-offs) and Part 7: Observability (the four visibility layers and investigation walkthroughs).
Well, if you want to dig deeper, need more insights as part of a workshop or want to elevate the Apache code covered in this series into a production ready grade, then lets get in touch via email: ai-consulting@smarttechlabs.de.
Copyright (C) 2026 By Smarttechlabs.de - All Rights Reserved
This article is part of a seven-part SmartTechLabs blog series on building a practical LLM agent system in Go. The goal is not to hide the complexity behind another black-box framework, but to make the moving parts understandable: agent loops, tool execution, MCP servers, local and remote LLM endpoints, OpenAI-compatible APIs, observability, and operational concerns. The example system supports local runtimes such as LM Studio, Ollama, Lemonade, vLLM, and llama.cpp, as well as cloud providers like Gemini and Anthropic. It is designed to run across AMD, NVIDIA, and Apple Silicon environments, from developer workstations to potentially lightweight edge deployments.
At SmartTechLabs, we help companies understand what LLMs and agent systems can realistically do, how they can be integrated into existing software and infrastructure, and where the operational, architectural, and governance boundaries are. Our consulting work covers GenAI workshops, technical enablement, architecture reviews, prototyping, integration with enterprise systems, and hands-on implementation support. This blog series is based on material from our GenAI workshops and is intended for teams that want to move beyond demos and start building reliable, observable, and maintainable AI-enabled systems.
No posts
Comments
Nothing yet. Say the first thing.
Sign in to join the conversation.