
The shale industry has spent the better part of two years drawing down inventory to keep production moving while keeping capital spending under control.
A Reuters report published on May 29, 2026 included a chart that shows how far that process has gone.
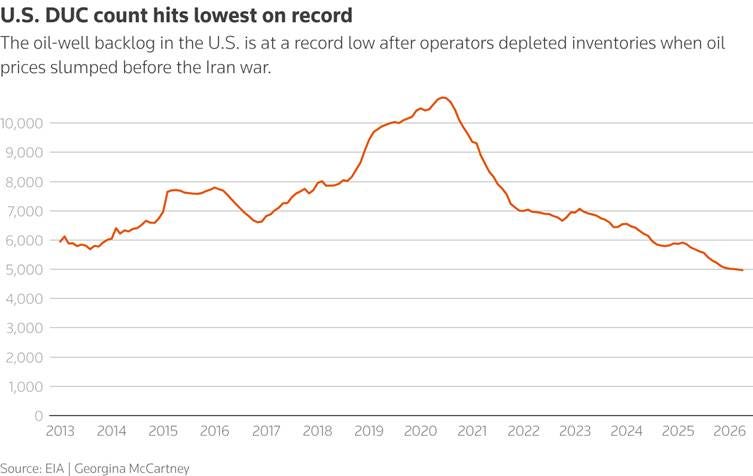
The chart tracks U.S. drilled but uncompleted (DUC) wells back to 2013. DUC inventories climbed steadily through the shale growth years, peaked above 10,000 wells during the 2020 shutdown when drilling continued while completions slowed, and have been falling ever since. By April 2026, the inventory had declined to 4,972 wells according to the EIA, the lowest level recorded since the agency began tracking the series and the 14th consecutive monthly decline.
14 consecutive monthly declines would be notable on their own. The implications become more interesting when considered against what producers are simultaneously being asked to deliver.
The first is that the EIA increased its 2026 U.S. crude production forecast to 13.65 million barrels per day from 13.51 million a month earlier.
The second is that activity is beginning to recover. The national frac crew count reached 189 in late May, up 21% from the start of the year after five consecutive weeks of gains. U.S. onshore oil rigs rose to 425 in the week of May 22, the highest level since July 2025.
A third consideration may further tighten the picture. Reuters reported that U.S. producers have increased exports to Asia and Europe following disruptions to Middle Eastern supply, prompting some operators to signal that remaining DUC inventories could be drawn down even faster in the months ahead.
A record-low DUC inventory means the industry has largely exhausted the stockpile of pre-drilled wells that allowed production to grow without requiring a proportional increase in new drilling activity. Operators have been drawing from that inventory to support output while keeping capital spending in check.
At the same time, the EIA is forecasting higher production.
That becomes a more demanding proposition as DUC inventories approach historical lows.
As that buffer shrinks, maintaining and growing production will lean more towards fresh drilling and fresh completions rather than wells drilled in prior years.
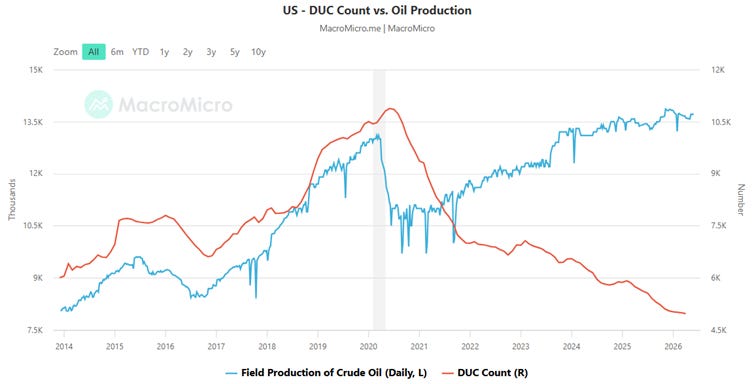
In other words, the industry is being asked to deliver more production at the same moment the easiest source of supply flexibility is disappearing.
Activity data suggests producers are beginning to adjust, although the pace will ultimately depend on commodity prices, producer economics and capital allocation decisions.
Diamondback Energy is currently running five completion crews while planning to add two to three rigs through the remainder of the year. Patterson-UTI expects to add five active rigs during the second half of 2026, ending the year with approximately 100 rigs. ConocoPhillips is also adding a rig.
That activity is occurring with November WTI futures trading near $78 per barrel, a price that justifies bringing additional drilling capacity back to work.
To understand why DUC inventories have fallen this far, it helps to look at the economics operators faced in recent years.
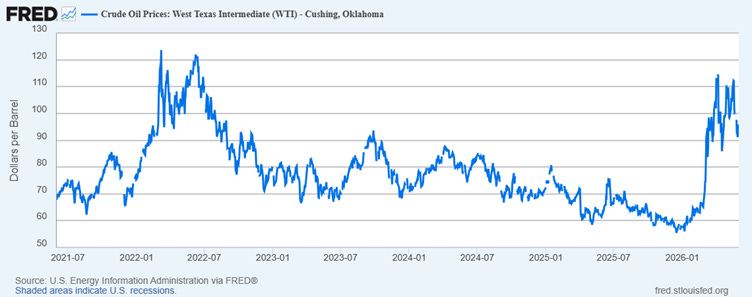
Through much of 2025, and during several periods in 2024, oil prices traded in the $60 to $70 range while management teams continued to emphasize capital discipline over production growth. Faced with that environment, the industry did what it had historically done. It completed wells that had already been drilled rather than committing incremental capital to new drilling programmes.
The economics favoured that choice.
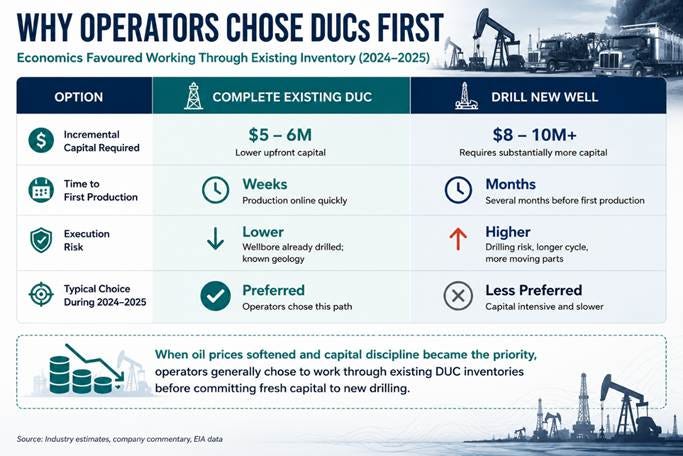
For a while, the approach worked as intended. Production remained resilient while operators worked through inventory accumulated during earlier years. The industry was consuming flexibility that had already been paid for.
That flexibility is running out. Enverus estimates that only 3,866 operationally relevant DUCs remained as of April after excluding wells drilled more than two years ago that are unlikely ever to be completed. The Permian Basin, which accounts for nearly half of U.S. crude production, saw its DUC inventory decline from 609 wells in February to 540 by May.
Shale production is not a static asset. Many wells lose 60 to 70% of their initial production within the first year. Maintaining output requires a constant stream of replacement barrels, which in turn requires a constant stream of new completions.
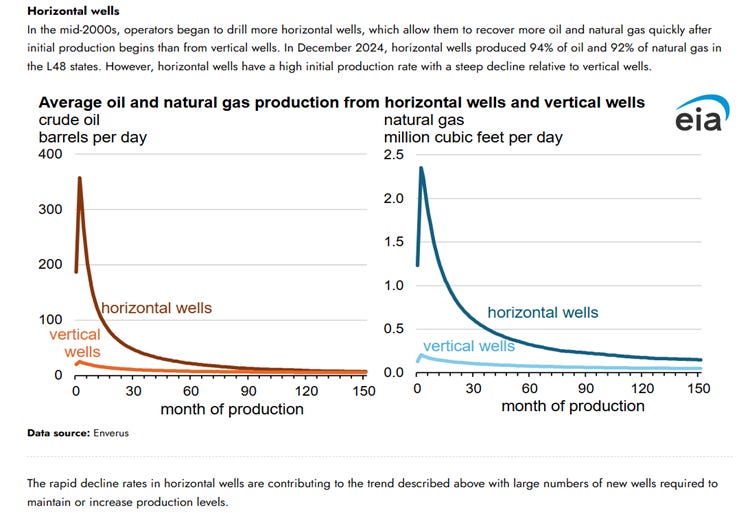
As Brandon Myers of Novi Labs noted in the Reuters report, DUC inventories are not something the industry can draw down quarter after quarter without consequence.
“This shock absorber is meant to buffer quarter-over-quarter changes, but it’s not something you can just draw down for six quarters in a row without consequences.” - Brandon Myers, Head of research at Novi Labs.
The repercussions are not difficult to see. The flexibility that once allowed operators to support production by drawing down inventory is largely gone. Future production will depend increasingly on current drilling and completion activity.
The thesis is simple. DUC inventories are at record lows. If production is to keep growing, more of the work must come from current drilling and current completions.
The question is whether the people closest to the activity agree.
The people best positioned to answer that question are the ones planning wells, running crews and tracking basin activity. If the well construction and completion market is tightening, it should show up in their commentary before it shows up in reported results.
There is another side to the equation. Activity and capacity are not the same thing. Rig counts and frac spread counts tell us what operators are doing. They tell us much less about how quickly the industry can add crews, equipment, drilling support services and completion capacity if demand continues to strengthen.
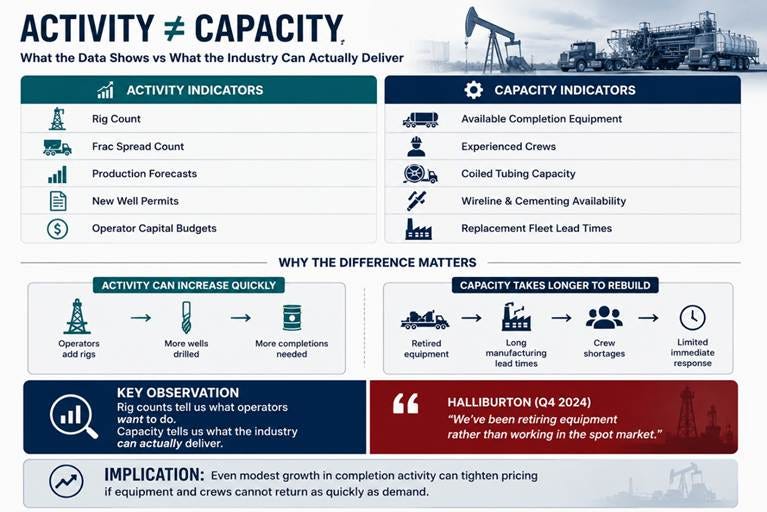
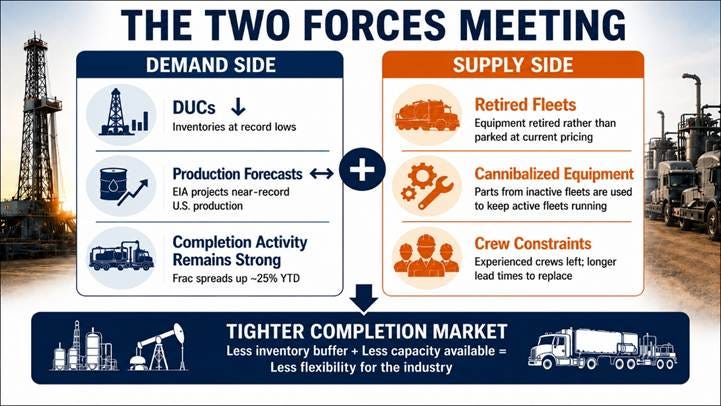
Looking across both demand and supply, the message is largely the same.
Operators describe a market that is becoming more reliant on current activity as DUC inventories decline. Researchers following the data reach similar conclusions. On the supply side, there is little indication that crews, equipment, and completion capacity can be added as quickly as they could in prior cycles.
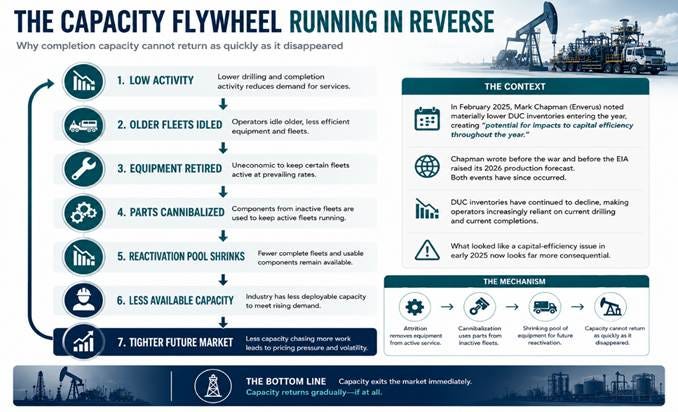
Mark Chapman of Enverus saw the issue early.
Back in February 2025, Chapman noted that operators were entering the year with materially lower DUC inventories than they had a year earlier, creating what he described as “potential for impacts to capital efficiency throughout the year.”
Chapman was writing before the war and before the EIA revised its 2026 production forecast higher. Both have since occurred. The inventory has continued to decline. What looked like a capital-efficiency issue in early 2025 now looks more consequential.
Both sides of the market were behaving exactly as you would expect in the same set of constraints.
Through much of 2024 and 2025, operators leaned on their DUC inventories to keep production steady while holding the line on capex. The inventory had already been paid for, which made it cheaper to complete existing wells than to commit fresh capital to new drilling programs.
Service companies faced a different set of economics. Activity stayed high enough to keep work flowing, but not high enough to justify running every marginal completion fleet at prevailing pricing. In effect, operators were drawing down one source of flexibility while service providers were trimming another.
The industry was, at the same time, eating through excess well inventory and excess completion capacity.
The important point is that these two adjustments were occurring for different reasons. Operators were drawing down DUC inventories because completing an already-drilled well was cheaper than drilling a new one. Service companies were retiring equipment because prevailing pricing did not justify keeping every marginal fleet active. The result was the same. One source of flexibility was disappearing on the demand side while another was disappearing on the supply side.
During Halliburton’s Q4 2024 earnings call, Jeff Miller remarked that the company had been retiring equipment rather than work in the spot market. He added that the practice extended beyond Halliburton and that he expected meaningful tightness in frac as gas activity recovered.
Miller is not describing a future possibility. He is describing frac capacity, the largest and most capital intensive component of the completion market, that has already left the system. The economics no longer justified keeping certain frac equipment active at prevailing pricing.
Equipment that is retired is not waiting on the sidelines for better pricing. It is gone.
Retired equipment is different from equipment that has merely been parked. The implication is that some capacity may be slower to return than fleet counts alone imply.
Liberty Energy’s commentary sheds light on the mechanism.
In its Q3 2025 release, the company described accelerating equipment attrition and fleet cannibalization, adding that the process was “setting the stage for a more constructive supply and demand balance” across industry frac fleets.
Attrition removes equipment from active service. Cannibalization goes further. Components from inactive fleets are used to keep active fleets running.
This is where the physical reality begins to matter. Components that once sat inside idle fleets are now being used to keep active fleets operating. The pool of equipment available for future reactivation is shrinking.
If this is the setup, the question becomes where value accrues.
The demand picture appears to be firming just as parts of the completion market look less responsive than they once were. Primary Vision’s frac spread count rose from 153 at the start of 2026 to 192 by late May, an increase of roughly 25% year to date. Liberty Energy noted in its Q1 2026 commentary that completion market conditions firmed faster than expected, allowing pricing to recover earlier than anticipated.
The rig count, by contrast, has remained largely unchanged.
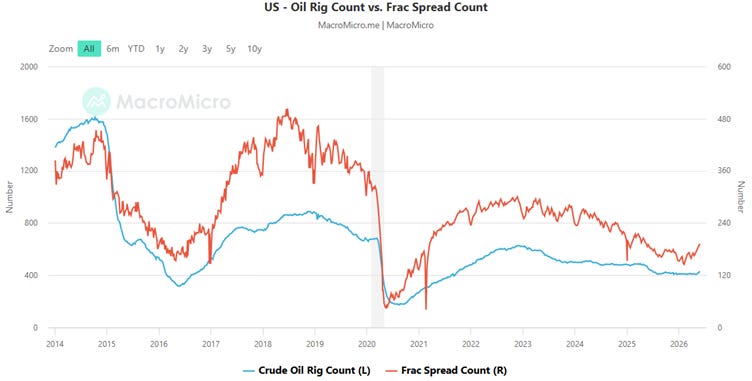
If that proves correct, the opportunity is not simply to own more oilfield-services exposure. It is to identify the businesses positioned to benefit most from rising drilling and completion activity.
Not every participant benefits in the same way from rising activity. Pressure pumpers are highly exposed to activity, but they also carry the burden of maintaining, refurbishing and replacing large fleets. As a result, the most obvious beneficiary is not always the most attractive one.
There are others who are tied to the same well construction and completion cycle with far less reinvestment required.
That is the corner of the market I am interested in.
The best business to own in that setup is the one that benefits when wells move into completion, whether from existing DUC inventory or from fresh drilling, while also participating in the construction of new wells through cementing, all without carrying the capital burden of a pressure-pumping fleet.
I could only find one company that combined that exposure with a capital structure and valuation I found compelling.
It is relatively small and receives little attention, in my view, compared with larger industry peers.
More importantly, its operating exposure appears unusually well aligned with the conditions described above, yet it still trades at EBITDA multiples closer to half those of more capital‑intensive service franchises.
Comments
Nothing yet. Say the first thing.
Sign in to join the conversation.