
Executive Summary
In Beyond the Power Law articles I-III, I examined Bitcoin’s dynamic geometry in uniform log time, considering both the log price residuals after removing the power law, and the second-order residuals after removing the fundamental log periodic (DSI) mode as well.
In Part I, I demonstrated a six-dimensional embedding attractor structure of lower dimensionality, and in Part II, I examined stretching, curvature, and deformation as possible indicators of enhanced performance over intermediate timescales. In Part III the vector field and flow were extracted, revealing an elongated transverse membrane of effective dimension near 2.
In this Part IV article I present several methods to test whether the geometry is robust and persistent.
Both the first-order and second-order residuals have transverse effective dimension near 2, and the dominant plane of r(u) aligns closely with the fitted DSI plane. The second-order residual rank-2 geometry remains significant against three surrogate test methods. Out-of-sample testing supports persistence of a transverse dimension near 2, but not stable prediction from a fixed transverse basis.
Methodology
The work presented in this article, as in articles I, II, III, is primarily based on a D = 6 embedding space in log price after mapping some 5,839 daily prices onto a uniform 3,000-point grid in log time u = ln t, where t is the age of Bitcoin. After testing alternative tine spacings, I settled on τ = 50 for the delay-coordinate comb construction, with all six tines being in the past or at the latest data point. Thus a tine spacing is 0.0406 in log age, or about 4.1% between adjacent coordinates; with this choice we are exploring intermediate structure.
I also define both first order and second order residuals. The first order residuals r(u) in log price remove the continuous scale invariance (CSI) of the power law trend. The second order residuals q(u) remove both the CSI and DSI (discrete scale invariance of the log periodicity fundamental mode, of measured frequency ω = 8.80 and that corresponds to a spacing parameter λ = 2.04).
Global Dimensionality
The choice of D = 6 was made as a balance between allowing room for complexity to manifest and also trying to keep things moderately interpretable, after first investigating how the K-Y effective dimension of the reconstructed attractor changes as a function of D, the number of embedding dimensions. The effective attractor dimension does not converge as D is raised to 10, but it does grow more slowly than linearly in D.
The transverse result was checked across embedding dimensions D= 4–8 and across alternative delay and cross-sectional choices. Although the available normal space increases from three to seven dimensions, the absolute transverse effective dimension remains close to 2. This indicates that the rank-2 result is not created by selecting D=6 or by one particular cross-sectional construction.
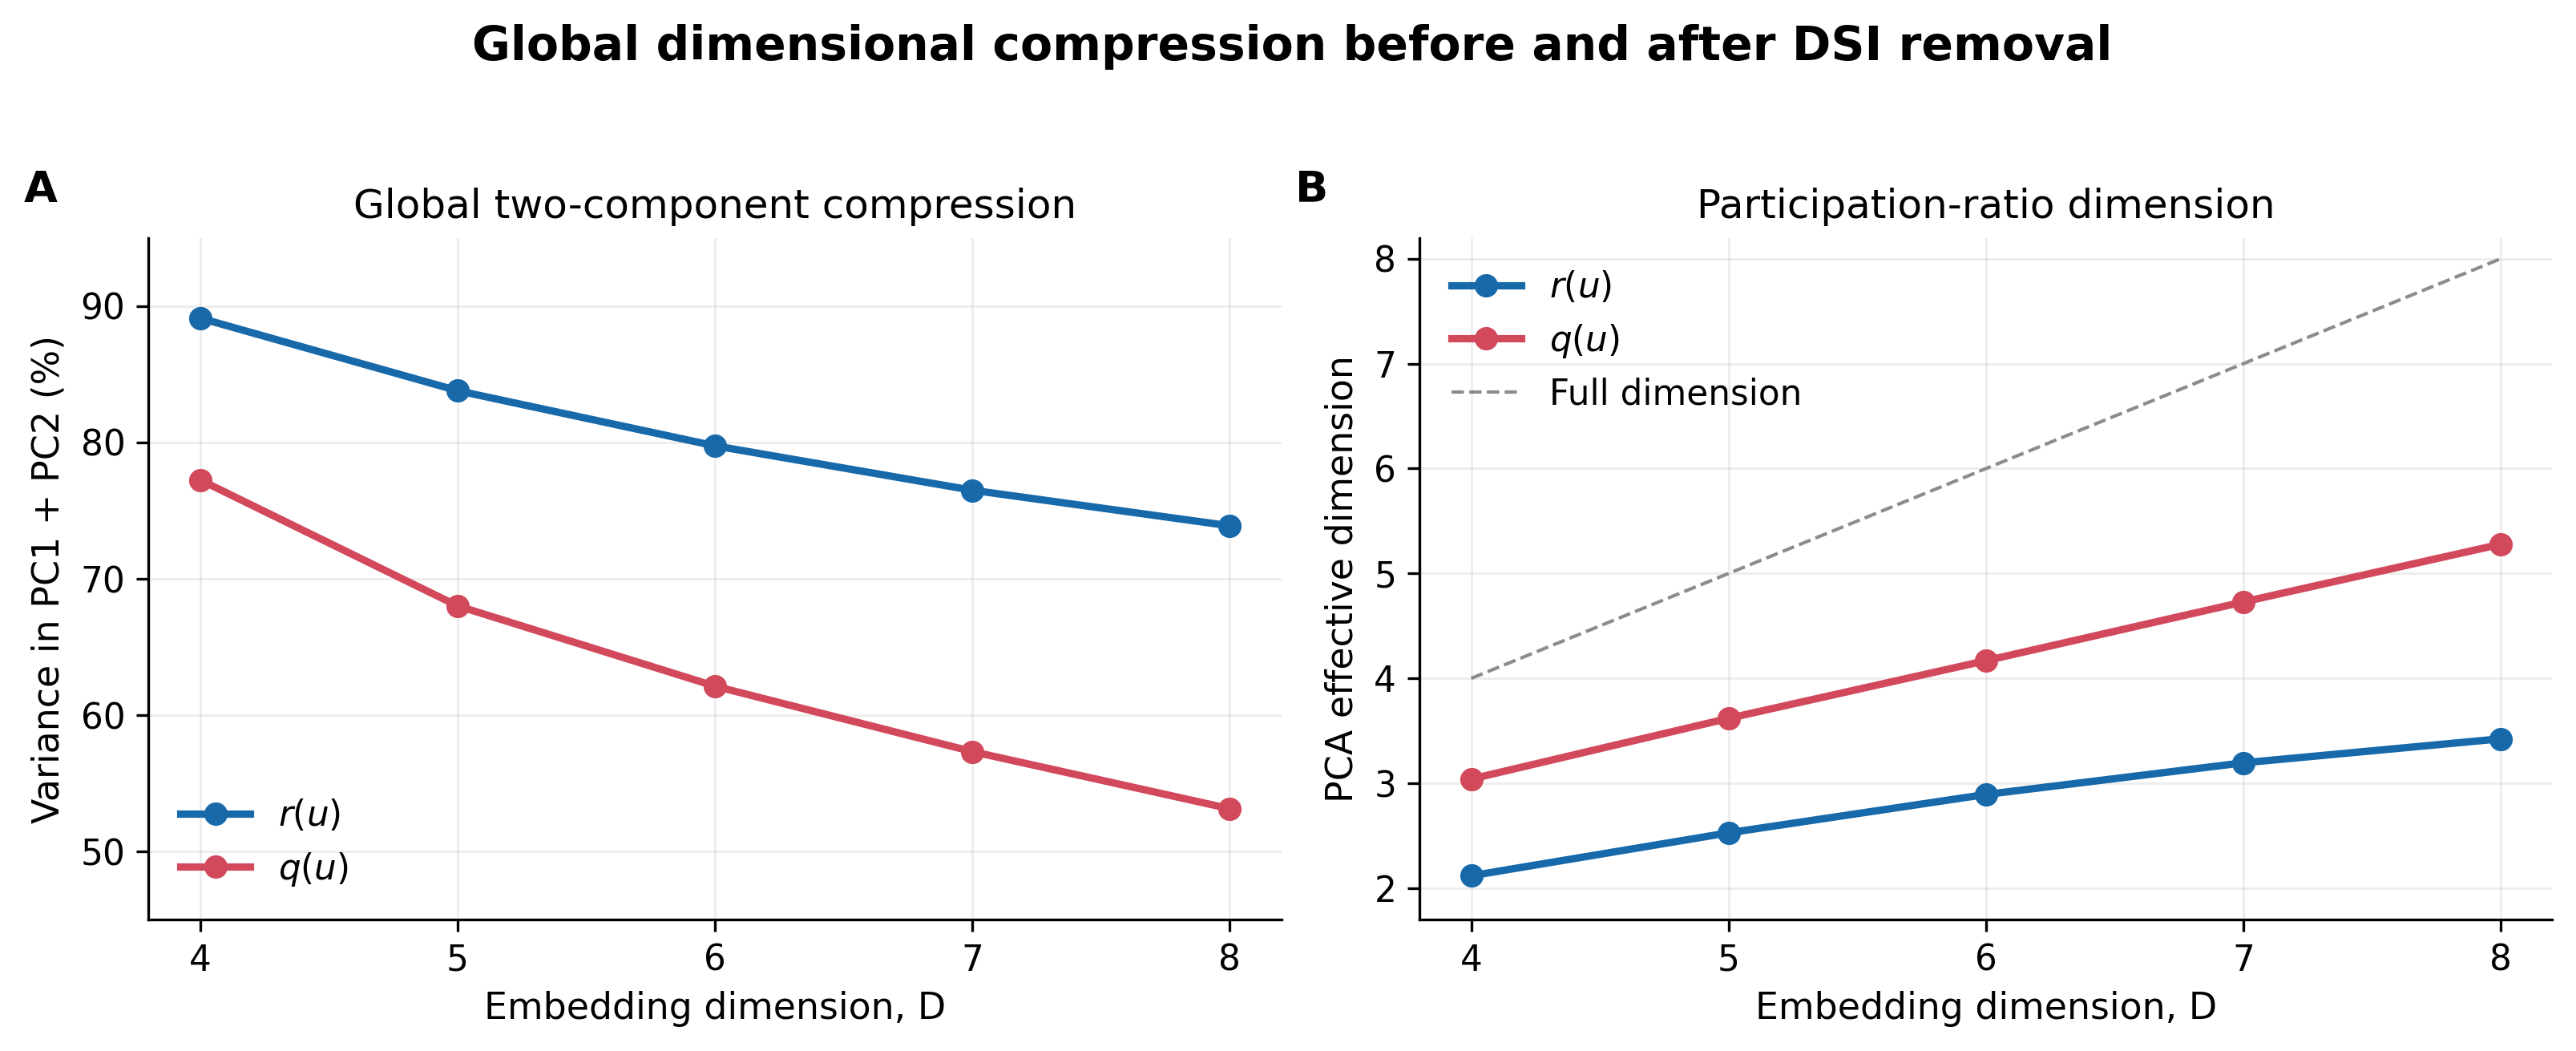
For diagnostic purposes I explored two-component compression and participation dimension across embedding dimensions D= 4-8 also. The compression is how much of the variance for either r(u) or q(u) is explained by the two principal components, and is plotted in Figure 1A below. At D = 6, 80% of the variance is found in just the two components, and it remains above 70% even when D = 8. The first order residuals are much more compressed than the second order residuals q(u). This is attributed to the orderly nature of the DSI fundamental.
In Figure 1B we see the participation ratio, which is about 2.9 (only half of the available six) for the effective dimension from principal component analysis of r(u), and it is 4.2 for q(u), at D = 6. Only a lower dimensional volume of the full phase space is being occupied, the attractor has notable non-random structure.
These values do not conflict with the later discussion in this article of a transverse dimension that is very near to 2.0. The two statistics answer different questions:
Global PCA dimension: dimensionality of the complete reconstructed trajectory.
Transverse effective dimension: dimensionality of the cross-section normal to the trajectory.
Comparison with DSI Fundamental Mode
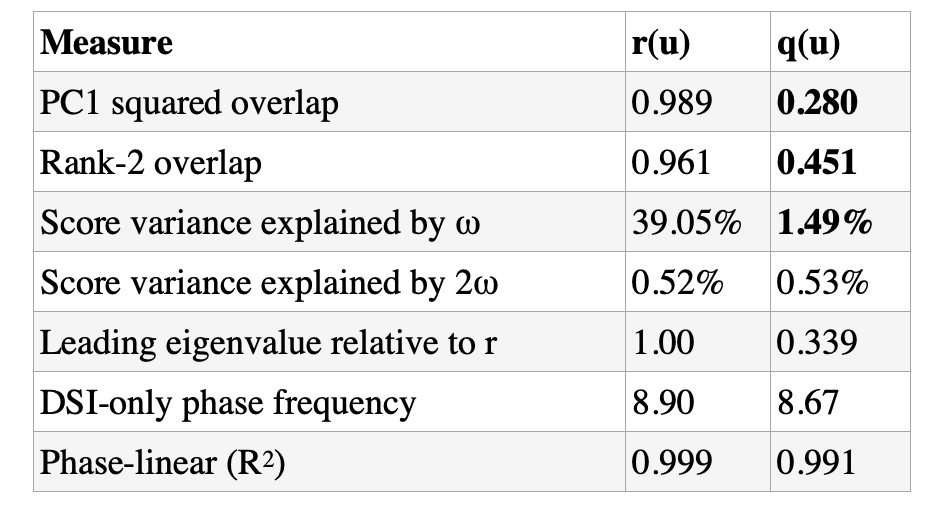
For the r(u) residuals — but not for the q(u) residuals — the overlap between the fitted DSI and the observed reconstructed attractor structure is very strong. Table 1 shows the leading principal component squared overlap to be at the 0.989 level indicating nearly complete directional alignment. The same measure is only 30% for the second order residuals. And the rank-2 (planar) overlap is at the 0.961 level.
About 39% of the variance is in the fundamental mode for r(u), but with the second order residuals that mode is removed the variance explained drops to less than 2%. The 2ω harmonic explains only 0.5% of variance and is not a prominent component. The leading eigenvalue for the transverse (to the overall trajectory in six dimensions) falls by 2/3 as we move from the first-order to second-order residuals. This is also supportive of the significance of the DSI fundamental mode.
Transverse Effective Dimension Surrogate Testing
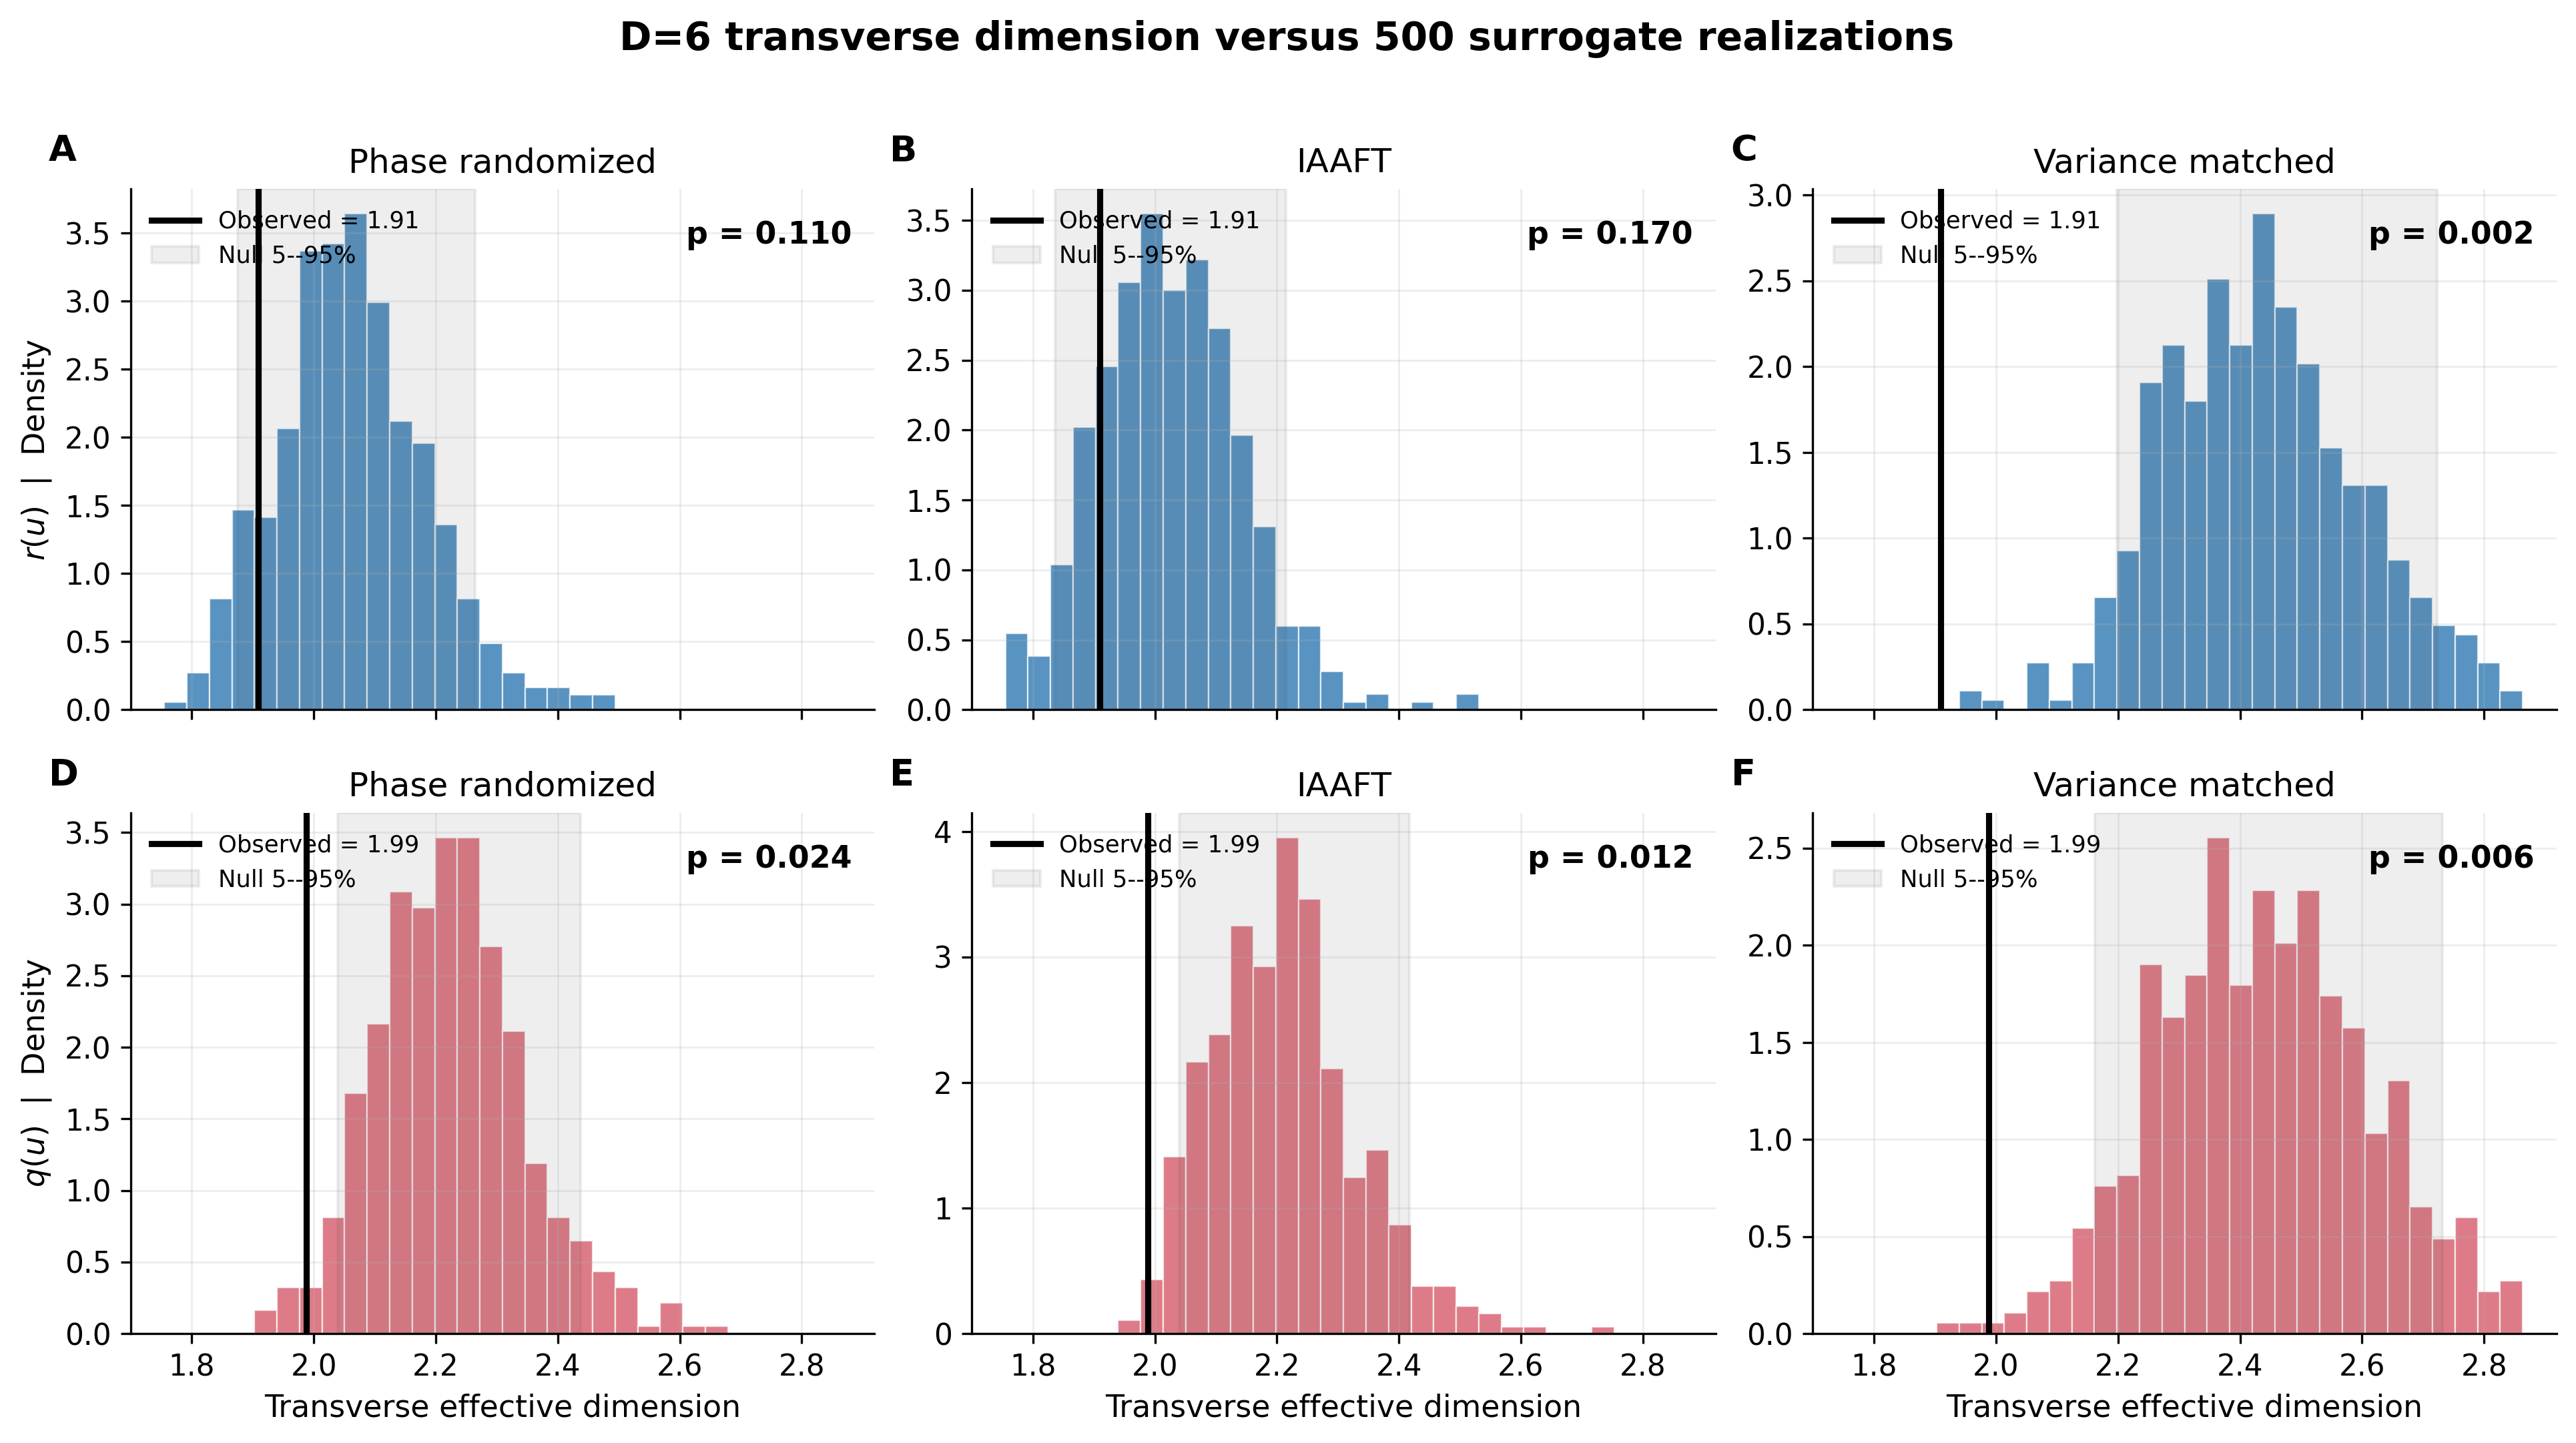
In Part III of this series, I asserted an effective transverse dimension of ~2 out of the 5 dimensions perpendicular to the principal trajectory in the embedding space. For this article surrogate testing has been performed on both the r(u) and q(u) residuals using three different techniques.
For the q(u) residuals (lower panels in Figure 2), all three reject null models at the 5% level, they are all below 0.025. The observed 1.99 transverse effective dimension for the second-order residuals is strongly supported.
For the r(u) residuals the observed effective dimension is 1.91 and the variance matched p-value is much less than 1%, but the phase randomized test is about double the 0.05 level and the IAAFT test result is well above. This is not surprising when one considers that for both the IAAFT and phase randomized tests, the DSI fundamental frequency ω is retained by the surrogate distribution logic.
Overall the results unambiguously indicate that the transverse organization remaining in q(u) is not readily explained by its spectrum, amplitude distribution, or variance profile alone.
Out of Sample Testing
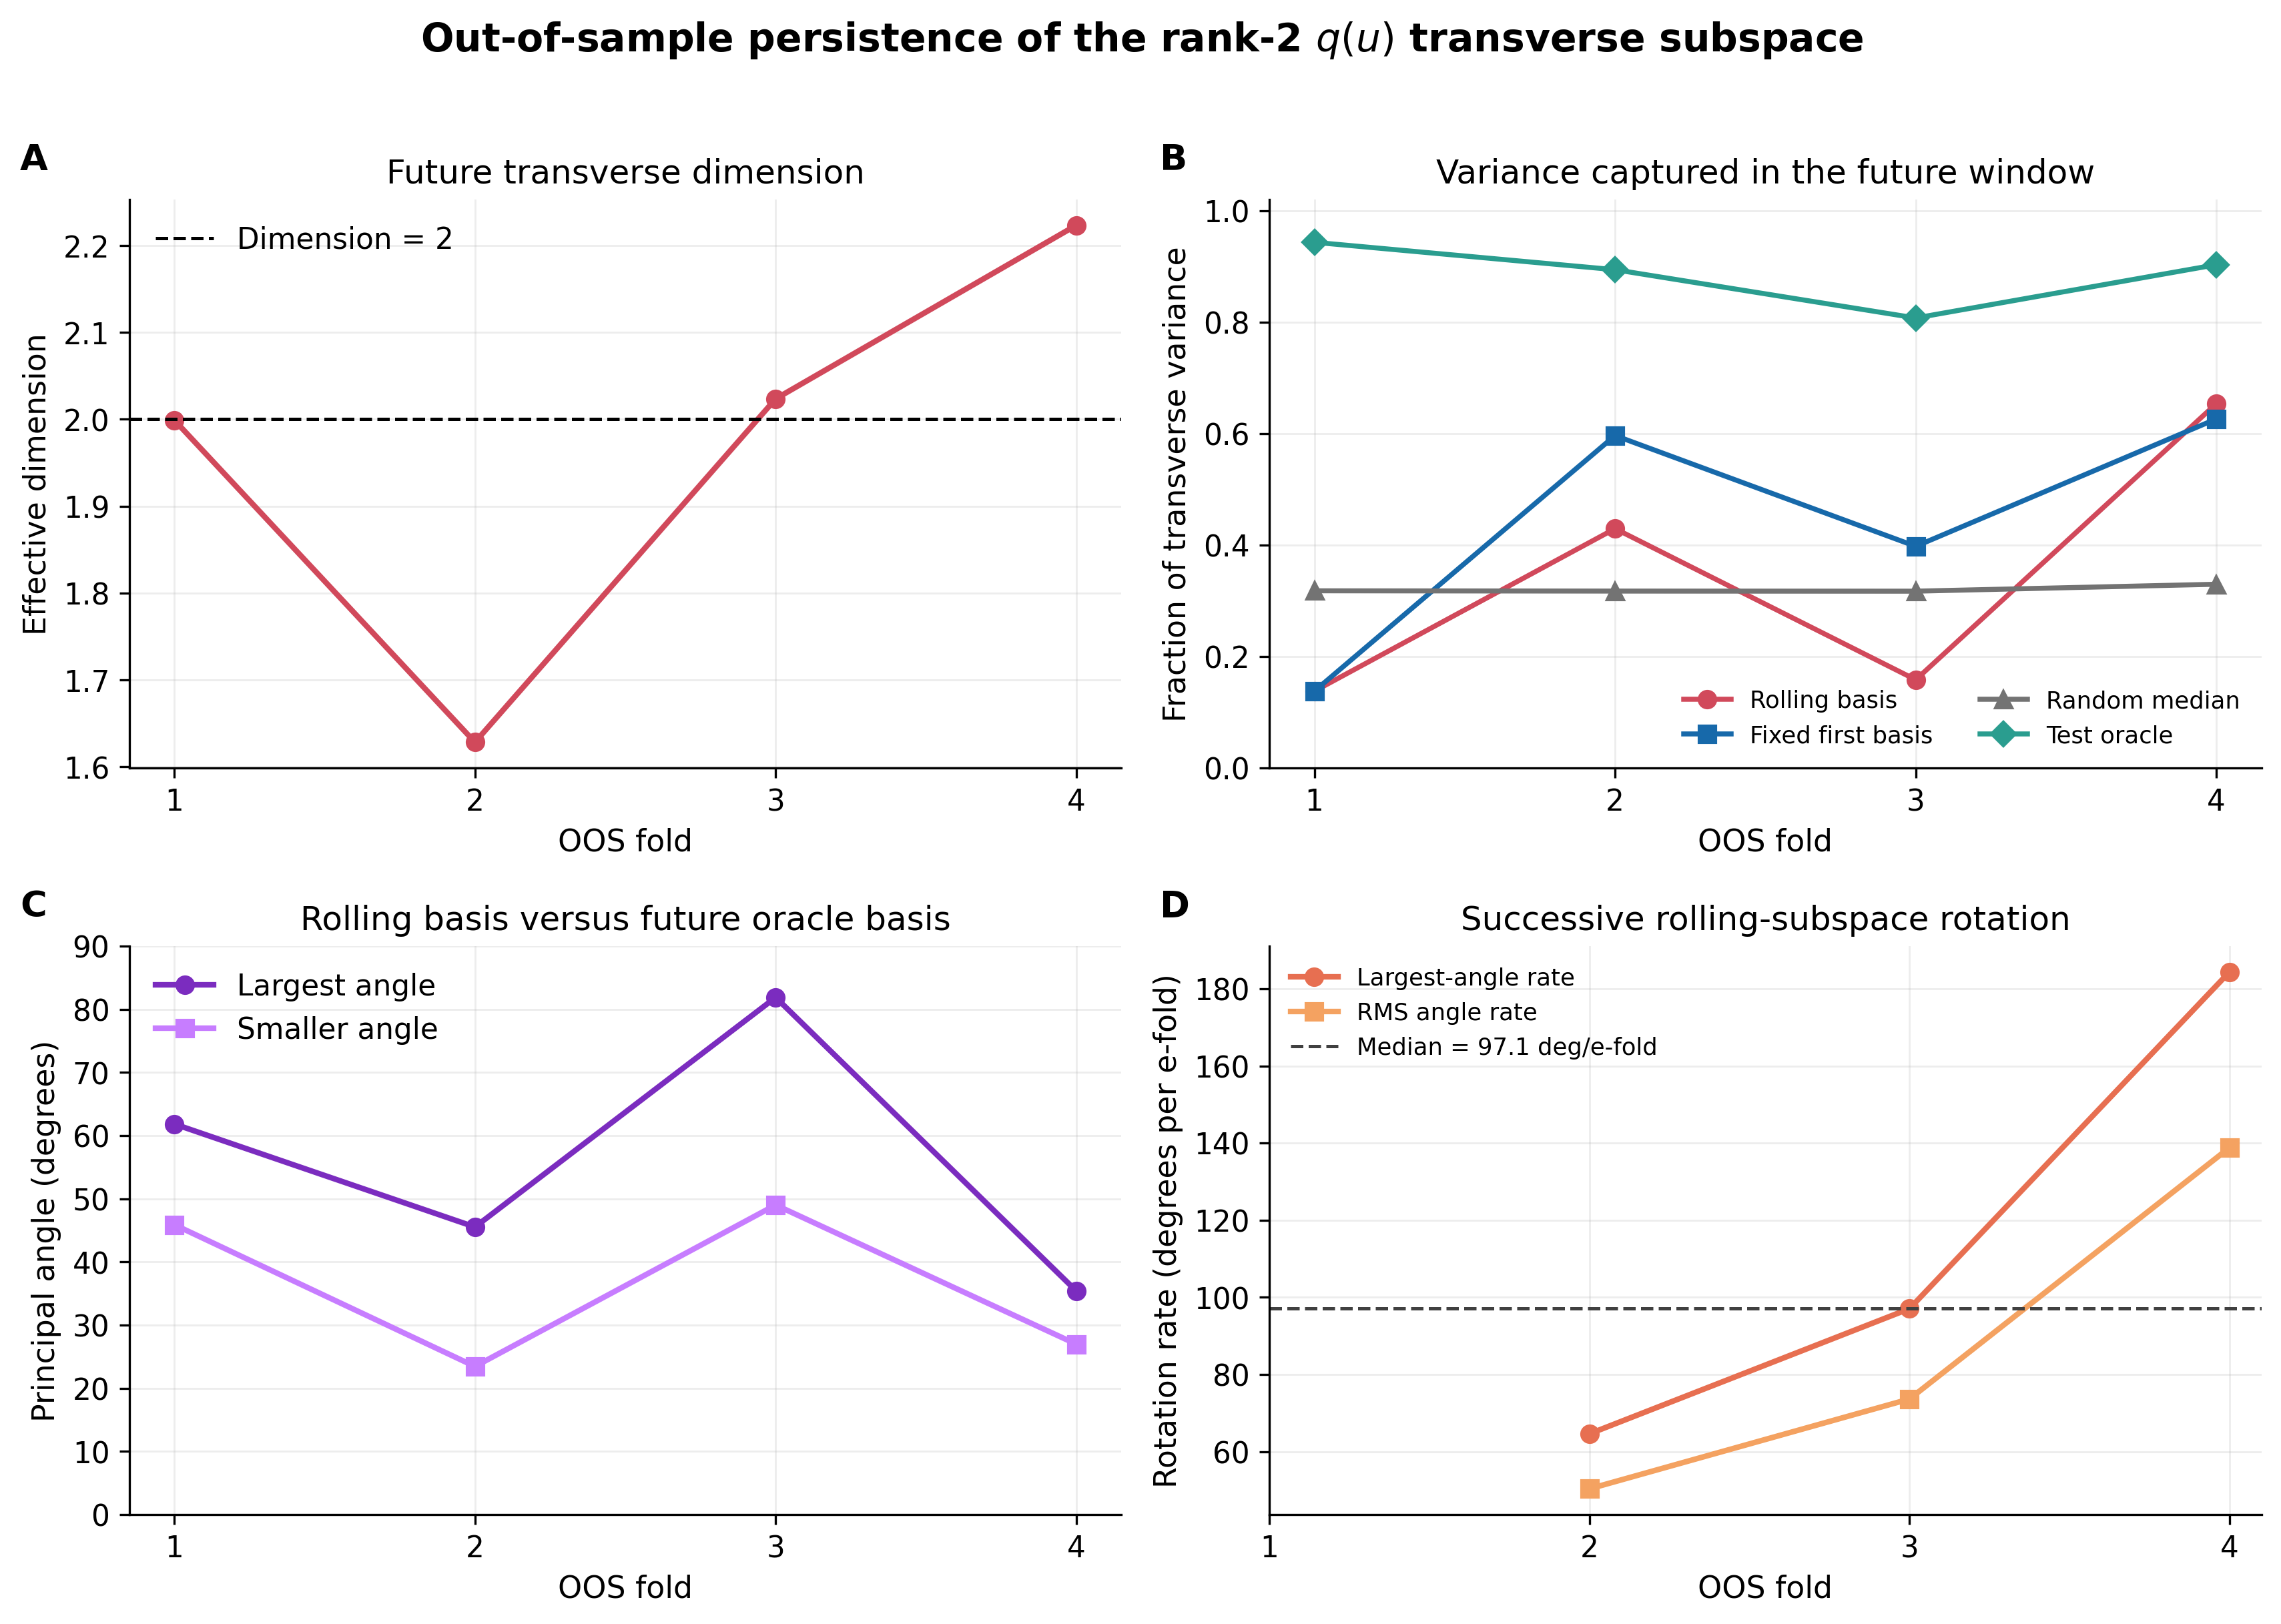
Out of sample testing examines the persistence and predictability of the results. The OOS results for q(u) are presented in Figure 3. The training window increased age by a factor of e (2.718 x) and four subsequent test windows each increased age by e0.25 (1.284 x) without overlapping. Each test window corresponds to a 28.4% increase in Bitcoin’s age. The future transverse dimension stayed close to 2 for each test window (panel A). Future variance capture was variable and did not exceed the random benchmark except in one window (panel B). And tests (C) and (D) both indicated substantial change in orientation (rotation) of the transverse subspace. The subspace persists near rank-2 but the ability to forecast is confounded by its substantial rotation.
Interpretation
Bitcoin’s residual dynamics occupy an anisotropic transverse membrane whose effective dimension is close to 2 for both r(u) and q(u). In r(u), the dominant transverse direction is closely aligned with the fitted DSI mode. The membrane retains approximately the same dimensional form through time, but its orientation rotates within the higher-dimensional reconstructed state space.
The evidence is supportive for DSI, that could explain the two principal components of cosine and sin of the log periodic form. One observes that:
The first-order residual r(u), which retains DSI, is much more globally compressed than q(u).
Removing DSI (log periodicity) substantially reduces the dominance of the leading global PCs.
The first-order residual r(u)’s transverse dimension is not unusual under phase and IAAFT surrogates, both of which preserve its spectral peak.
The second-order q(u)’s transverse dimension remains significant after that spectral structure has been removed.
Conclusions
The results support a hierarchical picture of Bitcoin’s dynamics in which endogenous organization and external perturbations coexist. The primary trajectory is described by the power law, representing Bitcoin’s long-run scale-invariant growth. Superimposed on that trajectory is the fitted DSI mode: a coherent log-periodic oscillation whose frequency, phase evolution and alignment with the dominant transverse plane of r(u) support its interpretation as an additional endogenous organizing component.
The geometric contribution of DSI is substantial. The leading transverse direction of r(u) aligns almost perfectly with the leading direction of the fitted DSI-only embedding, while the complete rank-2 planes have an overlap of 0.961. Removing DSI reduces the leading transverse eigenvalue by approximately 66% and substantially weakens the conspicuous global compression and rotational loop.
Yet DSI does not account for all of the observed organization. After its removal, q(u) retains an effective transverse dimension close to 2, and this low-dimensional structure is statistically unusual under phase-randomized, IAAFT and variance-matched surrogate models. The observed low dimensionality is not readily explained by the fitted DSI spectrum, the marginal distribution of the residuals, or their overall variance.
The transverse dynamics should not be considered exclusively exogenous. They will contain external influences—macroeconomic conditions, liquidity shocks, regulation, technological events and changing investor behavior—but may also contain endogenous Bitcoin mechanisms not represented by the fitted fundamental DSI mode. These could include protocol-driven effects such as halvings, interactions between adoption and price, changing holder composition, or other internally generated modes. The present analysis finds little remaining power specifically at the fitted (2ω) harmonic so does not establish DSI harmonics as the source of the residual rank-2 geometry.
Out-of-sample results reinforce the geometric conclusion while limiting any predictive interpretation. Future windows continue to show an effective transverse dimension near 2, however the orientation of the plane changes substantially. The persistent object has the dimensional form of the membrane, but not a fixed pair of directions needed for a stable forecasting basis.
Taken together, the evidence supports an endogenous CSI–DSI backbone surrounded by a low-dimensional transverse geometry containing a mixture of exogenous perturbations and additional, not yet identified endogenous dynamics. Bitcoin’s reconstructed residual state space is organized, but its internal orientation evolves. An open question remains: what economic, protocol, and behavioral forces rotate and deform the transverse geometry through time.
This is not investment advice. Stephen Perrenod is engaged in econophysics research as Vice-Director of the Scientific Bitcoin Institute (.org), a non-profit dedicated to education and research of the Bitcoin ecosystem.
Comments
Nothing yet. Say the first thing.
Sign in to join the conversation.