
Introduction
Giovanni Santostasi and others, including myself, have demonstrated with a wide variety of methods — around one dozen techniques — and with robust statistical validation — that Bitcoin adheres to a power law when measured in dollar terms.
In his book The Physics of Bitcoin, in Chapter 7, Dr. Santostasi also presents the power laws seen for Bitcoin priced in other currencies, including the Euro, Yen, and Australian dollar, and also when measured relative to two commodities: gold and oil. All of these denominators yield strong regression results, with high R2 values well above 0.9.
Here I extend the analysis with several months of additional data and include here the six major currencies and also four commodities for comparison and reinforcement. Ten numeraires in total were examined.
Bitcoin’s long-run price trend remains a consistent steep power law with only modest changes in slope; the underlying relationship between price and age remains. Volatility is similar for all numeraires, about 0.3 dex or a linear factor of two, as one standard deviation.
Monetary inflation does not explain these results.
Fiat currencies strongly declining relative to Bitcoin
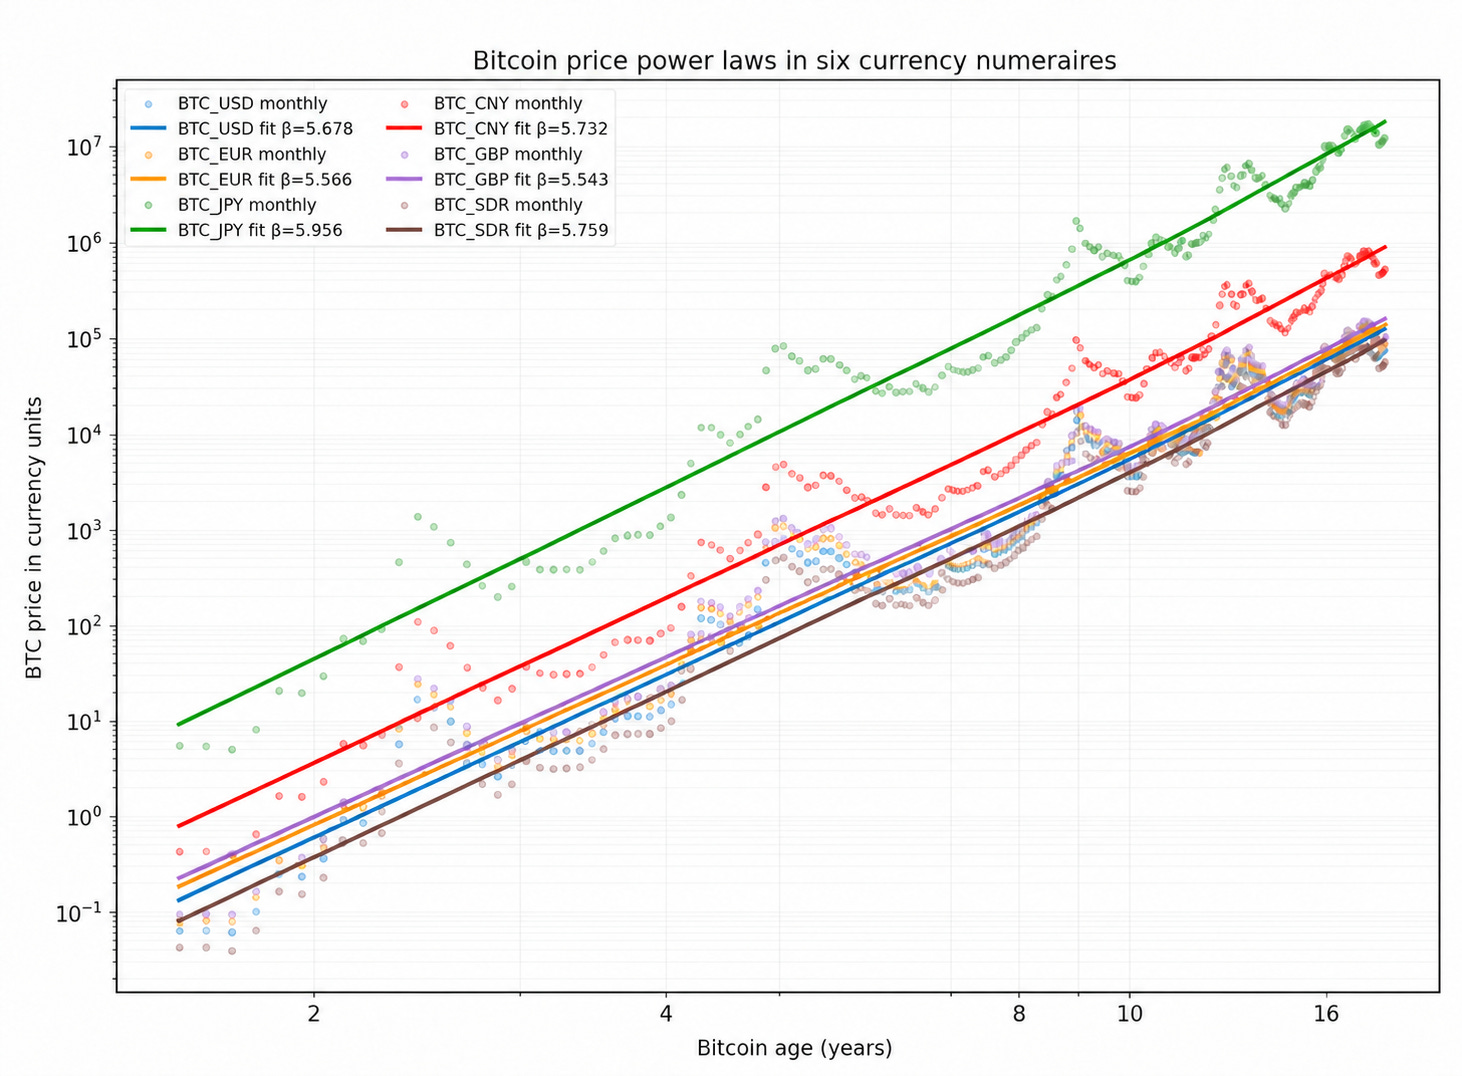
Across the six major currencies: the Dollar, the Euro, the Yen, the Yuan, the Pound and the SDR (a weighted basket of the prior 5 currencies), all have strong fits with R2 around 0.96 and with power law indices ranging from 5.54 for the British pound (strongest) to 5.96 for the Japanese yen (weakest). But the variation is small, less than 8% difference across the exponents.
One sees that the six lines on the log-log chart in Figure 1 are nearly parallel to one another. The dominant fact is power law of Bitcoin’s age with an index 5.4 or greater across all of the major fiat currencies.
It becomes even more striking when one inverts the relationship and measures the currencies with Bitcoin in the denominator. This is shown in Figure 2. The power law exponents are the same for each currency, but now with a minus sign in front. Now the appearance is of fiat in decline when measured against the world’s first money that is defined to scientific precision and anchored by a fixed ultimate supply.
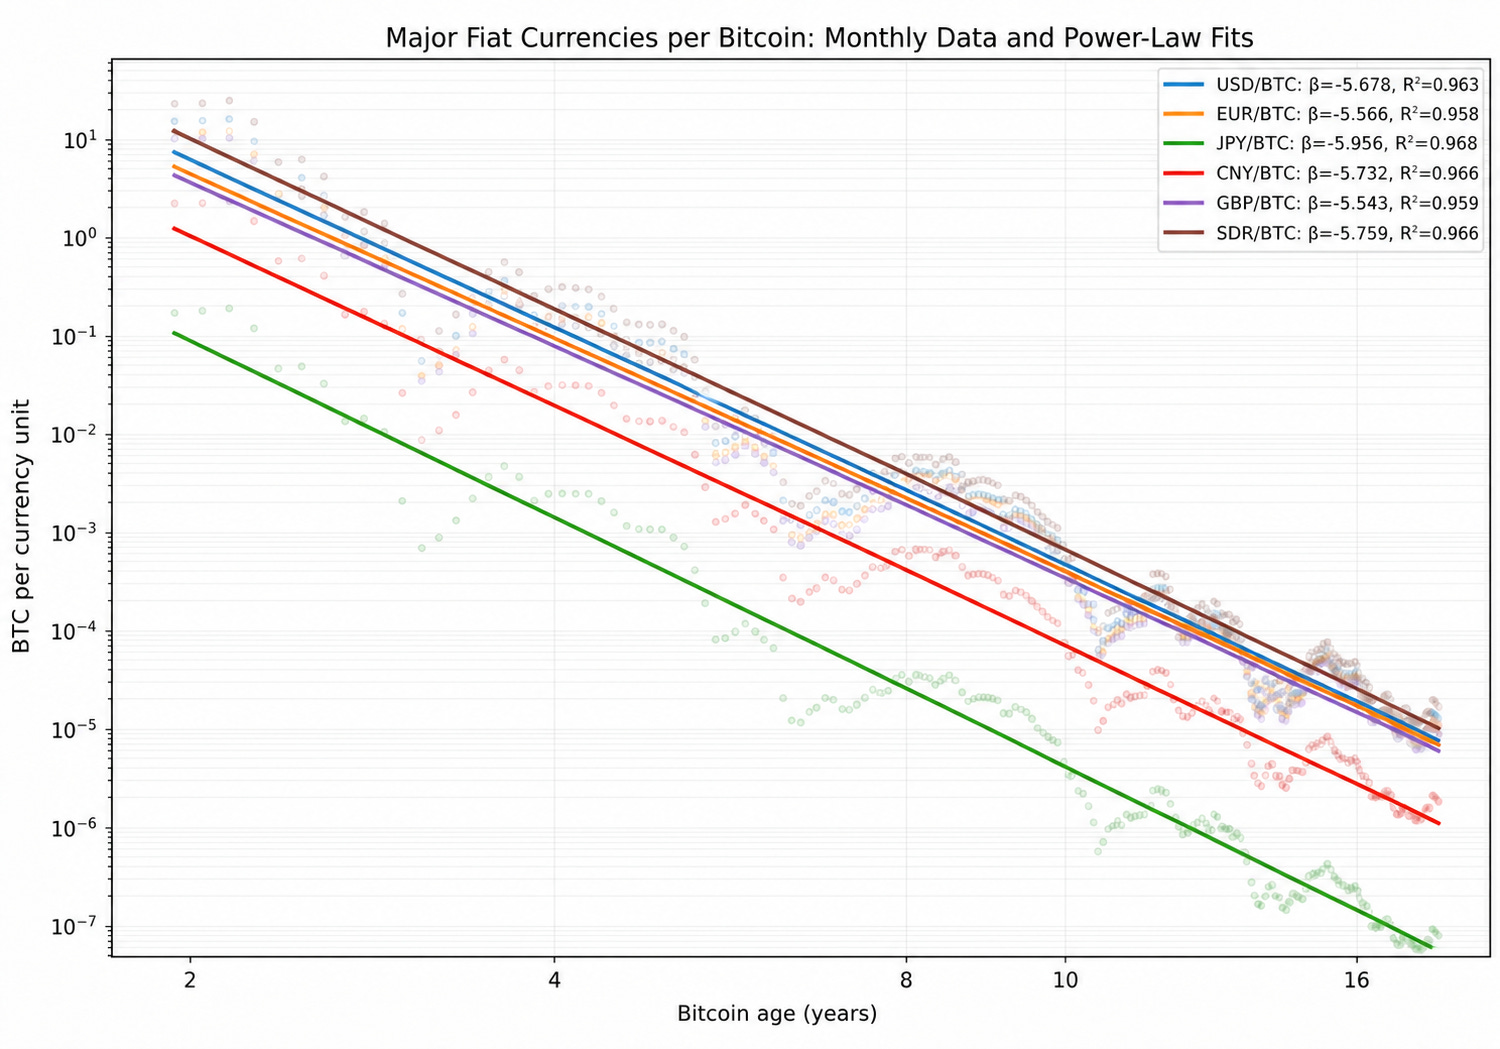
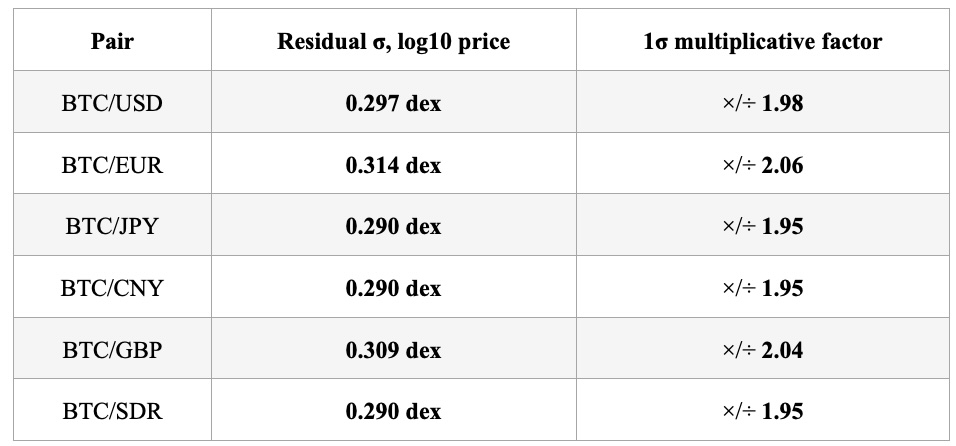
Table 1 lists the residual standard deviations in log10 price terms for each of the Bitcoin / currency pairs, and in all cases the one standard deviation value is close to 0.3 dex, which is a multiplicative factor of two in linear terms. The values for the various currencies are surprisingly close, there is only a 5% range in the linear multiplicative factor.
Thus for example if the fair value on the power law trend was $120K at some point in time, then the Gaussian approximation is that 68% of the data points would lie in the range of $60K to $240K, corresponding to Z = -1 and +1 scores, respectively. A factor of two is not unusual, and does not undermine the power law statistical relationship. One has to keep in mind that the price moves by a factor of about 1 million in Figures 1 and 2 for each of the six currencies.
Inflation?
A related question is, does Bitcoin’s apparent power-law appreciation merely reflect monetary inflation? The evidence suggests otherwise.
Bitcoin’s annualized supply inflation generally exceeded U.S. M2 growth until the 2016 halving, yet Bitcoin appreciated rapidly against every fiat and commodity numeraire examined here, and at a remarkably consistent power-law rate. Monetary expansion may influence the level and cyclical behavior of nominal prices, but it neither explains an exponent near 5.7, nor does it explain the persistence of similar scaling when Bitcoin is measured against gold, silver, oil, and corn.
Commodities strongly declining relative to Bitcoin
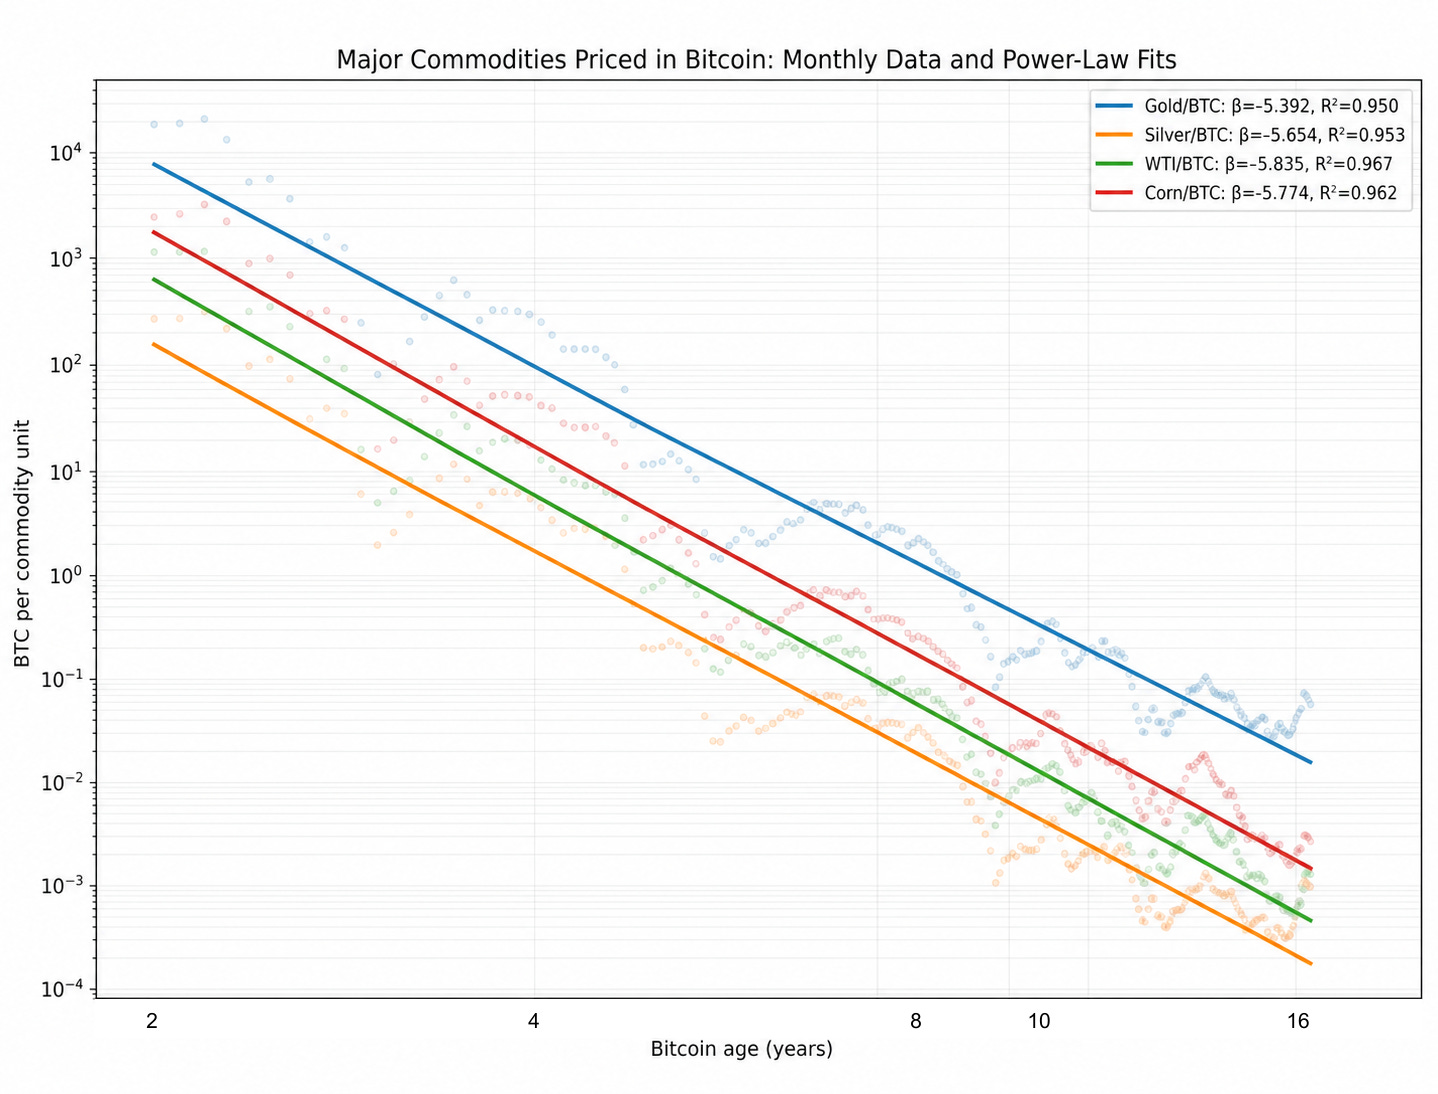
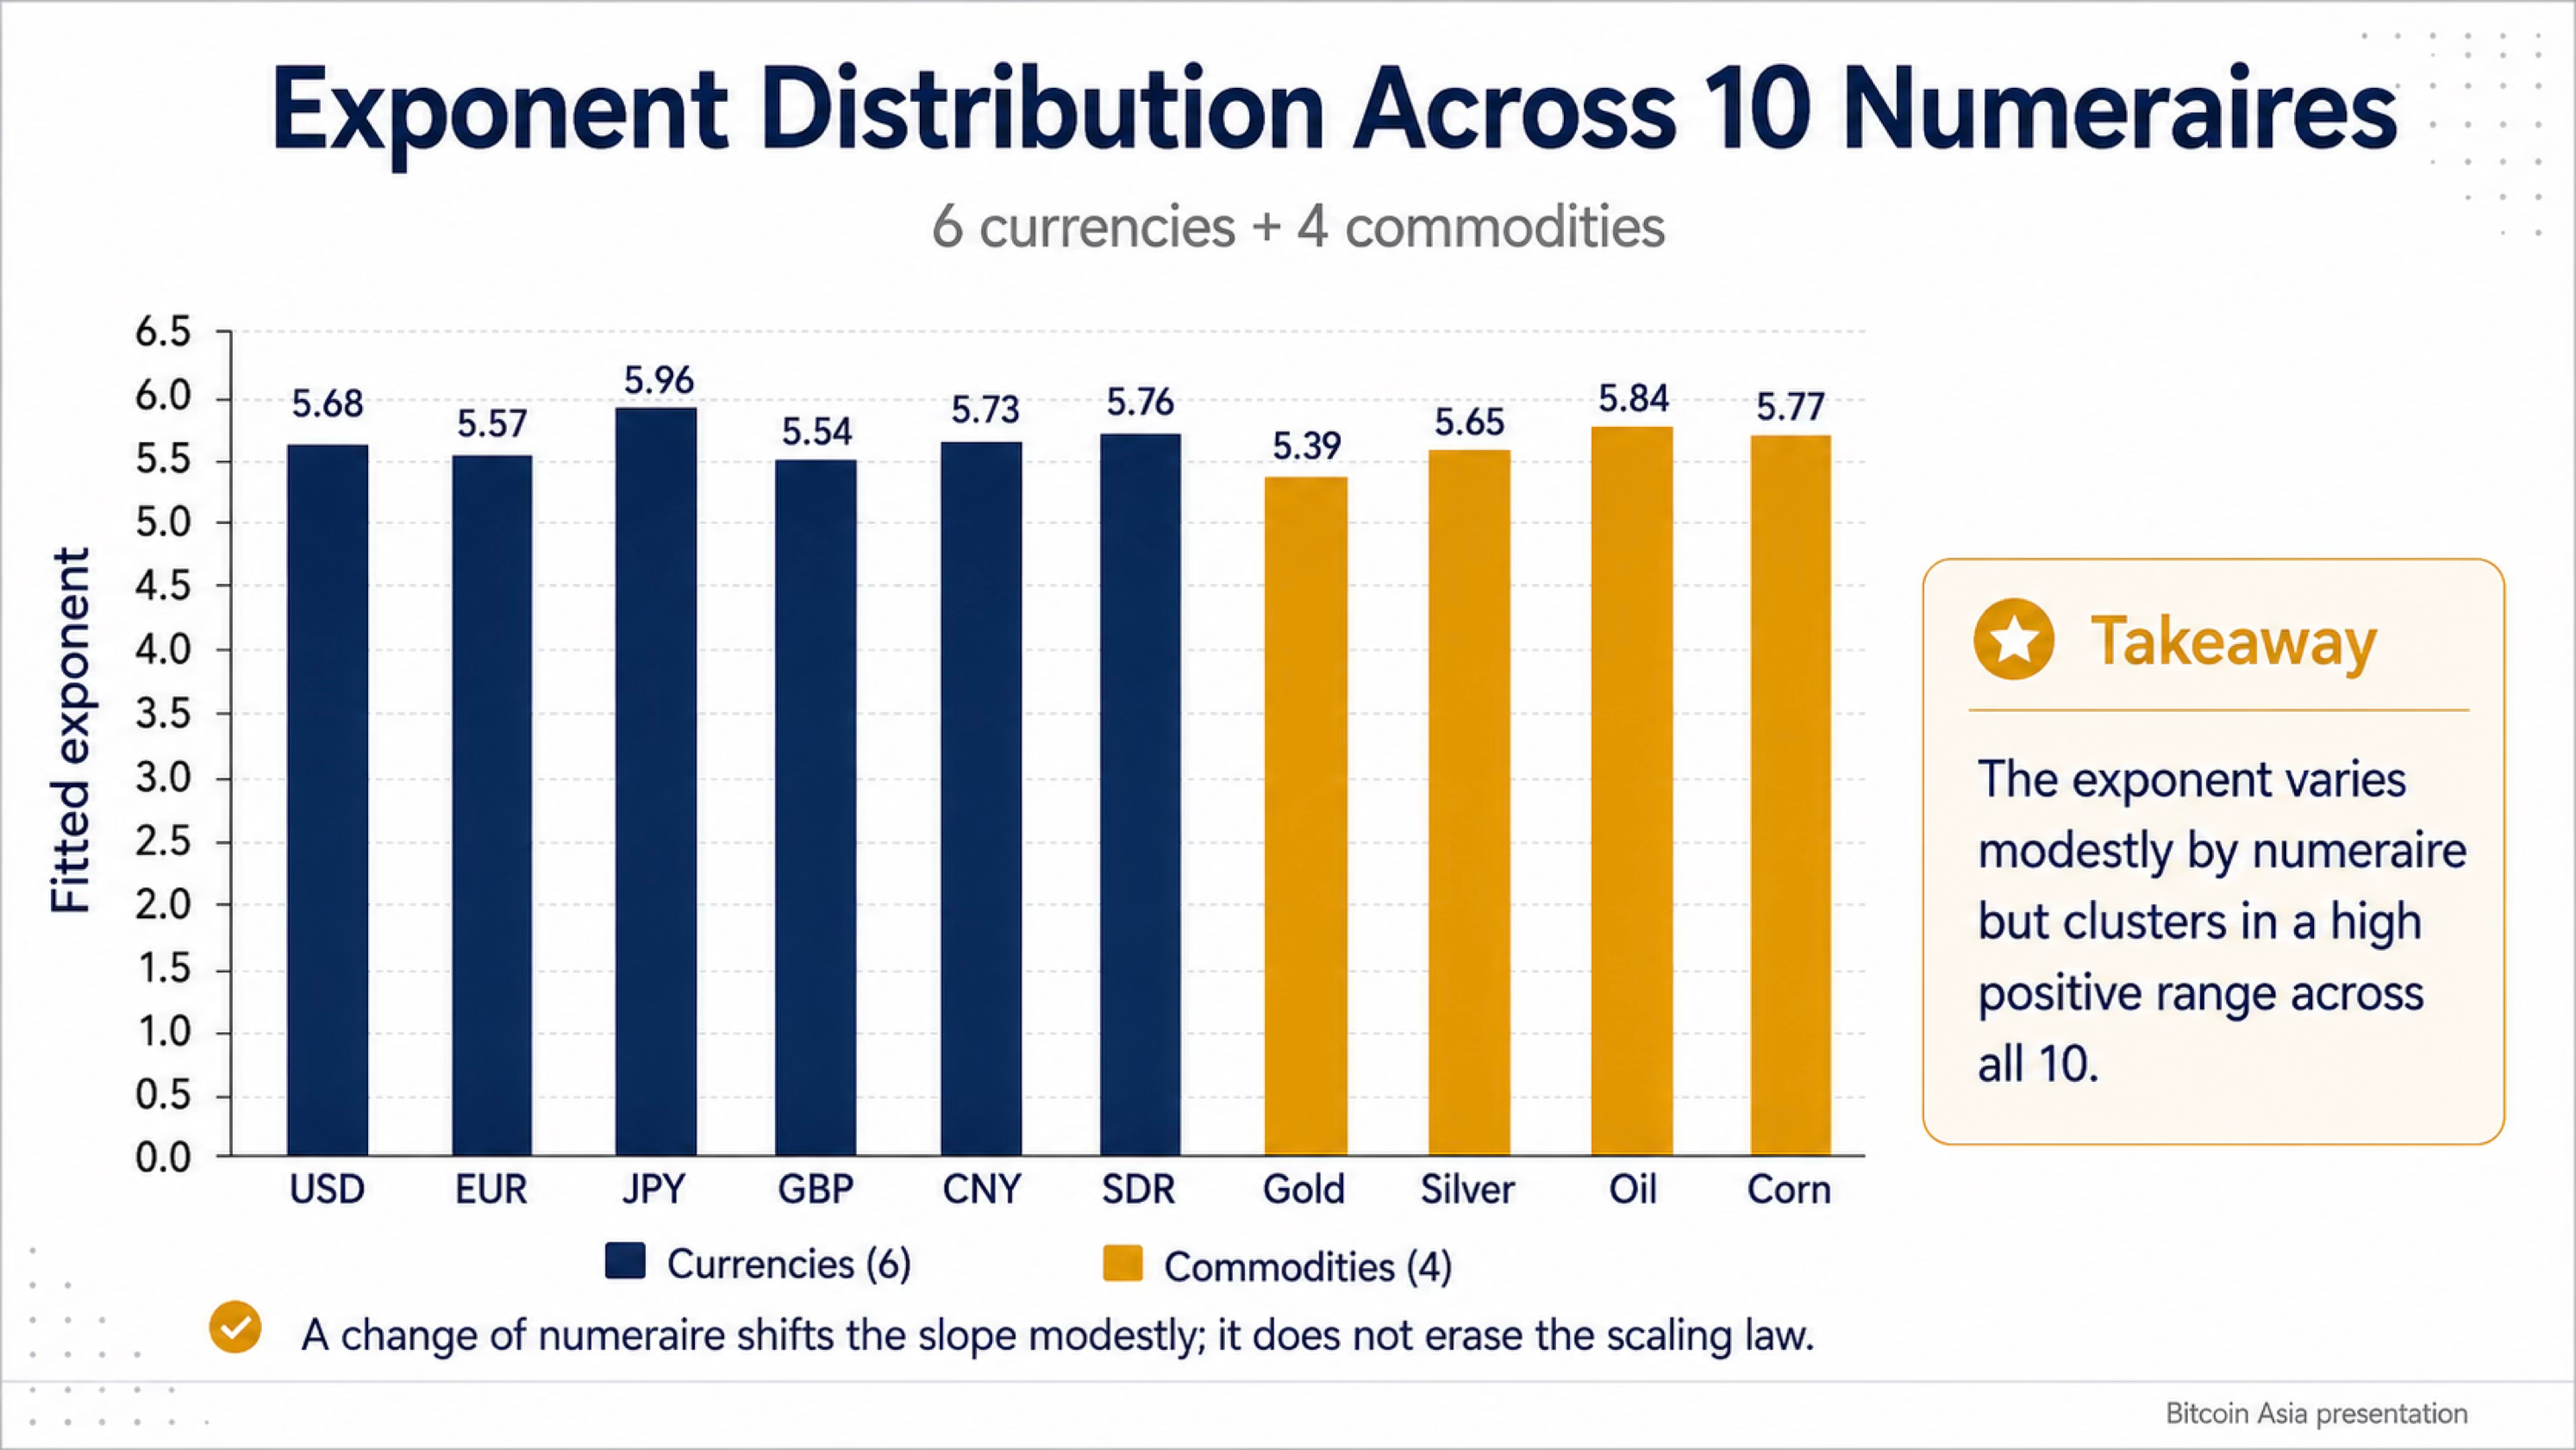
Figure 3 shows the power law of age (Bitcoin’s age) decline of prices of four commodities when measured in Bitcoin terms. The power law exponents are similar to those found for currencies, and range from 5.39 for gold to 5.84 for oil (West Texas Intermediate). Again the R2 are very high, in the range of 0.95 to 0.97.
Summary for 6 Currencies, 4 Commodities
Figure 4 summarizes all the power law exponent values for the regressions displayed in Figures 1, 2, and 3. They are all within 6% of the USD exponent of 5.68, ranging from 5.39 for gold to 5.96 for the Japanese Yen. This is an exceptionally tight range, and combined with the R2 values for all numeraires ranging from 0.95 to 0.97, we have strong evidence that Bitcoin’s power-law relationship is robust to the choice of numeraire.
Summary
Bitcoin’s long-run price follows a remarkably consistent power law. Across six major currencies, the fitted exponent remains tightly concentrated between 5.54 and 5.96, with R2 values near 0.96.
The scaling law is largely independent of the unit of account. Changing the numeraire shifts the estimated slope modestly, but does not obviate the underlying relationship between Bitcoin’s price and its age.
The result extends beyond fiat currencies. Bitcoin exhibits similar power-law appreciation against gold, silver, oil, and corn, with commodity exponents ranging from 5.39 to 5.84.
Shorter-term volatility occurs around a stable long-run trend. Across the six fiat numeraires, the typical one-standard-deviation deviation from the fitted trajectory is approximately a factor of two in either direction, large in Tradfi terms, but small relative to the many orders of magnitude of Bitcoin’s price appreciation.
Monetary inflation alone cannot explain the result. Bitcoin appreciated rapidly even when its own supply inflation exceeded U.S. M2 growth, while comparable scaling against scarce commodities further indicates that the observed power law is not simply a consequence of fiat debasement.
This is not investment advice. Stephen Perrenod is engaged in econophysics research at the Scientific Bitcoin Institute.
Comments
Nothing yet. Say the first thing.
Sign in to join the conversation.