
First of all: to all the Spanish subscribers: congratulations world champions. Well deserved.
Last week I published a strategy that buys EUR/JPY dips but only when the positioning data of a completely different market it’s triggered.
That article was really about one idea:
Intermarket analysis, running on alternative data.
In other words, to trade one market, you can use data from another. Ask ten traders what their signals are built on. Nine will tell you price and volume some through indicators, some through pure price action.
The thing is, the moment your signals come from data those nine ignore, your odds of finding a solid edge go up.
Simple concept (not always easy to implement).
In any case you can read my insiths about it here:
The obvious next question, and several of you asked it: does the same idea work anywhere else?
It does. I run several strategies built on alternative data from other markets. Today I'm showing you a second one.
A good source to go deeper on intermarket ideas is the book by Markos Katsanos Intermarket Trading Strategies.
In today’s article, you’ll see:
The free government report that tells this system when to short bonds published every Friday, about a market that has nothing to do with bonds. The signal is two groups inside that report contradicting each other.
The 3 conditions of this system, none of which survives as an edge on its own but combined, they printed one losing year in seventeen.
The exit rule that has nothing to do with price. Nothing to do with trend. Nothing to do with any indicator on the bond chart. And when I tested every alternative version of it, every single one still made money.
Let’s dive in…
Short the 30-year Treasury bond future.
One contract, daily bars (actually 1440 minutes bars).
It trades ten to eleven times a year, inside a narrow calendar window, and holds for a few sessions.
The exit is a fixed schedule. It never looks at price.
No stop, no target, no indicators on the bond chart itself.
The interesting part is who tells it when to show up…

The COT report, quickly, for anyone who skipped last week:
Every Friday, the CFTC publishes a public breakdown of who is positioned long and short in every major U.S. futures market, split by type of trader. Actual positions, on the record, weekly.
This system reads the COT of one specific market. Not bonds but a completely different market.
I'll tell you which one in a minute. Before that, let me show you how the signal works.
The COT splits traders into categories. This system follows two of them.
For each one, I turn the weekly positions into a simple number that tells me if that group is getting more bullish or more bearish.
Most of the time the two groups move in the same direction, and the system does nothing.
But when they split (one getting more bullish while the other gets more bearish) and we’re inside that calendar window, the system shorts bonds on the next open.
The system has three conditions: the calendar window and the two COT readings.
I tested each one separately to see which one carries the edge.
The calendar window alone, with no COT signal: roughly breakeven.
Each COT reading alone: makes some money, but with more trades, deeper drawdowns, and less than half the profit per trade.
The two readings together, without the calendar window: breakeven again.
All three combined: profit factor 2.00 over sixteen and a half years, with the smallest drawdown of all these tests.
I don’t have a clean mechanical story for why the combination multiplies the way it does.
What I have is the full decomposition (you’ll see the whole table in a minute), and a rule of thumb: when every part is weak and the whole is strong, either you’ve found structure or you’ve found luck and there is a way to tell the difference.
I’ll get there…
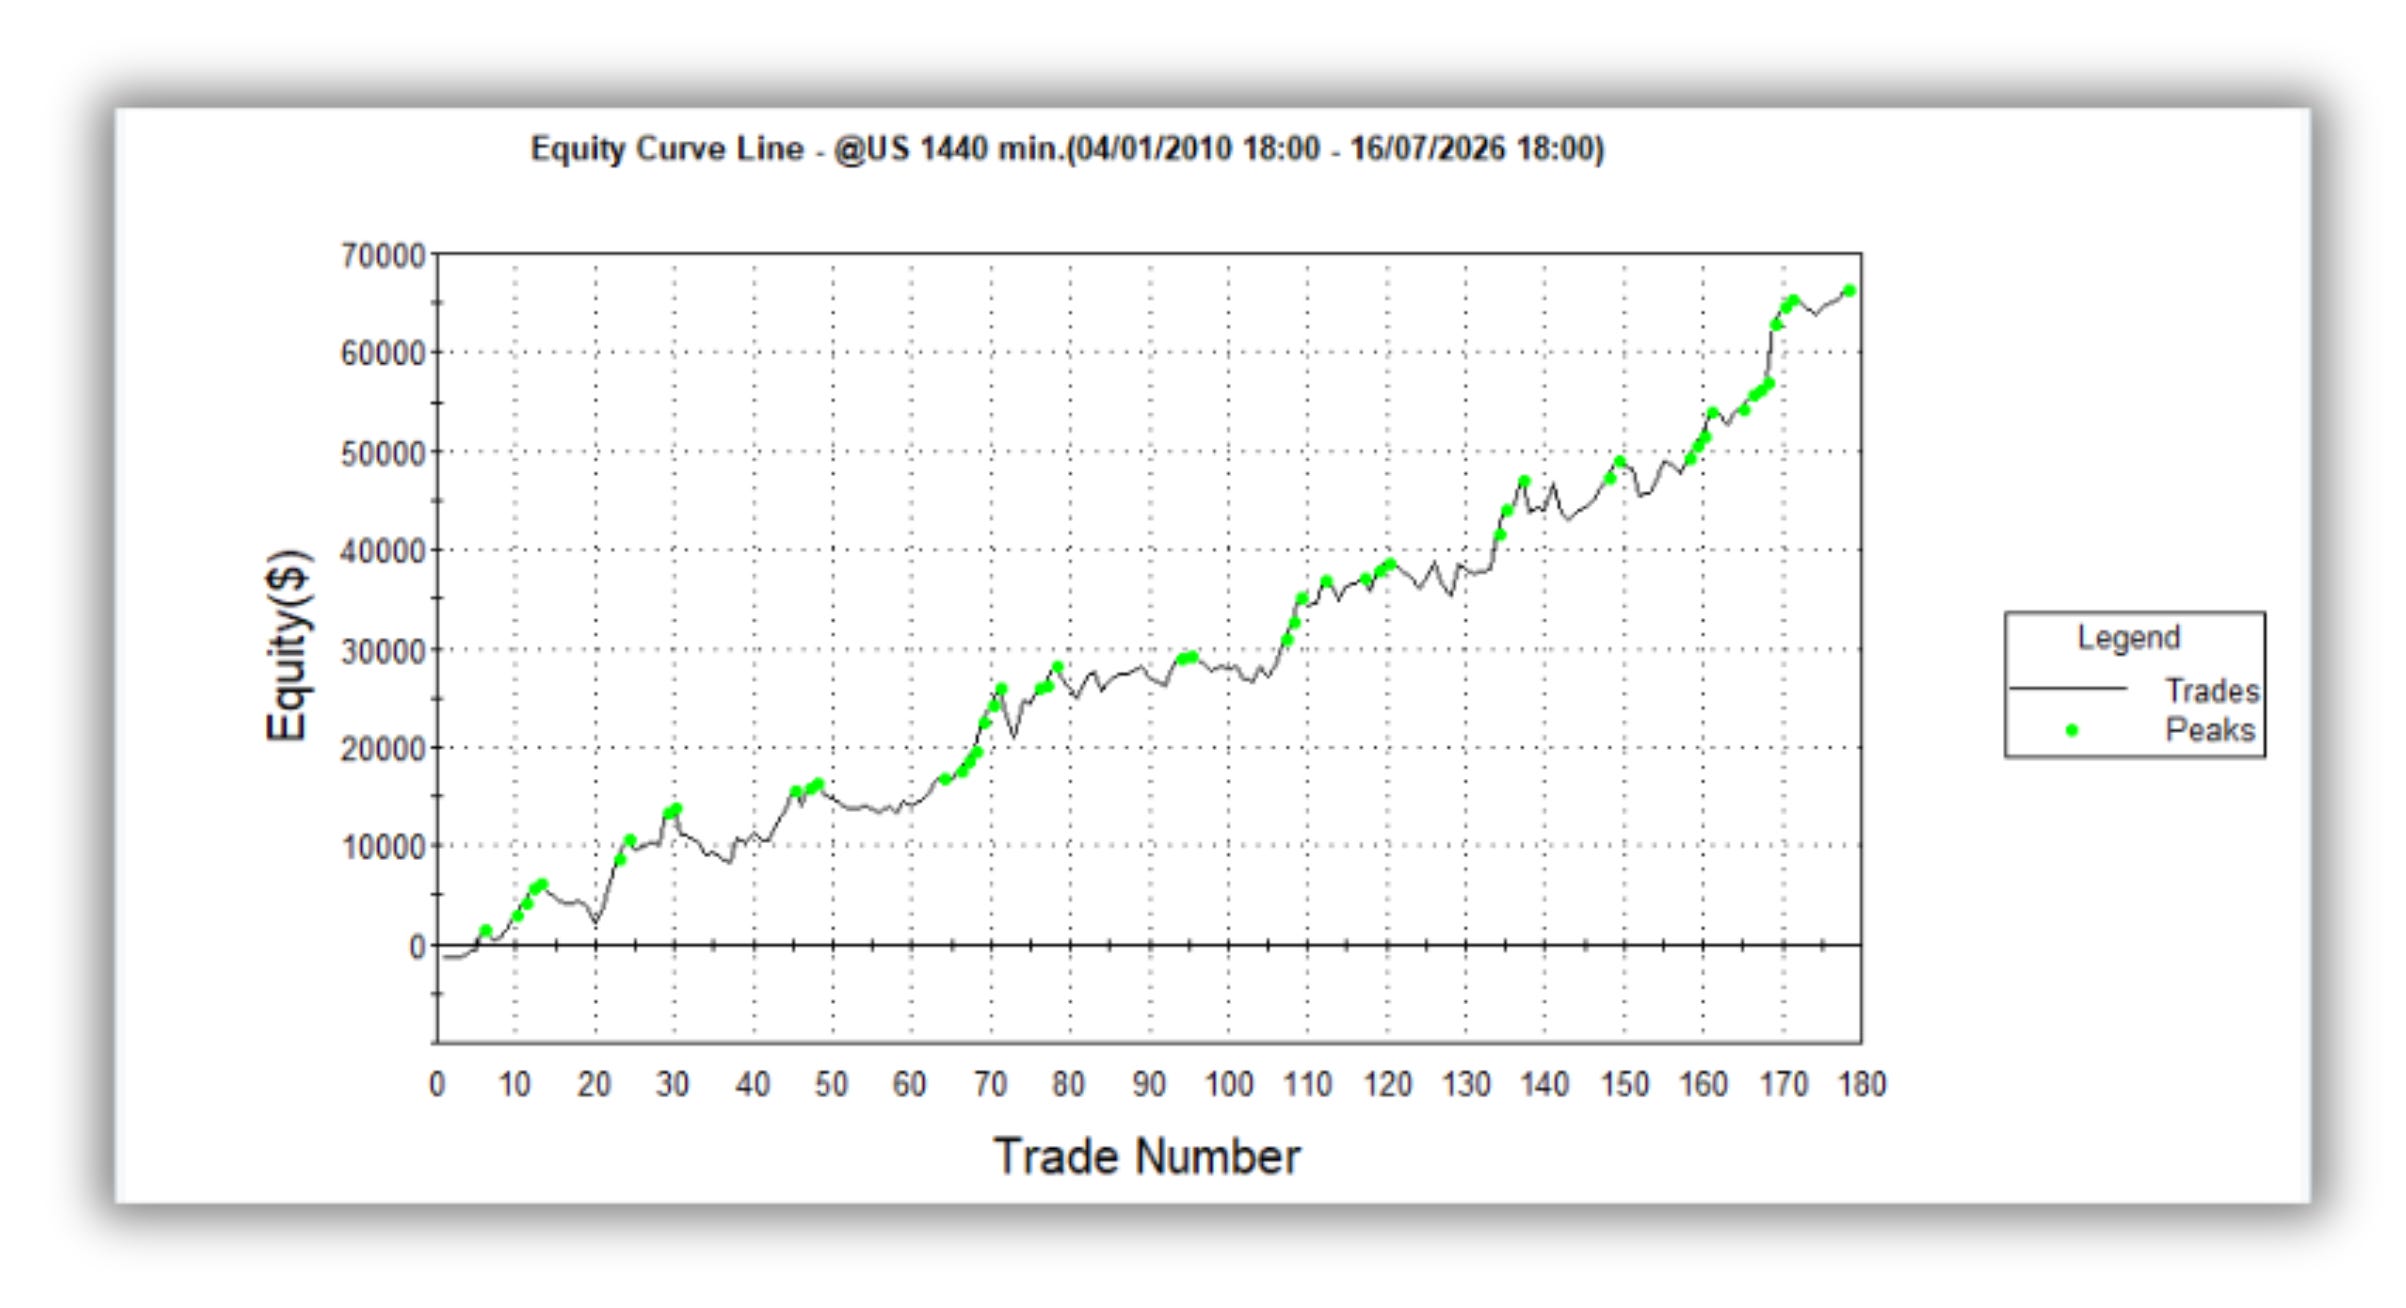

Here some stats:
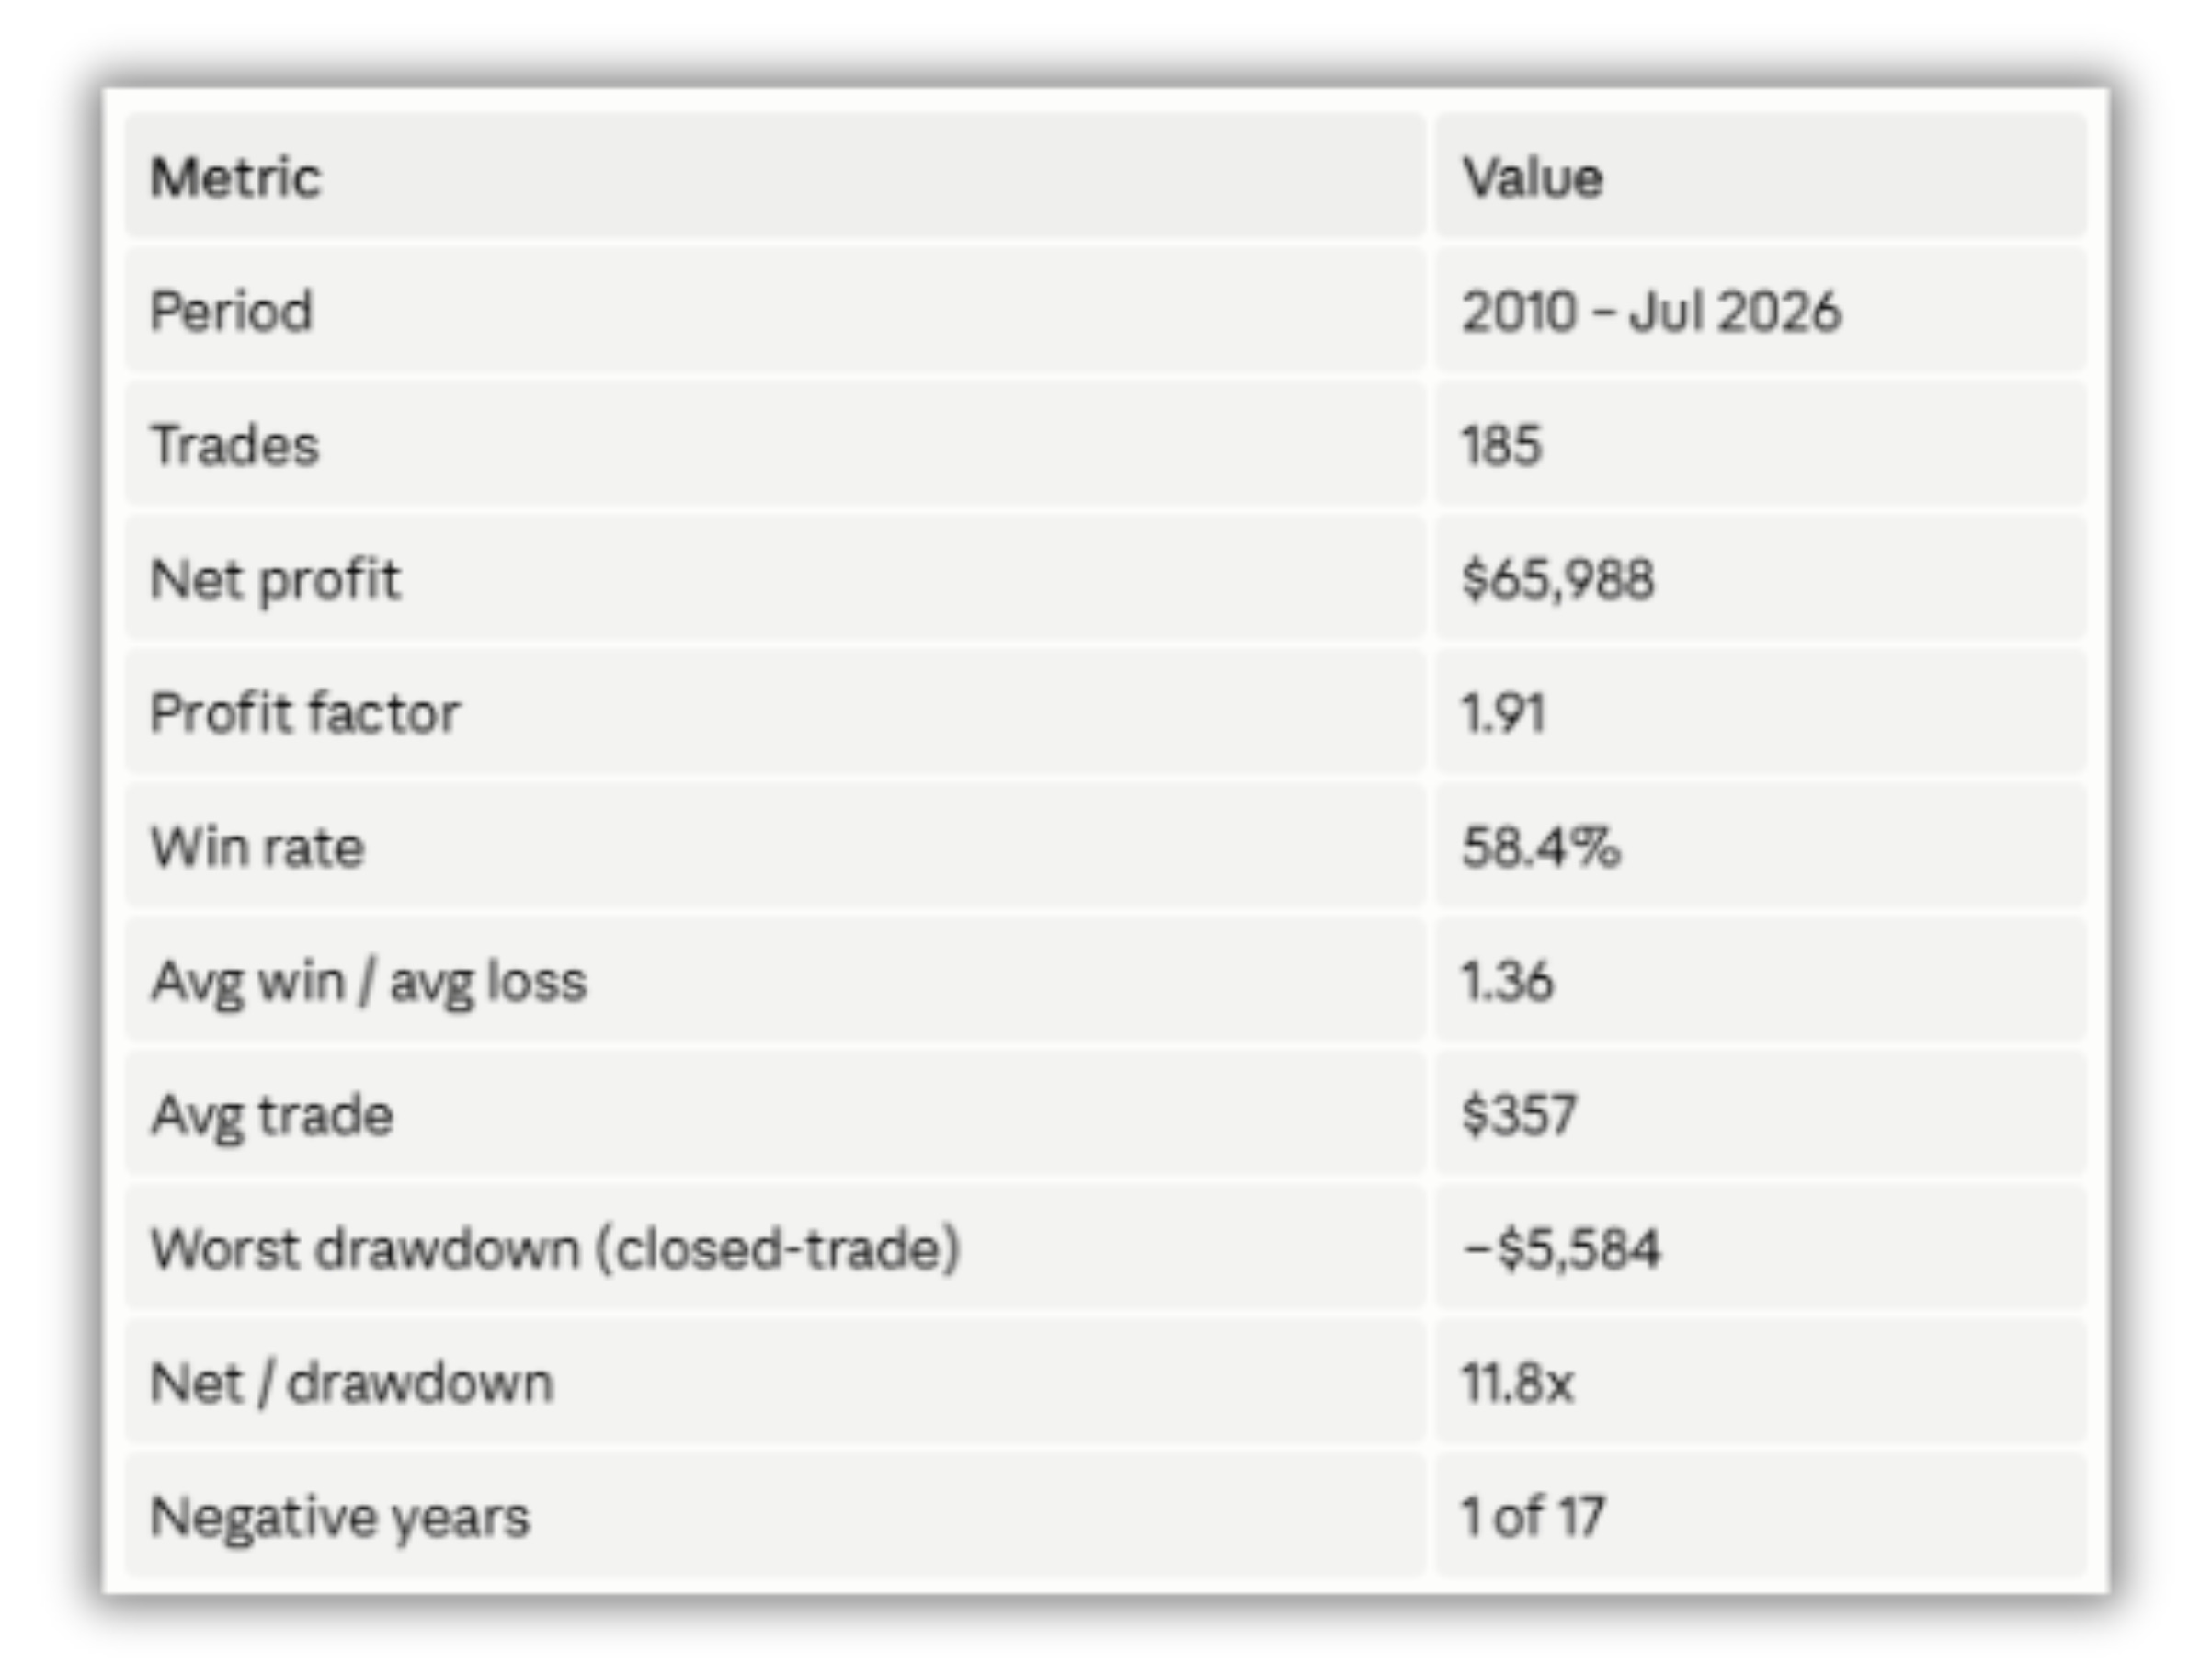
All figures net of costs (slippage and commissions around $70 round trip).

You know I like simple strategies. The fewer signals, the better.
So when you ask me whether three filters together isn’t just curve fitting, I’ll tell you it’s a fair question and I’ll give you my honest position first:
Every backtested strategy is curve-fit to some degree.
But the question worth asking is how much and no backtest can answer that about itself.
Only unseen data can.
So here’s the unseen data.
The system was built on 2010 through 2024 with the standard split of 70% in sample and 30% out of sample.
Everything from January 2025 to today happened after it was frozen: fourteen trades it took on its own, in data that didn’t exist when it was designed.
Those sixteen trades: 75% winners, $11,849 net, average trade more than twice the size of the development window's.
But of course, eighteen months and fourteen trades don’t prove anything. Only live trading, over enough time, proves anything at all.
One more stress check before we get to the rules: the exit schedule is exactly the kind of choice that smells like cherry-picking, so I re-ran the system on every alternative version of it.
All of them made money. The exact numbers are coming up with the rules.
But before that, here’s what I did…
And by my own audit I mean the Validation Module inside the TRQ Portal…
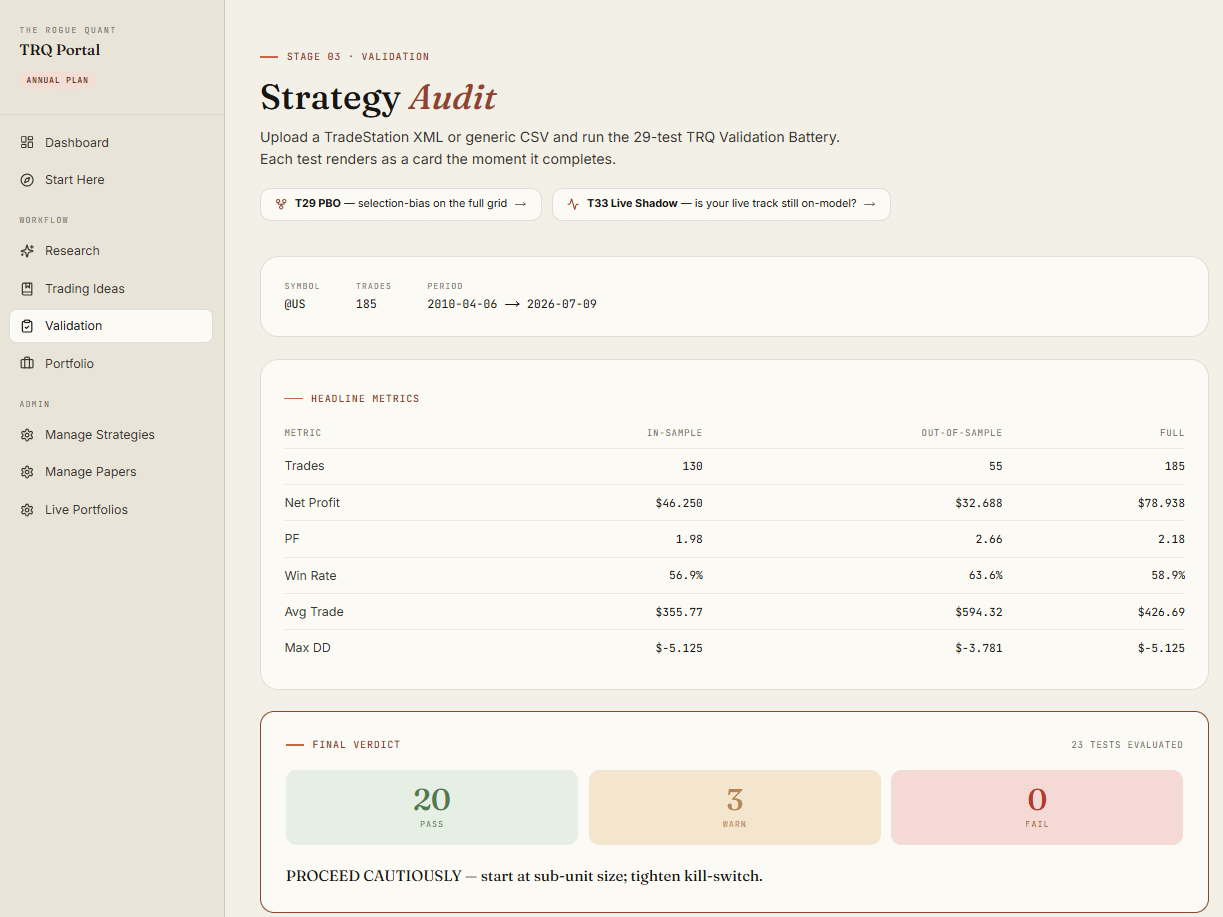
The Strategy Audit works like this: you upload a trade list, and it runs 29 statistical tests that estimate the chances you’re looking at an overfit strategy.
This one came back: 20 tests passed, 3 warnings, zero failures. The tool’s recommendation:
PROCEED CAUTIOUSLY — start at sub-unit size; tighten kill-switch.
Three findings you should know about, because the summary table doesn’t show them:
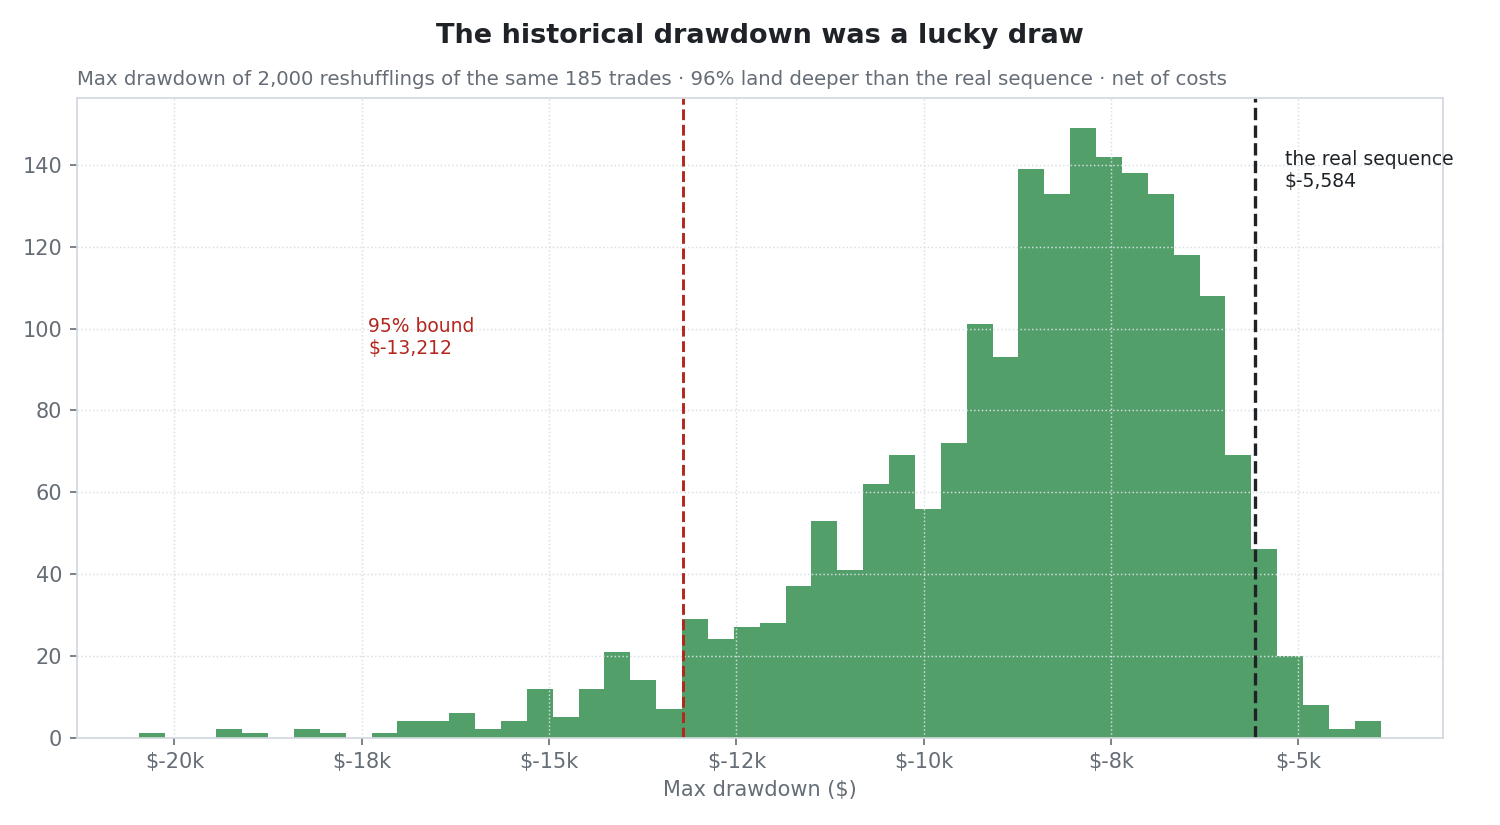
The historical drawdown was lucky. If you reshuffle the same 178 trades two thousand times, 93% of the orderings produce a deeper drawdown than the −$5,566 of the real sequence. The audit’s 95% bound puts the realistic worst case near −$12,400. Size for that number.
The top 5% of trades carry 42% of the profit. That’s common in systems without a profit target. It also means that missing a few of the best trades changes the whole year.
On the positive side: a bootstrap test against pure noise puts the odds that this is a zero-edge strategy at about 1 in 3,000.
Also, here’s the net profit per year…
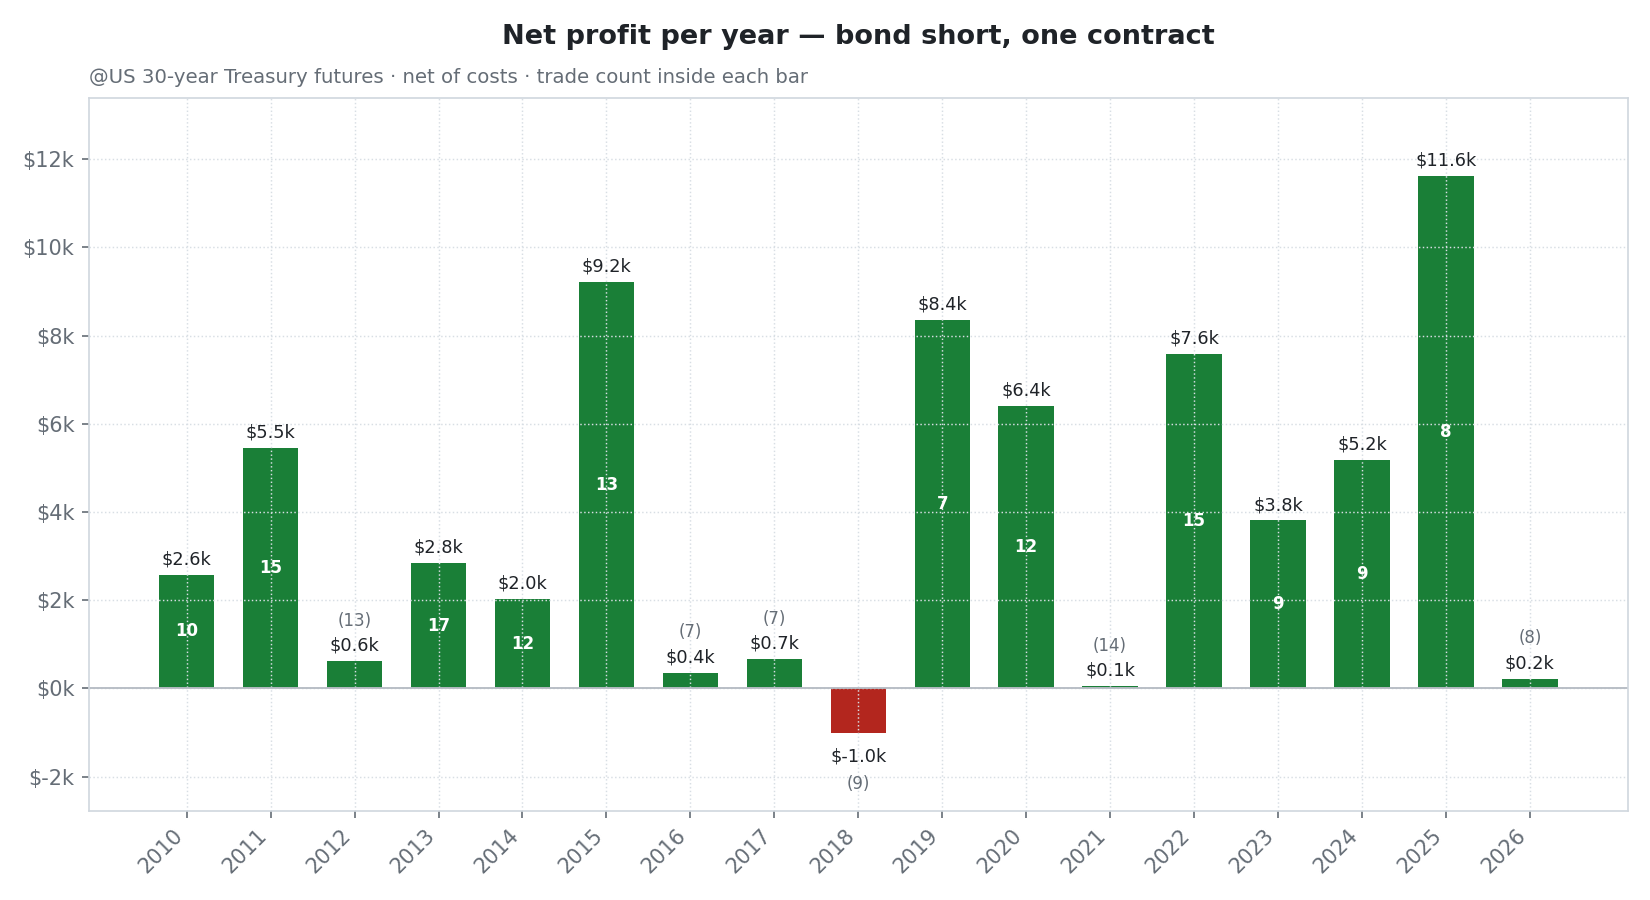
That’s exactly what I’m going to show you now along with the complete strategy code and an issuue I found in the process (and how I fixed it).
Before we dive…
If You’re Not an Annual Subscriber, Here’s What You’re Missing:
362 academic papers, already read and turned into trading rules. Every one has its entry, exit and filters written out in plain English, so you can code it the same afternoon instead of fighting a PDF for three hours. I’ve backtested 100 of them myself, and the real numbers sit next to what the paper claimed — including the ones that fell apart.
48 strategies, 38 of them with the code attached. EasyLanguage files, Python, TradeStation workspaces, and the closed-trade lists behind the results. You import them and run them.
The 29-test Validation Battery. Upload any strategy’s trade list and get back 29 tests on it: cost sensitivity, regime slicing, crisis replay, bootstrap confidence intervals, risk of ruin. When a question genuinely can’t be answered from a trade list, it says so instead of printing a number.
A separate overfitting module. You feed it every variant you tried, not just the winner, and it estimates how often the best one in your grid stops being the best out of sample. That number is usually the difference between a strategy and an expensive coincidence.
COT positioning on 60 markets, updated every Friday. Where Managed Money, Asset Managers and commercial hedgers actually sit, scored against their own last three years — shown next to where price sits, because the same positioning means opposite things at opposite prices.
Seasonal patterns on 30 markets. Daily and monthly windows, each with its hit rate and the number of years standing behind it, so you can separate a real pattern from twelve coin flips.
A portfolio workspace. Drop your strategies in and see correlation, combined drawdown, Monte Carlo, and how many contracts of each to actually run.
The Market Behavior Lab. 28,000 weekly snapshots of how each market has behaved — trending, choppy, mean-reverting — so you stop running a mean-reversion system in a market that trends.
Everything above is updated weekly with the same data I trade on.
I want to access the TRQ Portal
Now let’s get into the details…

Comments
Nothing yet. Say the first thing.
Sign in to join the conversation.