
Last week’s report left two loose ends:
Crude, where I admitted the positioning extreme was real and I’d been too slow to trust it.
And silver, the most bullish positioning on the board (falling anyway)
You can read it here:
This week both moved.
Crude added another 10.6% and closed Friday at $90.47, up 27% in twenty sessions.
Silver finally turned green.
And the first real change since the crude run began is that physical players’ book stopped growing.
The setup that carried this rally is different now, and the details matter more than the headline.
Let’s dive in…
The CFTC report covers positioning through Tuesday, July 21. Price returns run through Friday, July 24.
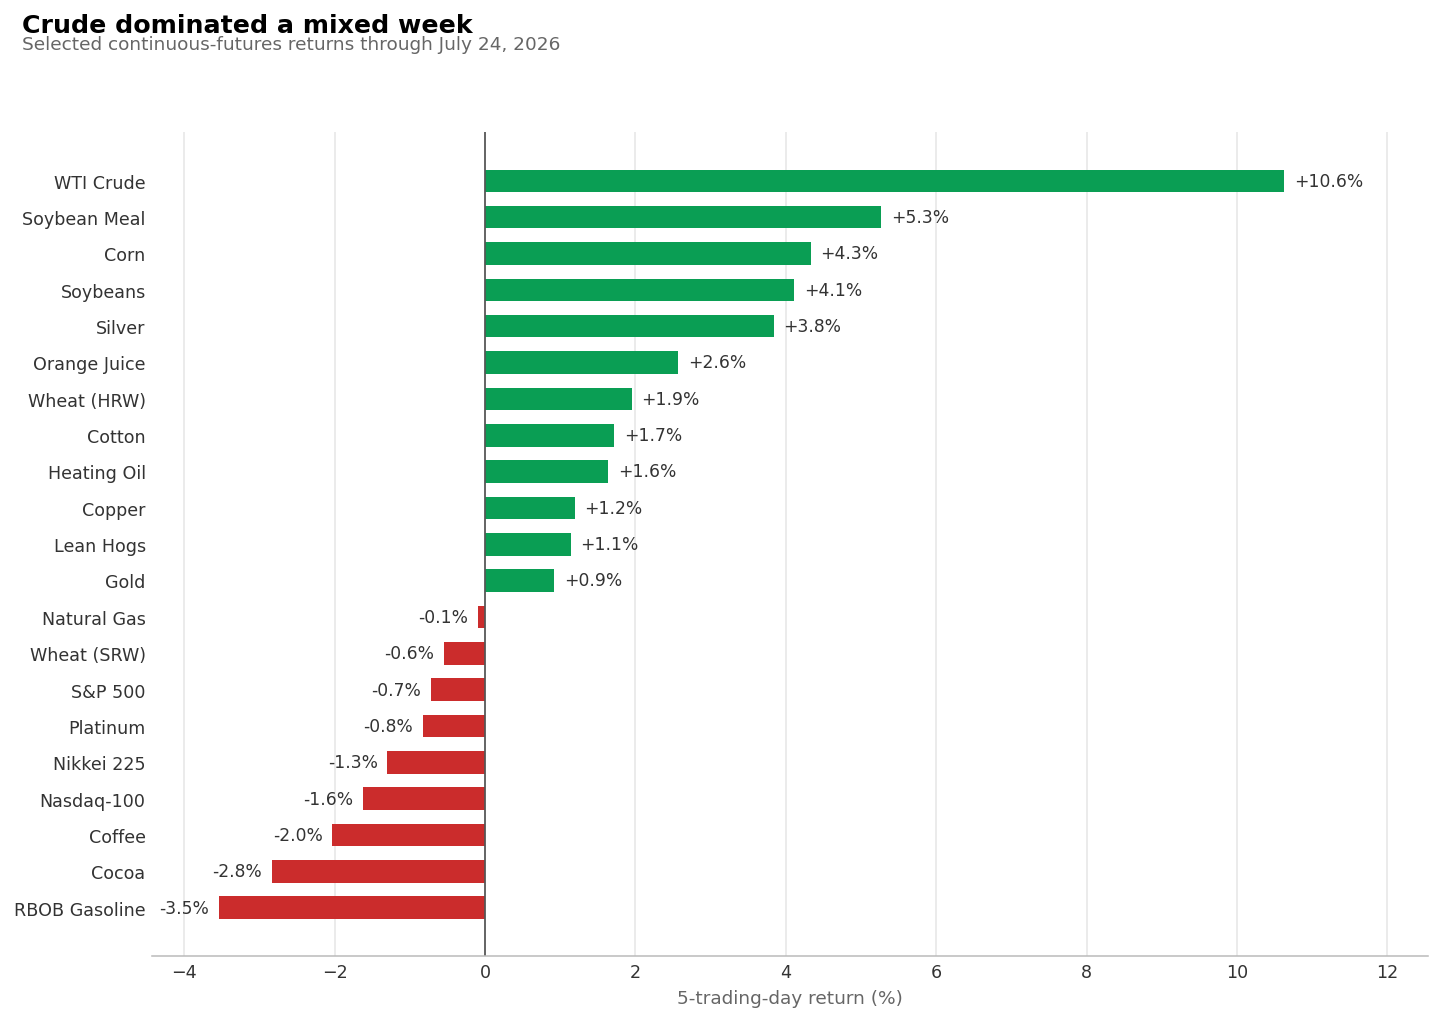
Crude was the outlier.
Behind it, the grains firmed up (soybean meal +5.3%, corn +4.3%, soybeans +4.1%) and silver caught a bid at +3.8%.
On the red side, gasoline fell 3.5% while crude ran, the Nasdaq slipped 1.6%, and the Nikkei 1.3%.
A mixed board with one exceptional move.
Two groups appear in this week’s charts, and they come from two different CFTC reports.
The crude and silver charts show the Producer/Merchant/Processor/User category (the physical players who pump, refine, mine, or use the actual commodity)
The dollar and Treasury charts show Asset Managers (pensions, insurers, sovereign wealth funds. I call them real money)
And btw, if you want to learn how to turn this data into actual trading systems (rules, backtests, code etc) I’ve published two strategies built on CoT positioning:
and a bond short driven by positioning from a completely different market:
The sequence so far. The physical players’ net long in crude was already near a three-year high in mid-June.
It set a fresh record on July 7, another on July 14 at 411,516 contracts, and price confirmed with the biggest four-week run on the board.
This week, for the first time, the book moved the other way: net long down 14,535 contracts, to 396,981.
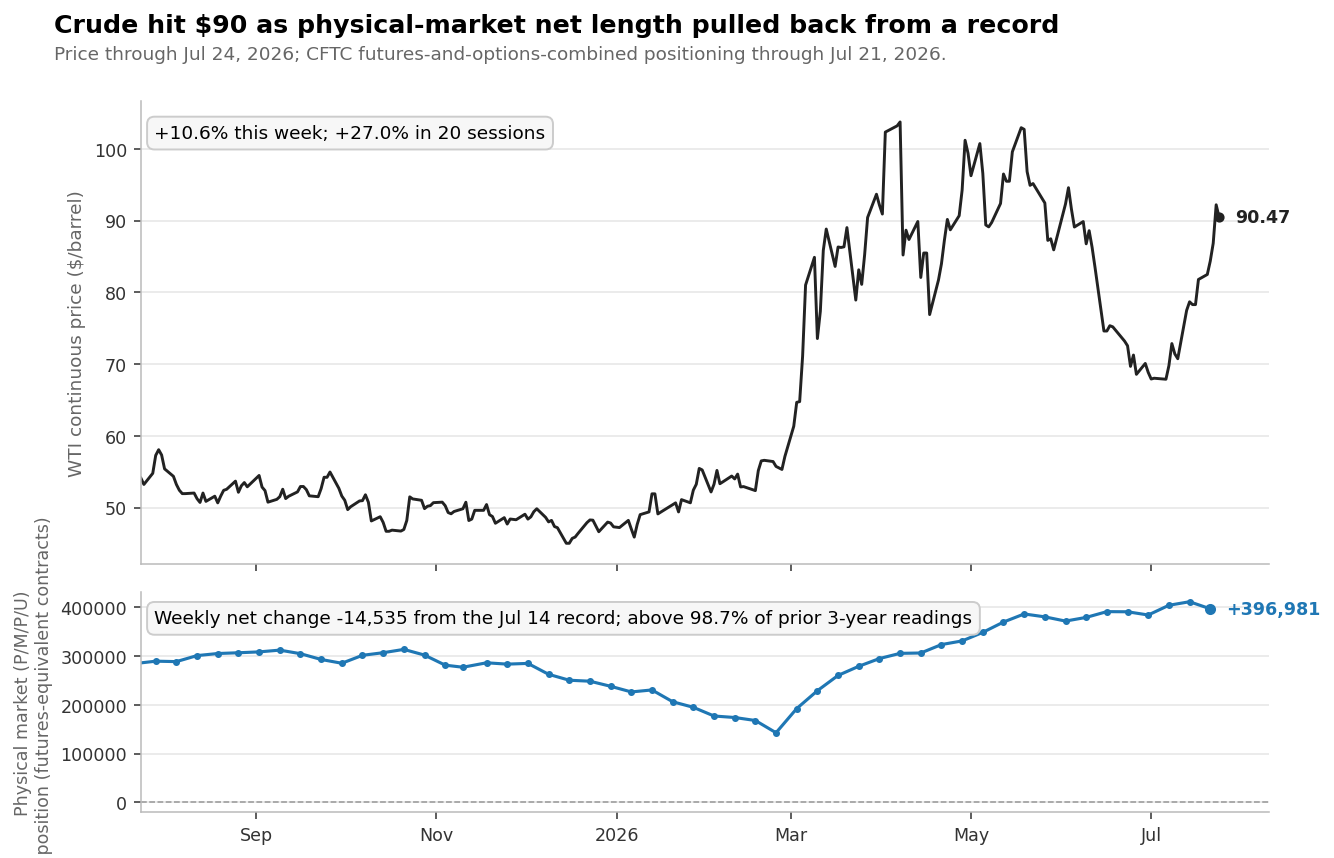
You can see longs shrank by about 31,000 contracts. Shorts also shrank, by around 16,000.
The book got smaller on both sides. That’s thinner participation at $85+, and the data can’t tell you who sold or why.
What it can tell you: the position that fueled this rally is still enormous, larger than all but a handful of weeks in the past three years, but it stopped growing. The signal softened I’d say,
One more thing to keep in view. The positioning snapshot stops on Tuesday, when crude closed at $84.34. The last six dollars of this move happened after the photo was taken.
And the products did not confirm: gasoline fell 3.5% while crude gained 10.6%, heating oil added just 1.6%, natural gas sat flat. When the barrel runs and the products don’t follow, one of them is wrong or there are other variables that we can’t see right now and it will be obvious in hindsight.
For three weeks silver has been my honest counterexample: the most bullish physical-player posture on the board, falling anyway.
This week it finally turned green. Up 3.8%.
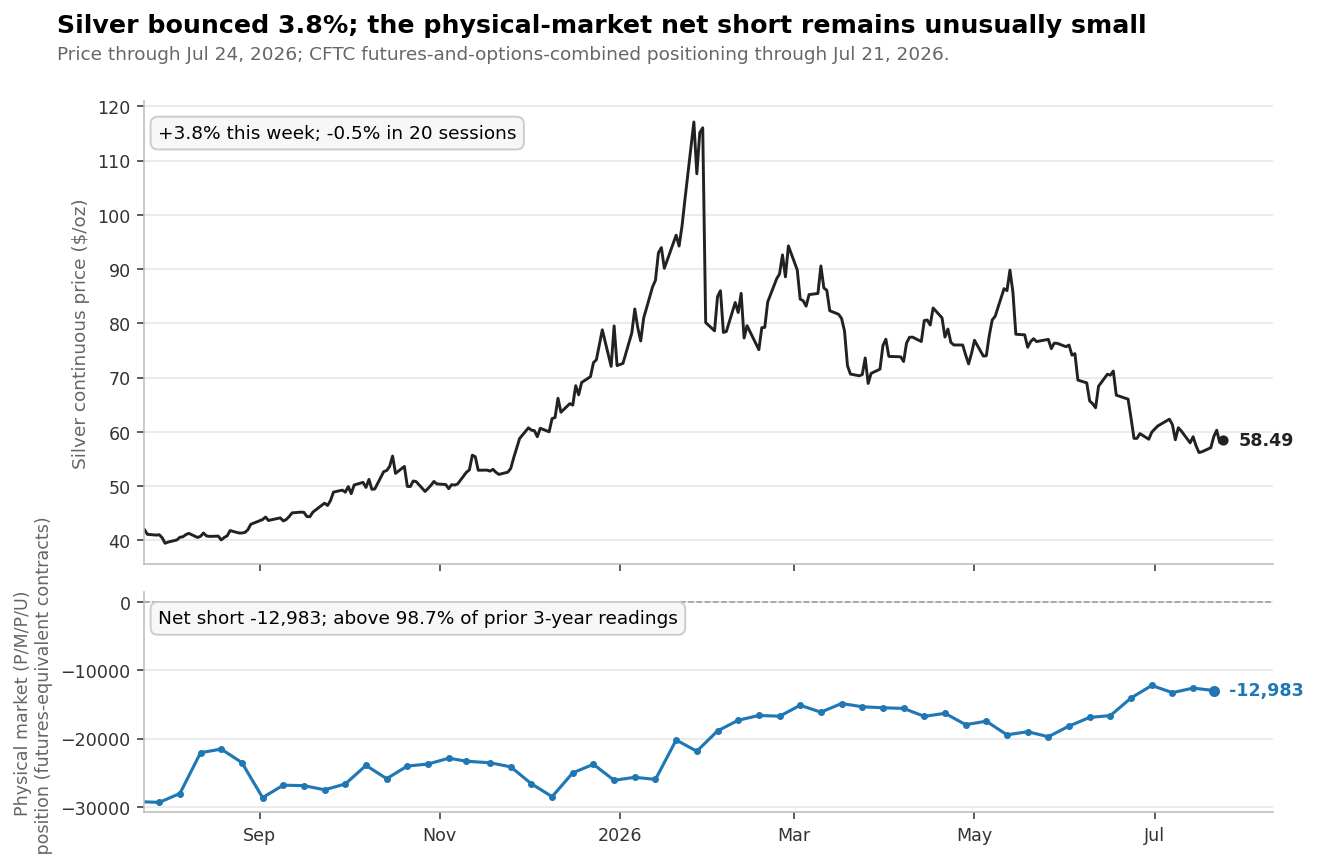
The positioning side barely moved.
The producers’ short book is still one of the smallest of the past three years, essentially unchanged this week. The tell held its ground; price took a first step toward agreeing with it.
What about the dollar, my standing explanation for silver’s weakness?
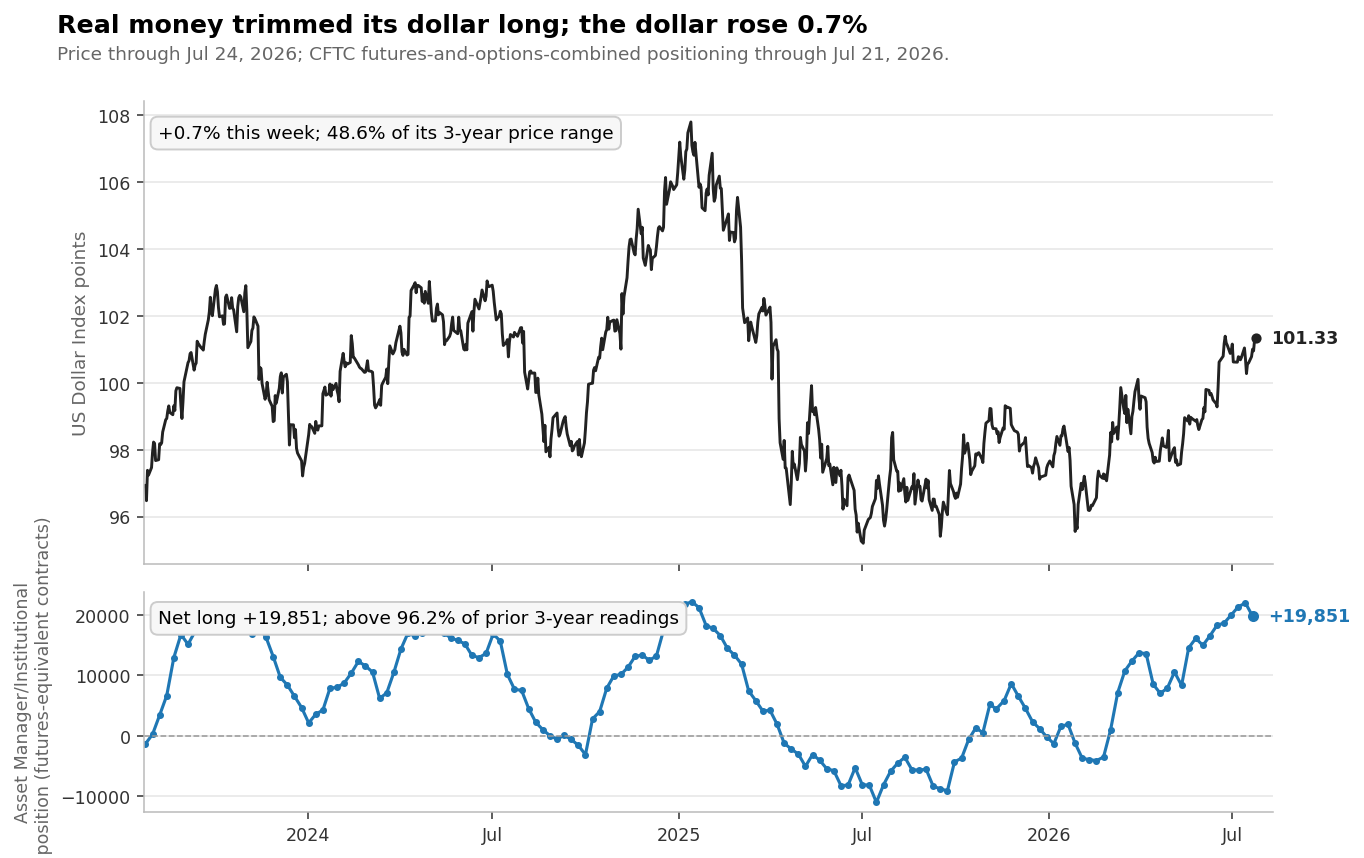
Real money trimmed its dollar long slightly, still one of its biggest dollar bets in three years. But the dollar itself rose 0.7% this week and sits around the middle of its three-year price range. So silver bounced despite a firm dollar, and the stretched part of that chart remains the positioning, its price is going nowhere.
One green week is evidence, and that’s all it is. Two or three would start to look like confirmation.
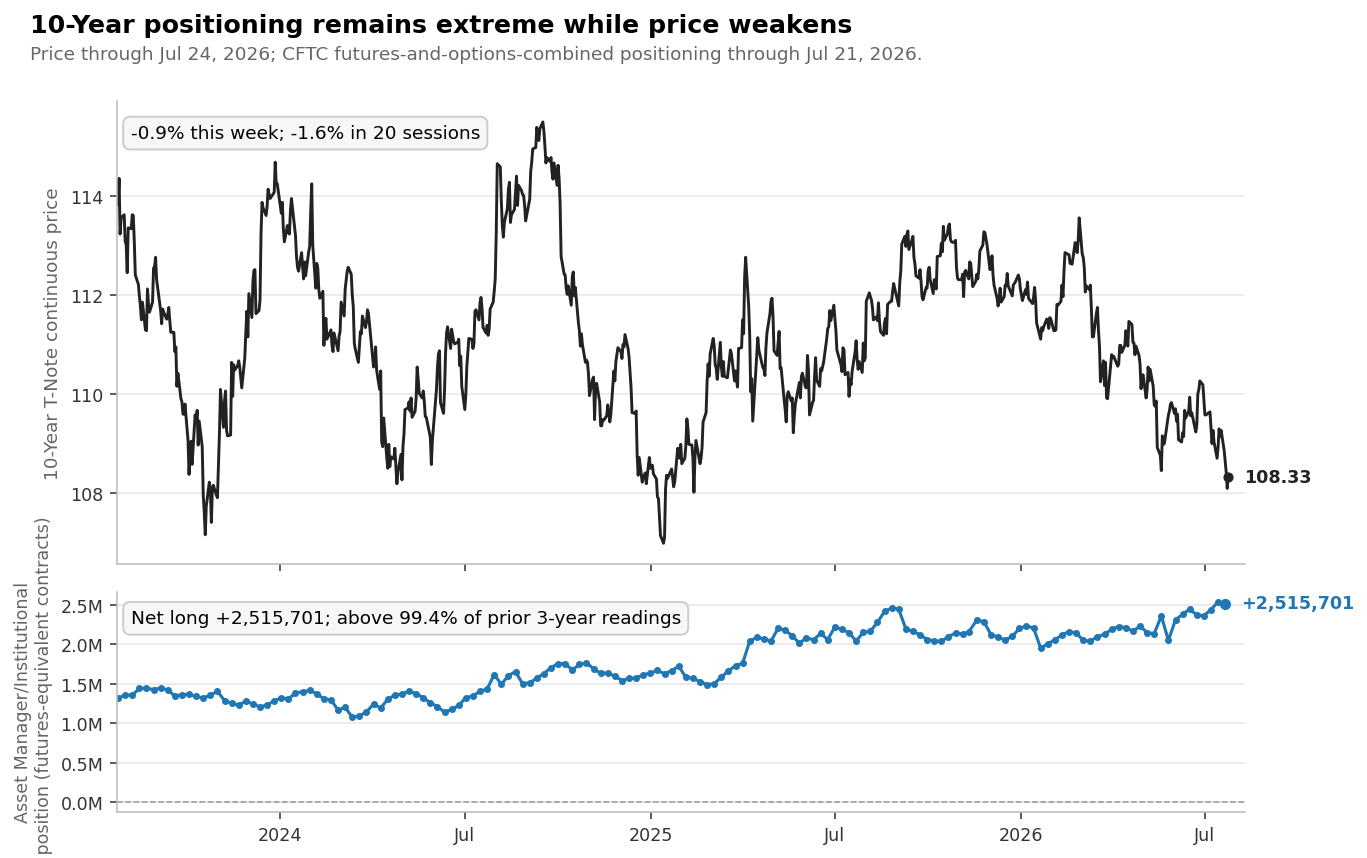
Real money’s net long in the 10-Year Treasury set a three-year record last week. This week it trimmed slightly.
Still within a whisker of that record, still the largest conviction position on the board.
Price keeps moving against it. The 10-Year future fell 0.9% this week and 1.6% over twenty sessions.
The 30-year short sits near the middle of its own three-year range. One side of this trade it seems stretched. The other is kind of ordinary.
So the defensible read is simpler (I guess) and, honestly, more uncomfortable: the biggest positioning extreme on the board keeps growing stale, pinned near its record while price leaks the other way.
Corn +4.3%, soybeans +4.1%, soybean meal +5.3% this week. And behind the prices, the speculative money added hard for a second consecutive report: roughly +50,000 contracts in corn, +52,000 in soybeans, +27,000 in meal.
That’s a real cluster, and it’s worth watching on its own terms.
I’m resisting the urge to stitch it together with the Nasdaq short and the bond positioning into one grand macro narrative…
A cluster is a cluster. A story is something the next few reports either write or erase.
Three markets, three phases of the same signal.
Crude ran the full sequence: extreme, price confirmation, and now the first shrink in the book after the record.
Silver is a phase behind: the extreme finally got its first week of price confirmation.
The 10-Year is stuck at the start: the extreme keeps standing while price refuses to cooperate.
This report covers the markets that made the week’s noise.
The same positioning picture for every market I track (all ~50 of them, full history behind each chart, updated weekly) lives on the members portal and you can access it here:
What I’m watching next week:
Crude’s next print. A second week of the book shrinking while price holds $85+ would say far more than this first one.
Gasoline versus crude. The barrel ran 10.6% and the pump product fell 3.5%. That gap closes or it widens, either answer is information.
Silver’s follow-through. The tell has been right in direction and wrong in timing for a month. Week two decides which one this was.
The 10-Year crowd. Near-record long, price leaking against it. Stale extremes are the ones that move markets when they finally break.
The grains. A third consecutive week of speculative buying would make this cluster hard to ignore.
Let’s see….
Talk soon,
— Leo
The Rogue Quant
Data: CFTC Commitments of Traders, through July 21, 2026. Price action through Friday close, July 24. Positioning compared against a rolling three-year window.
DISCLAIMER: This information is provided for educational and informational purposes only. It is not financial advice, nor a recommendation to buy or sell any securities or financial instruments. Trading involves substantial risk and is not suitable for every investor. You are solely responsible for your own investment decisions and should seek advice from a licensed financial advisor before acting on any information provided in this article. The author(s) and publisher disclaim all liability for any loss or damage arising directly or indirectly from the use of this information. Research commentary, not investment advice. CoT data describes aggregated positioning, not trader intent or predictions. Use this information at your own risk.
Comments
Nothing yet. Say the first thing.
Sign in to join the conversation.