
Last week I wrote that the physical players selling the cocoa rally meant the easy part of that move was over.
You can read it here:
Cocoa fell 8.8% this week.
I also wrote that crude’s positioning extreme looked real, but I wanted one more report before trusting it.
Crude jumped 15.6%. The market graded my homework before I finished it.
And silver carrying the most bullish positioning picture on the whole board fell another 6.4%.
So here’s the scorecard: where the signal helped, where I was late, and where the clean story breaks.
All three matter. The third one most of all.
Before we dive in, I got some questions about this weekly report…
The thing is I write this report for myself first.
Going through every market and its positioning once a week keeps the macro picture fresh. And reading the CoT is one of my sources of ideas for systematic strategies.
Simple as that.
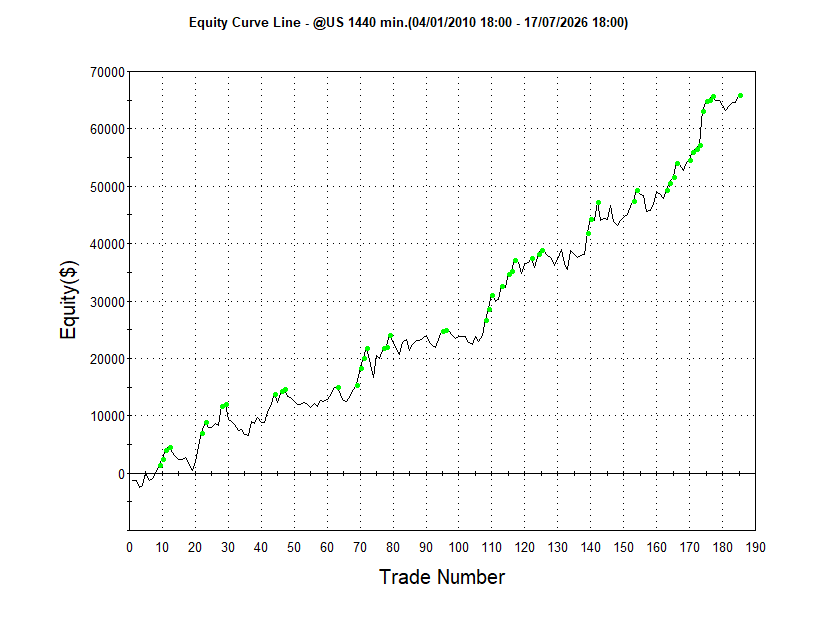
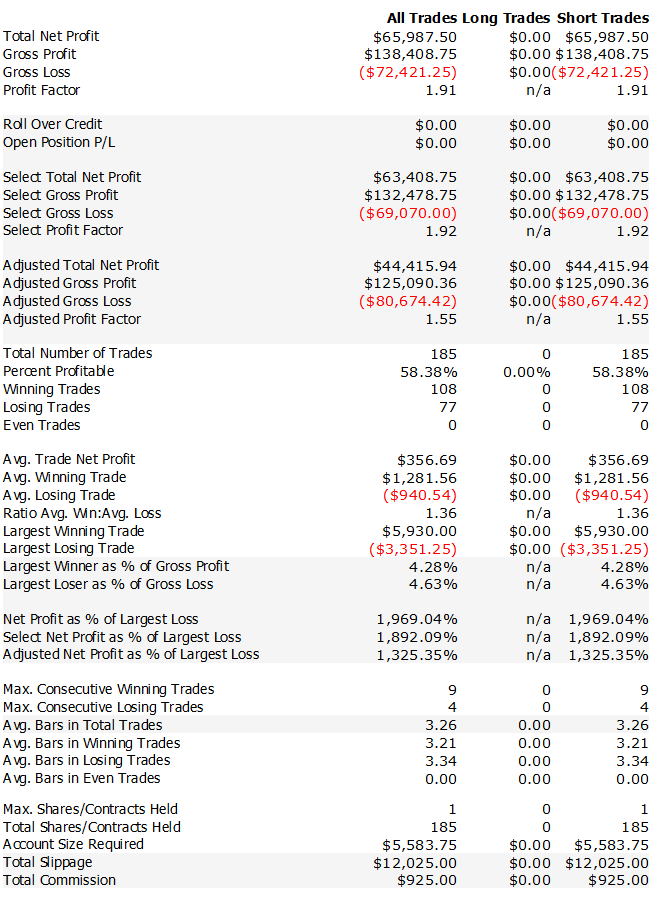
By the way, this Sunday I’m publishing one of them: a system that has been shorting Treasury bonds since 2010 with 185 trades, 58% winners, profit factor 1.91 after slippage and commissions off a signal that doesn’t come from the bond market at all.
This is the equity curve:
And here some stats…
Keep an eye on your inbox this Sunday for the full strategy (code included).
Now, back to this week's report.
Let's dive in…
The CFTC report covers positioning through Tuesday, July 14. Price returns use completed daily bars through Friday, July 17.
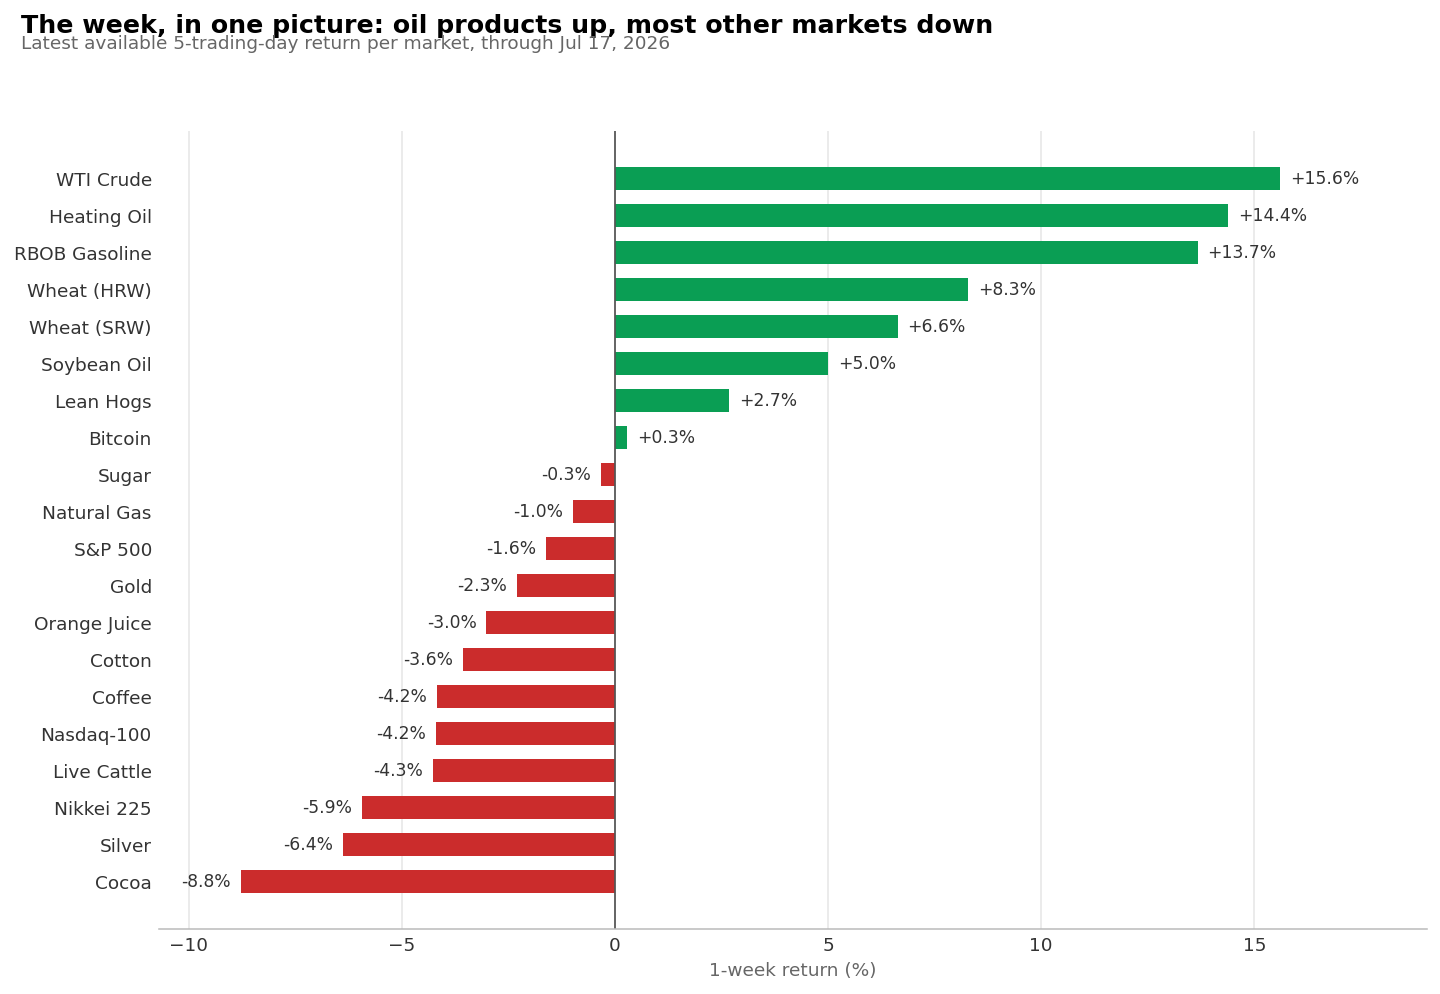
The petroleum complex ran the table: WTI +15.6%, heating oil +14.4%, gasoline +13.7%. Wheat joined it — HRW +8.3%, SRW +6.6%.
Almost everything else bled: cocoa −8.8%, silver −6.4%, the Nikkei −5.9%, the Nasdaq −4.2%.
One honest footnote on that green column: natural gas fell 1%. This was an oil-products week, and oil specifically.
Every positioning chart below shows the same group: the CFTC’s Producer/Merchant/Processor/User category — the people who grow, ship, refine, or roast the actual product.
I’ll call them the physical players.
One caveat, once, so I don’t have to hedge every sentence: their net position is the sum of many firms hedging many different things.
It shows where their book is leaning.
It doesn’t show anyone’s motive, entry price, or profit. Keep that in mind as you read.
From June 16 to July 9, cocoa rallied 52.5%.
Into that run, the physical players kept adding forward sales, their net position went from short 19,719 contracts to short 24,460 by July 7. Selling into strength, week after week, while price stretched.
Then the floor gave out: −8.8% this week.
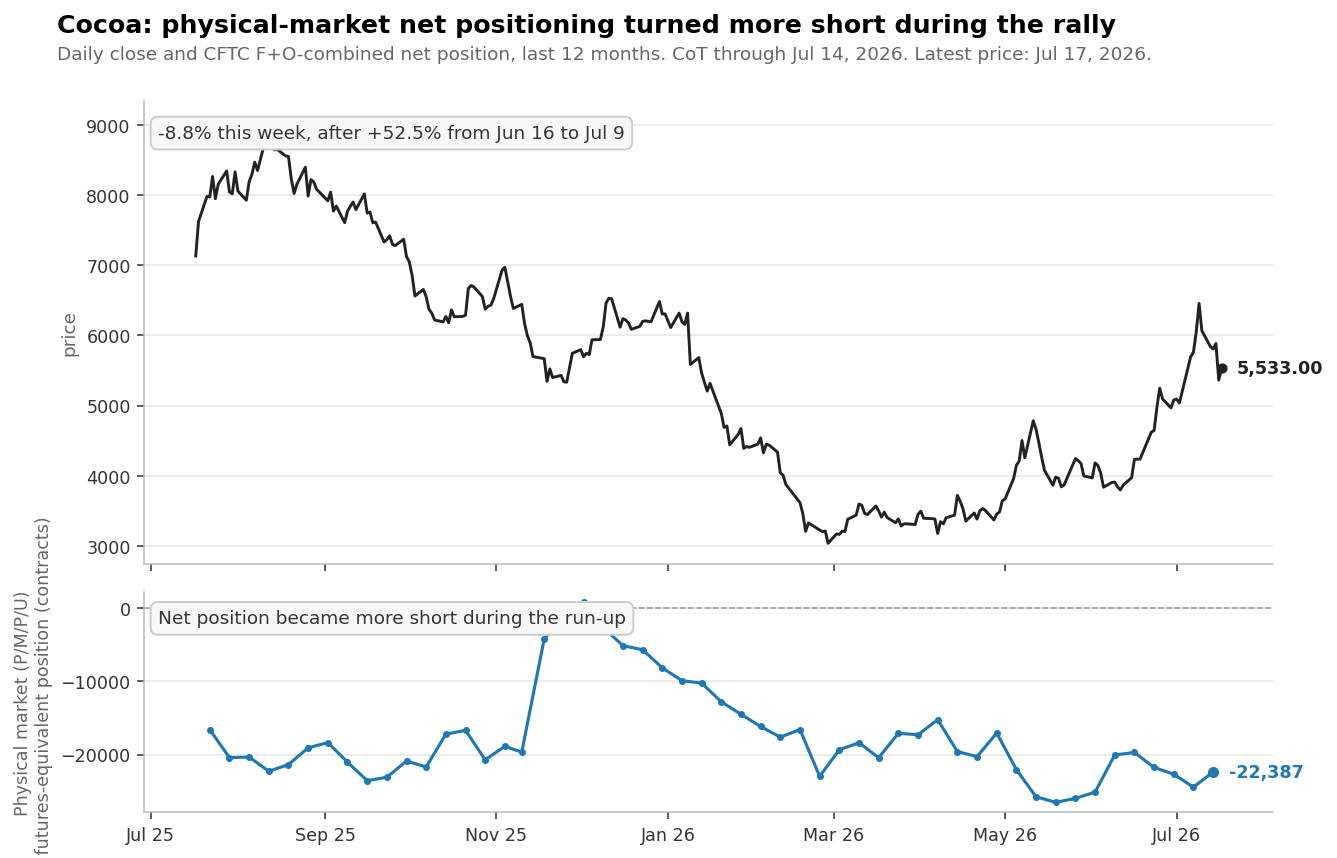
Now the part a victory lap would skip: this was never an extreme reading.
Cocoa’s positioning sat near the middle of its three-year range the whole time.
The signal was the direction of the selling into a vertical move, and it was enough but it was a lean, a moderate one.
Coffee ran a quieter version of the same script: down 4.2% this week after the physical players spent four weeks reducing exposure. Most of that reduction came from longs stepping away rather than new short selling.
Same net effect, softer mechanics.
Crude was a different animal, and I underplayed it.
In crude, the physical category includes refiners and end users who buy forward, so the group runs net long. That net long hit 404,241 contracts on July 7 (already the largest of the past three years) and grew again this week to 411,516.
A fresh three-year high, set while price was still chopping around $70.
WTI rose 15.6%.
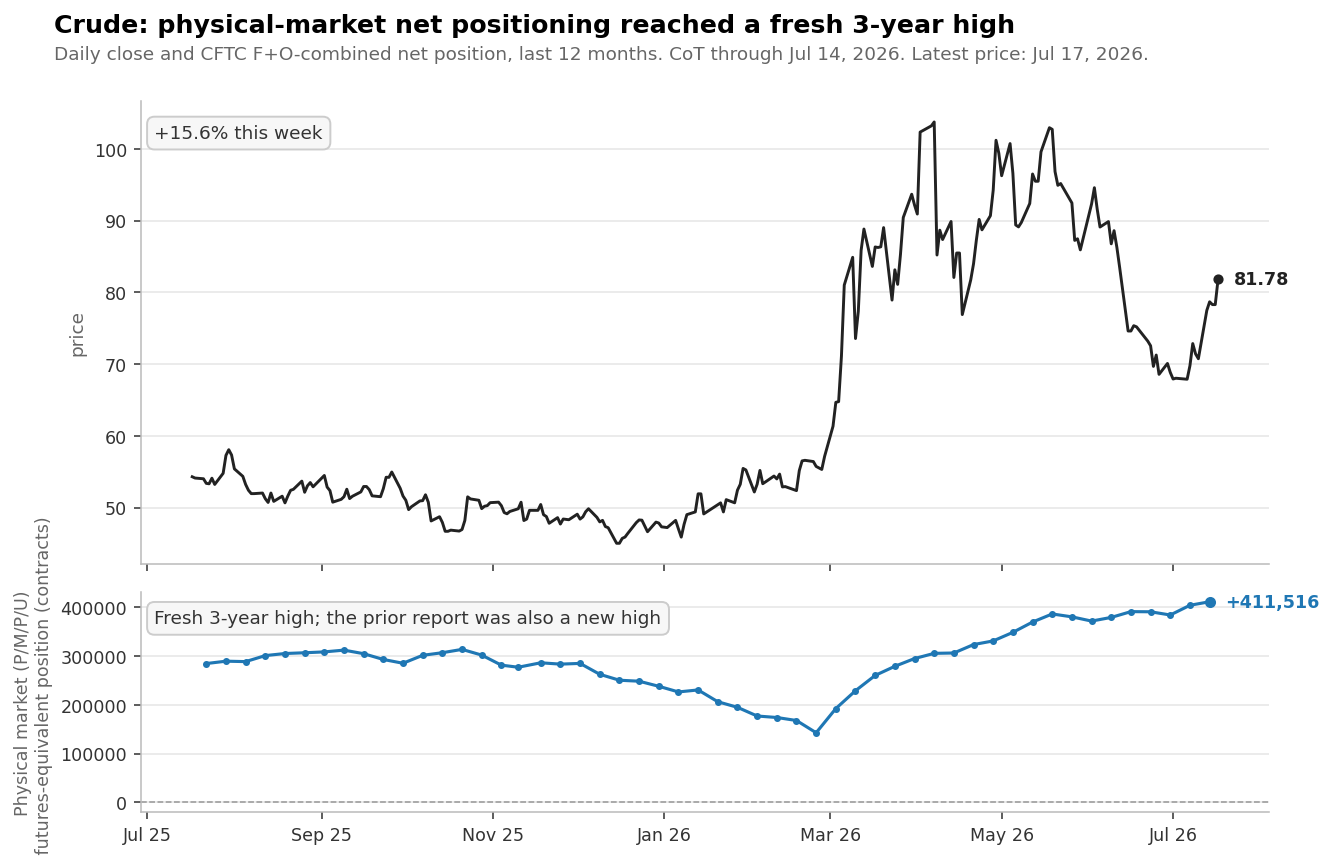
Heating oil and gasoline came with it, both up around 14%. Natural gas sat it out, down 1%, this was an oil move specifically.
The honest part: last week I looked at this exact chart and asked for one more report of confirmation.
The positioning marked a genuine extreme. Price moved before I was willing to act on it.
Cocoa was a moderate lean that worked; crude was a real extreme that worked faster than my caution, it seems you can’t win always :)
Here’s the one that breaks the pattern, and it’s the most instructive chart of the week.
Silver’s physical players hedge by selling forward, so their book normally runs short. That short book is now down to 12,630 contracts, smaller than almost any week in the past three years.
Over the past month they added longs and cut shorts. By the cocoa-and-crude logic, this is the most bullish posture on the board.
Silver fell 6.4% this week. It’s down 20.9% in four weeks.
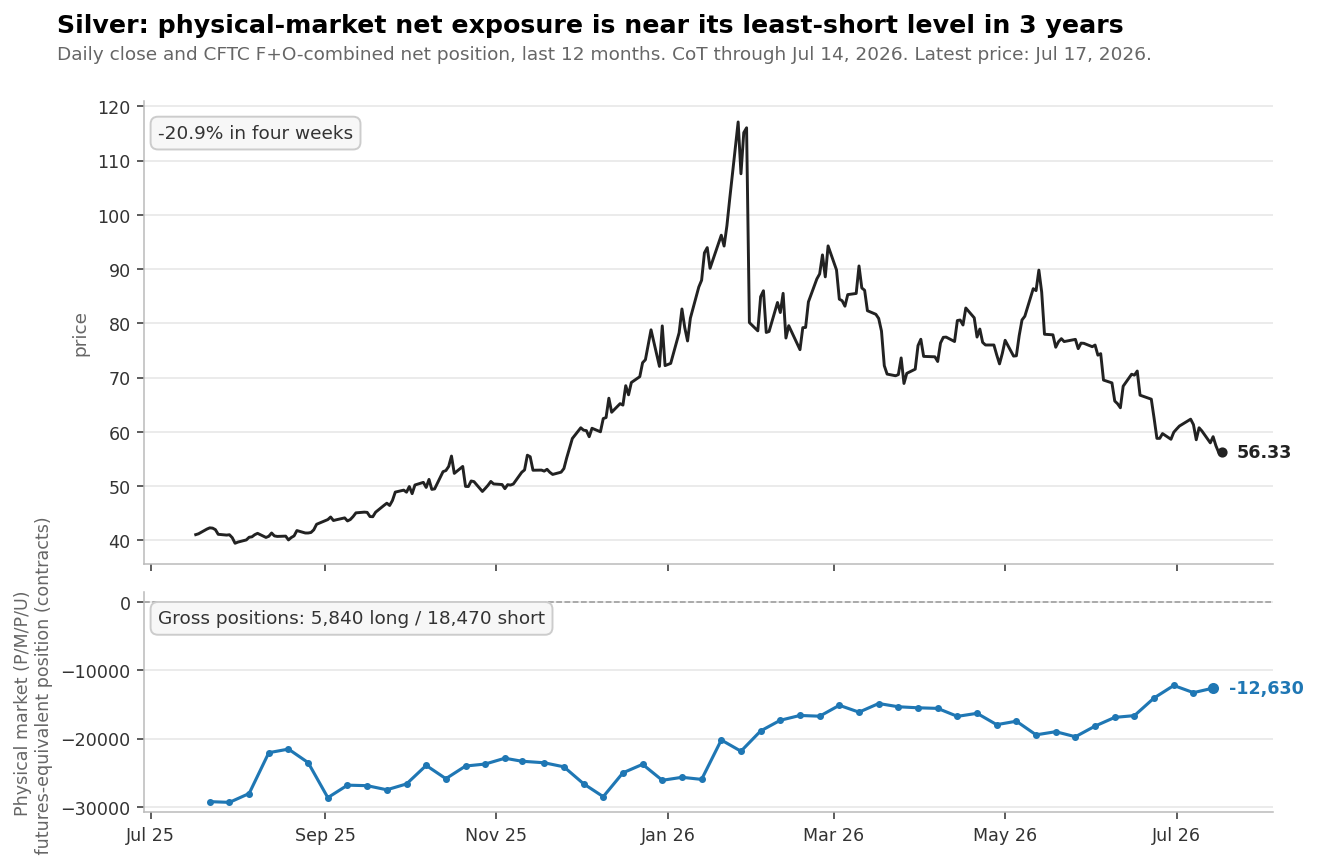
The tempting explanation is the dollar and I need to be more careful with it than I was last week.
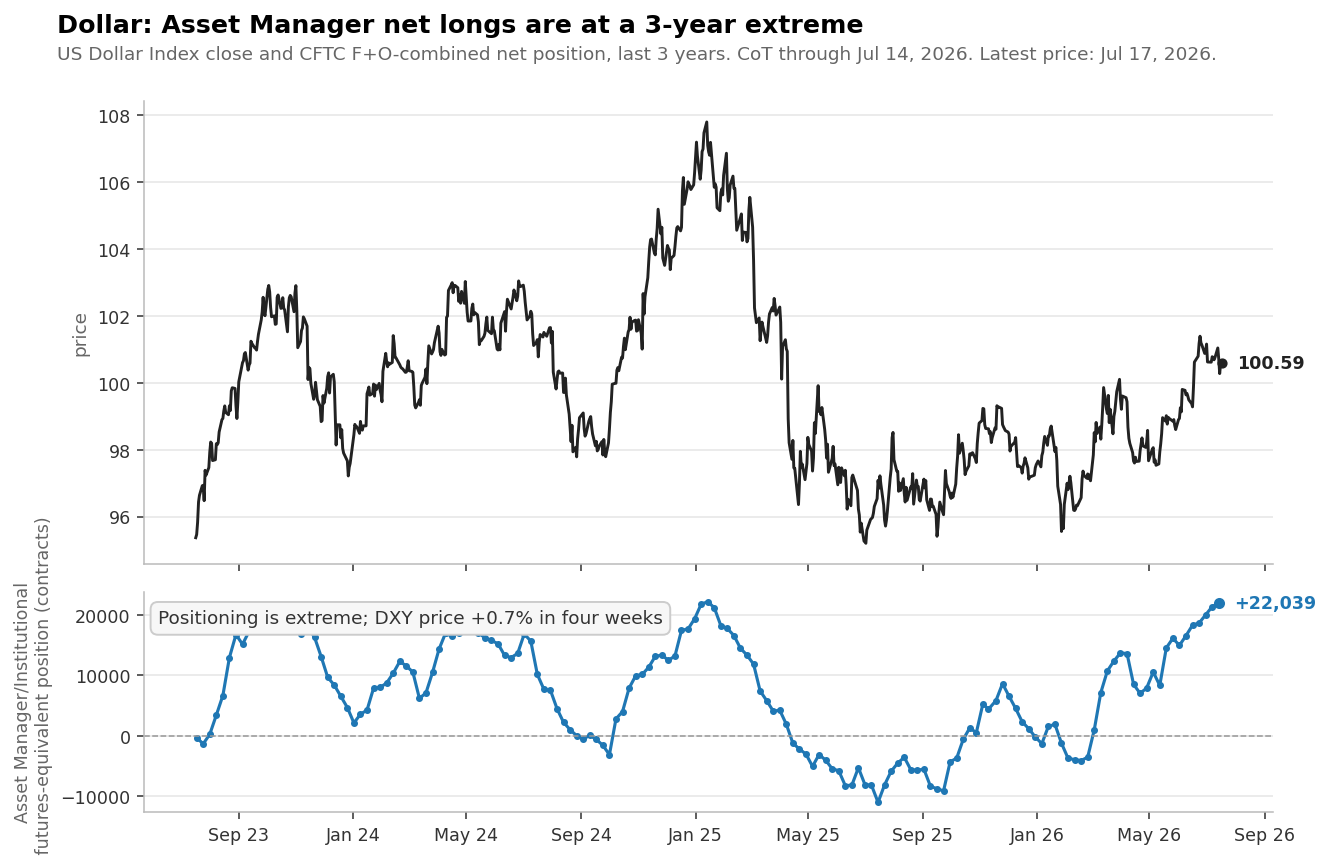
Real money (Asset Managers: pensions, insurers, sovereign wealth funds) holds a dollar long of 22,039 contracts, a whisker below its three-year high.
That’s a real, standing headwind for metals.
But look at the price panel: the Dollar Index fell 0.2% this week and is up less than 1% on the month. The dollar’s positioning is stretched; its price barely moved. It cannot explain this week’s silver drop by itself.
So the honest reading is probably: the physical players are positioned for a silver recovery, the dollar is a plausible reason to wait, and price is answering to something the positioning data doesn’t capture.
Gold and platinum show the same tension.
That’s silver’s job in this report. It stops one win in cocoa and one win in crude from becoming a law of nature.
Three weeks ago I flagged hedge funds walking out of the Nasdaq while real money bought their shares. That argument now has a running score.
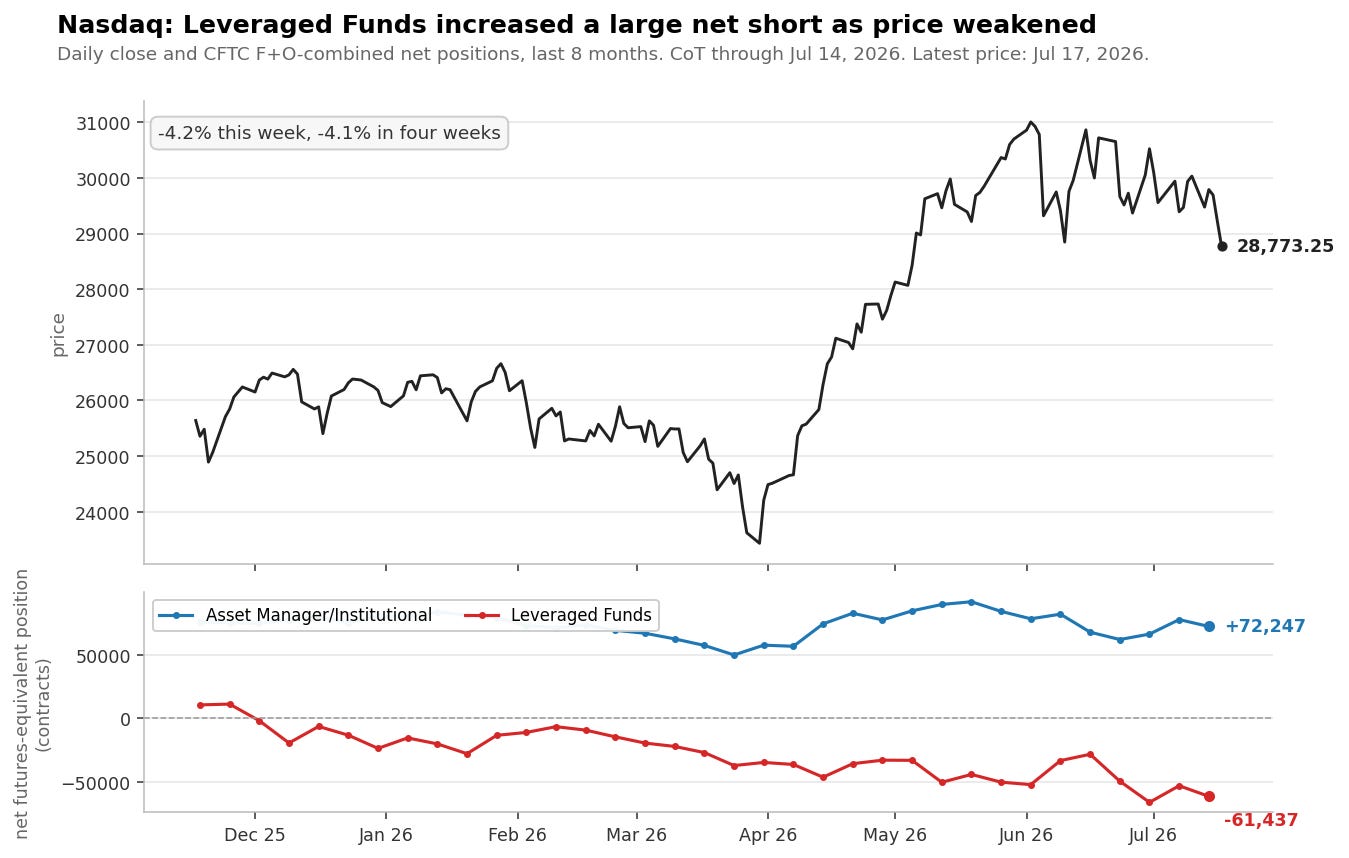
Hedge funds (Leveraged Money) added 8,363 contracts to their Nasdaq short this week and now sit net short 61,437, one of their biggest short bets of the past three years.
Real money is still net long but trimmed again. The Nasdaq fell 4.2%.
The volatility book tells the same risk-off story:
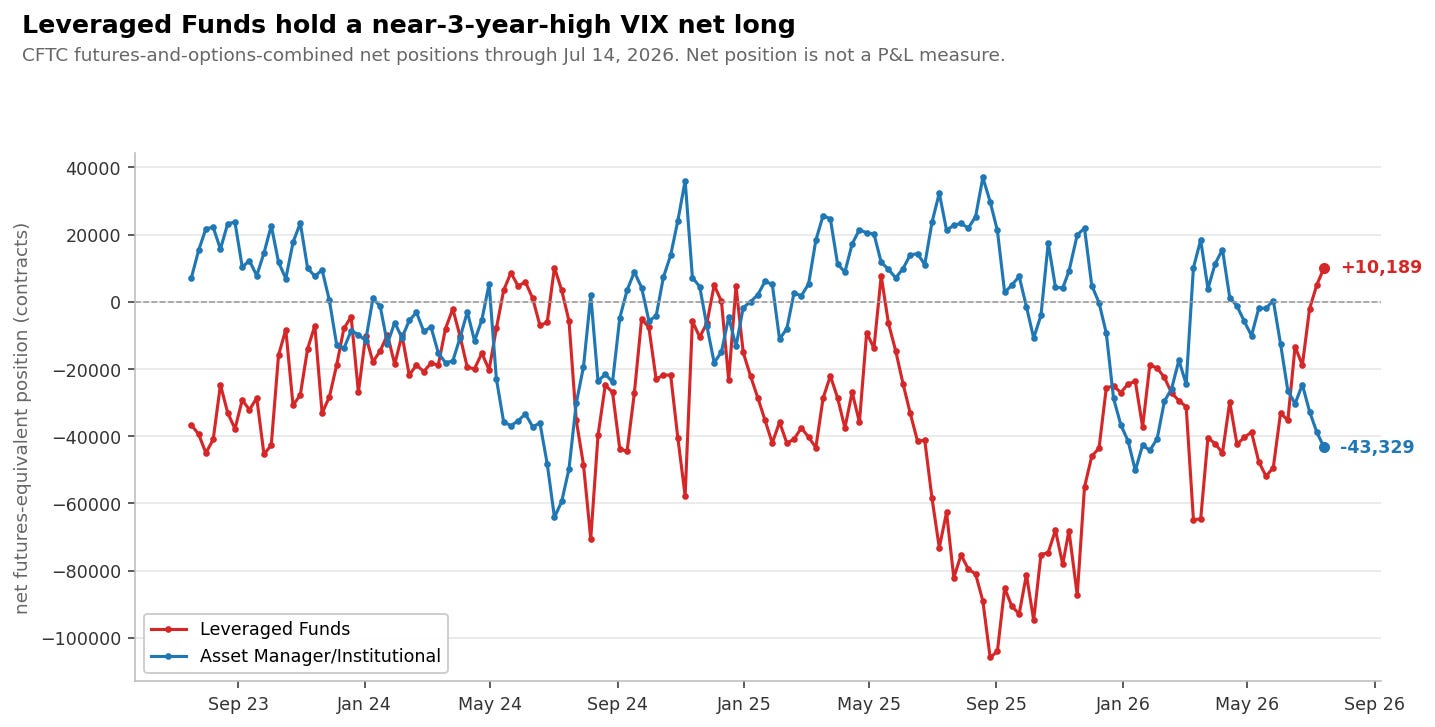
Hedge funds flipped from short volatility to long over five reports and now hold 10,189 contracts of VIX length, a hair below their three-year record.
Real money sits on the other side with one of its biggest short-vol books in three years.
The selloff came, and so far the insurance buyers are the ones collecting.
The sharpest new positioning move of the week.
Wheat rallied 6.6%. Into that rally, the physical players’ net position swung 30,324 contracts toward short in a single week from nearly flat to short 37,499.
And this one was genuine new selling: gross shorts rose by 32,912 contracts while longs barely moved.
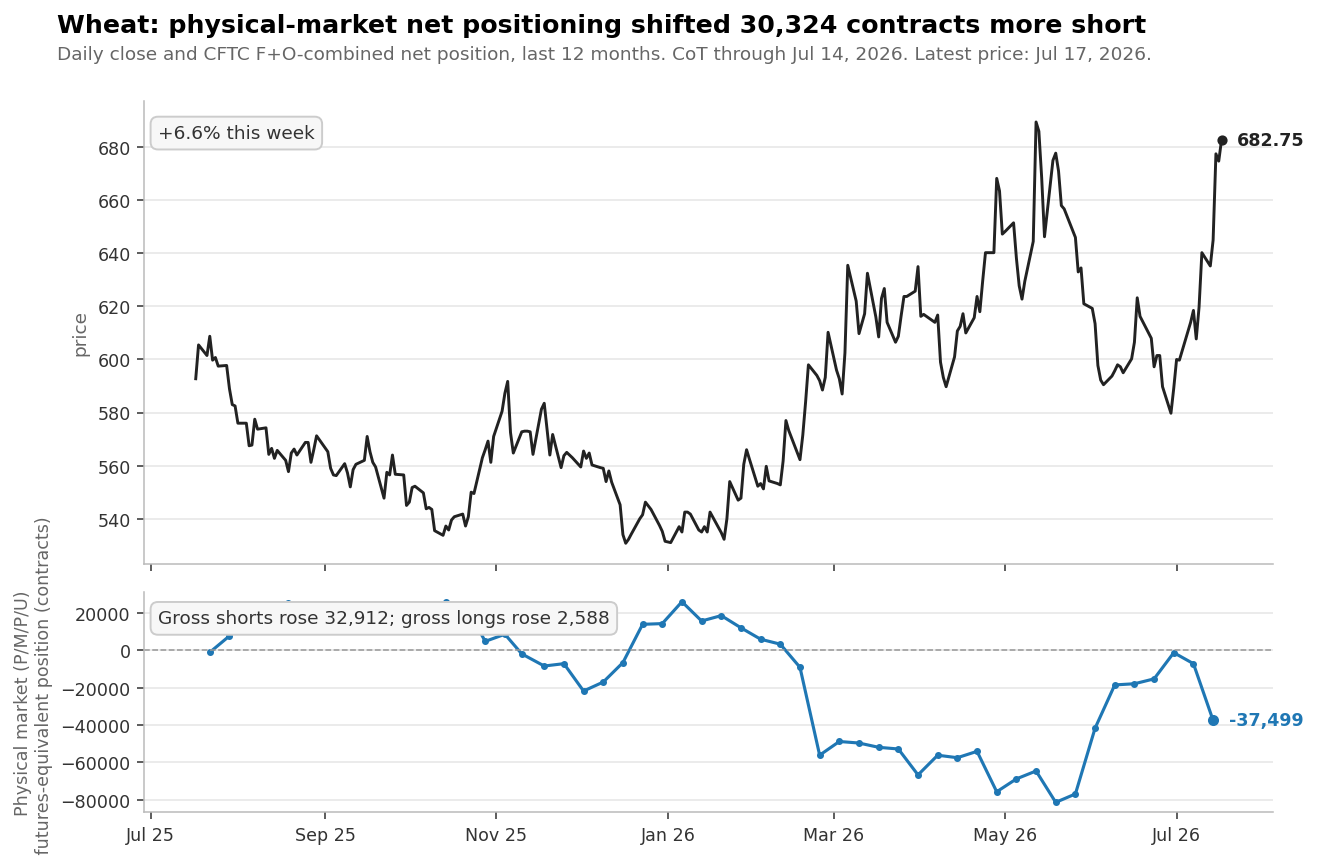
That is the cocoa pattern, compressed into one week.
It doesn’t mean wheat tops tomorrow. It means the people with grain in their silos think these prices are worth locking in.
One caveat in plain language: the positioning snapshot ends Tuesday and the rally ran through Friday, so part of that selling happened during the move, not ahead of it.
If gross shorts keep building while price stalls, the warning strengthens. If wheat absorbs the selling and keeps climbing, the physical players were early, it happens.
Quietly, under everything else: real money added almost 100,000 contracts to its 10-Year Treasury long this week.
The position now stands at 2,539,491 contracts, a new three-year high, after a month camped at the previous one.
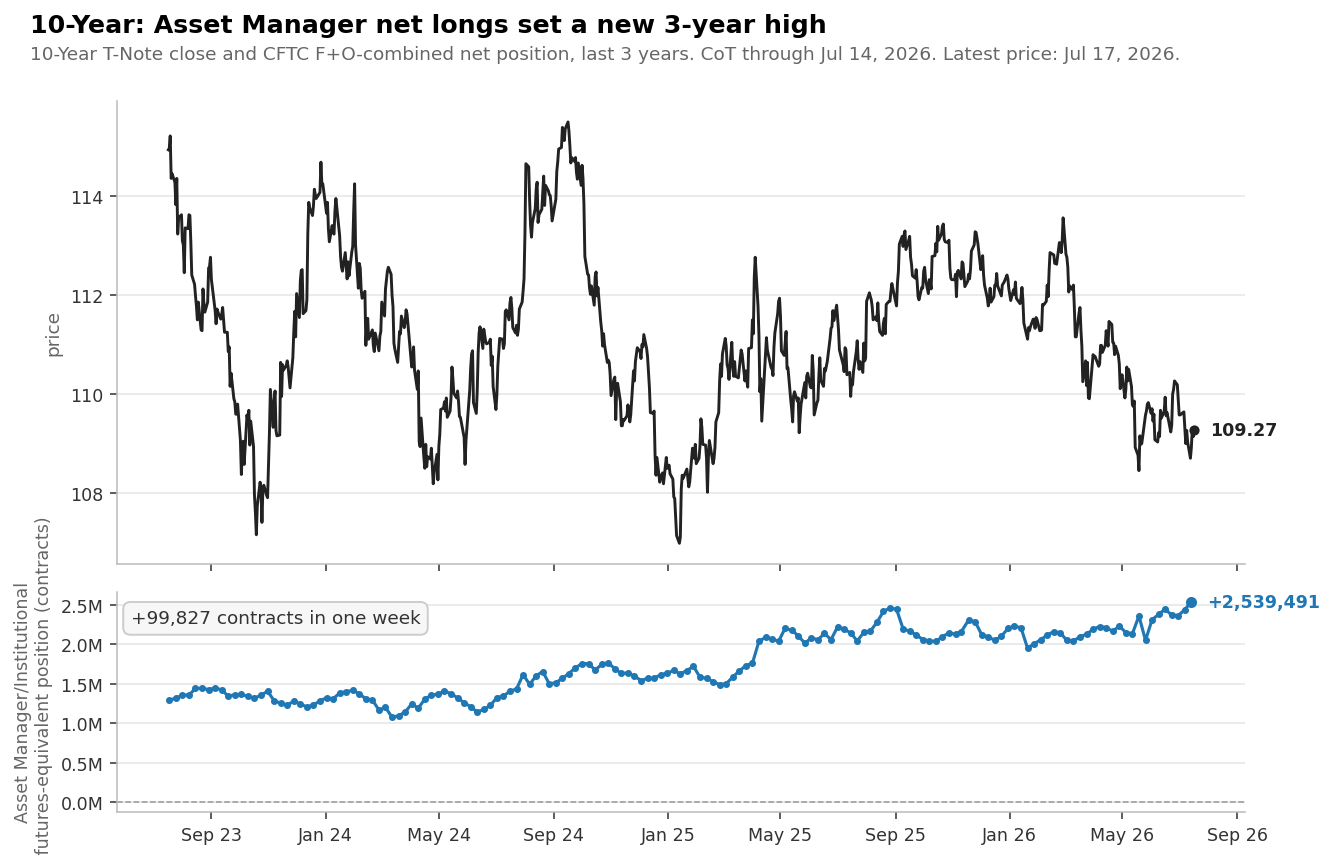
The bet is simple: yields go lower.
The note itself gained 0.2% this week, the position keeps growing faster than it pays.
A long this stretched is fuel for a rally if yields break lower, and fuel for a violent unwind if they don’t, let’s see…
Three setups, three outcomes.
Cocoa: a moderate lean by the physical players into a vertical rally — worked.
Crude: a genuine three-year extreme — worked bigger and faster than I gave it credit for.
Silver: the most bullish positioning on the board — still losing, with the dollar a suspect but this week not the culprit.
That spread of outcomes is the real lesson of this report.
Positioning tells you where the pressure is building and who is leaning on which side.
It is a weak clock.
The trader who treats it as a timing tool gets the silver experience; the one who treats it as a pressure map got cocoa and crude.
What I’m watching next week:
Oil follow-through. The physical players’ crude long set another record this week. Heating oil and gasoline are already near the top of their three-year price ranges — the question is whether crude’s 15% week was the start or the whole move.
Wheat’s gross shorts. One more week of building into a stalled price and this becomes the loudest warning in the data.
The dollar’s price, not just its positioning. The long is stretched; the price is asleep. Whichever way that resolves, the metals go with it.
Whether real money keeps trimming the Nasdaq. The dip-buyer stepping back is what turns a hedge-fund short from a bet into a trend.
Let’s see….
One more thing.
This report covers the handful of markets that made the week's headlines. If you want the same positioning picture for every market I track (all ~50 of them, with the full history behind each chart, updated every week) that lives on the members portal:
Talk soon,
— Leo
The Rogue Quant
Data: CFTC Commitments of Traders, through July 14, 2026. Price action through Friday close, July 17. Positioning compared against a rolling three-year window.
DISCLAIMER: This information is provided for educational and informational purposes only. It is not financial advice, nor a recommendation to buy or sell any securities or financial instruments. Trading involves substantial risk and is not suitable for every investor. You are solely responsible for your own investment decisions and should seek advice from a licensed financial advisor before acting on any information provided in this article. The author(s) and publisher disclaim all liability for any loss or damage arising directly or indirectly from the use of this information. Research commentary, not investment advice. CoT data describes aggregated positioning, not trader intent or predictions. Use this information at your own risk.
Comments
Nothing yet. Say the first thing.
Sign in to join the conversation.