
For eighty years the working assumption of American public finance was that debt is the product of policy and interest is the product of debt. That chain now runs in reverse: interest drives the deficit, the deficit drives issuance, and issuance drives the rate. With the 30-year Treasury above 5%, Washington has to treat its own bond market as a constraint rather than a source of funds.
This essay is part of America Unpacked.

Li Kuchan, Eagle and Pine 李苦禅(1899–1983) 松鹰图
Weight settling onto something old enough to carry it — a fitting image for an essay about strain that has not yet become crisis.
Yesterday, Scott Bessent’s Treasury announced it would at least double the per-operation cap on liquidity support buybacks in long-dated nominal coupon securities, from $2 billion to at least $4 billion, covering the 10-to-20-year and 20-to-30-year buckets. The stated rationale was as restrained as it always is: improve secondary market liquidity, give investors a steadier trading environment.
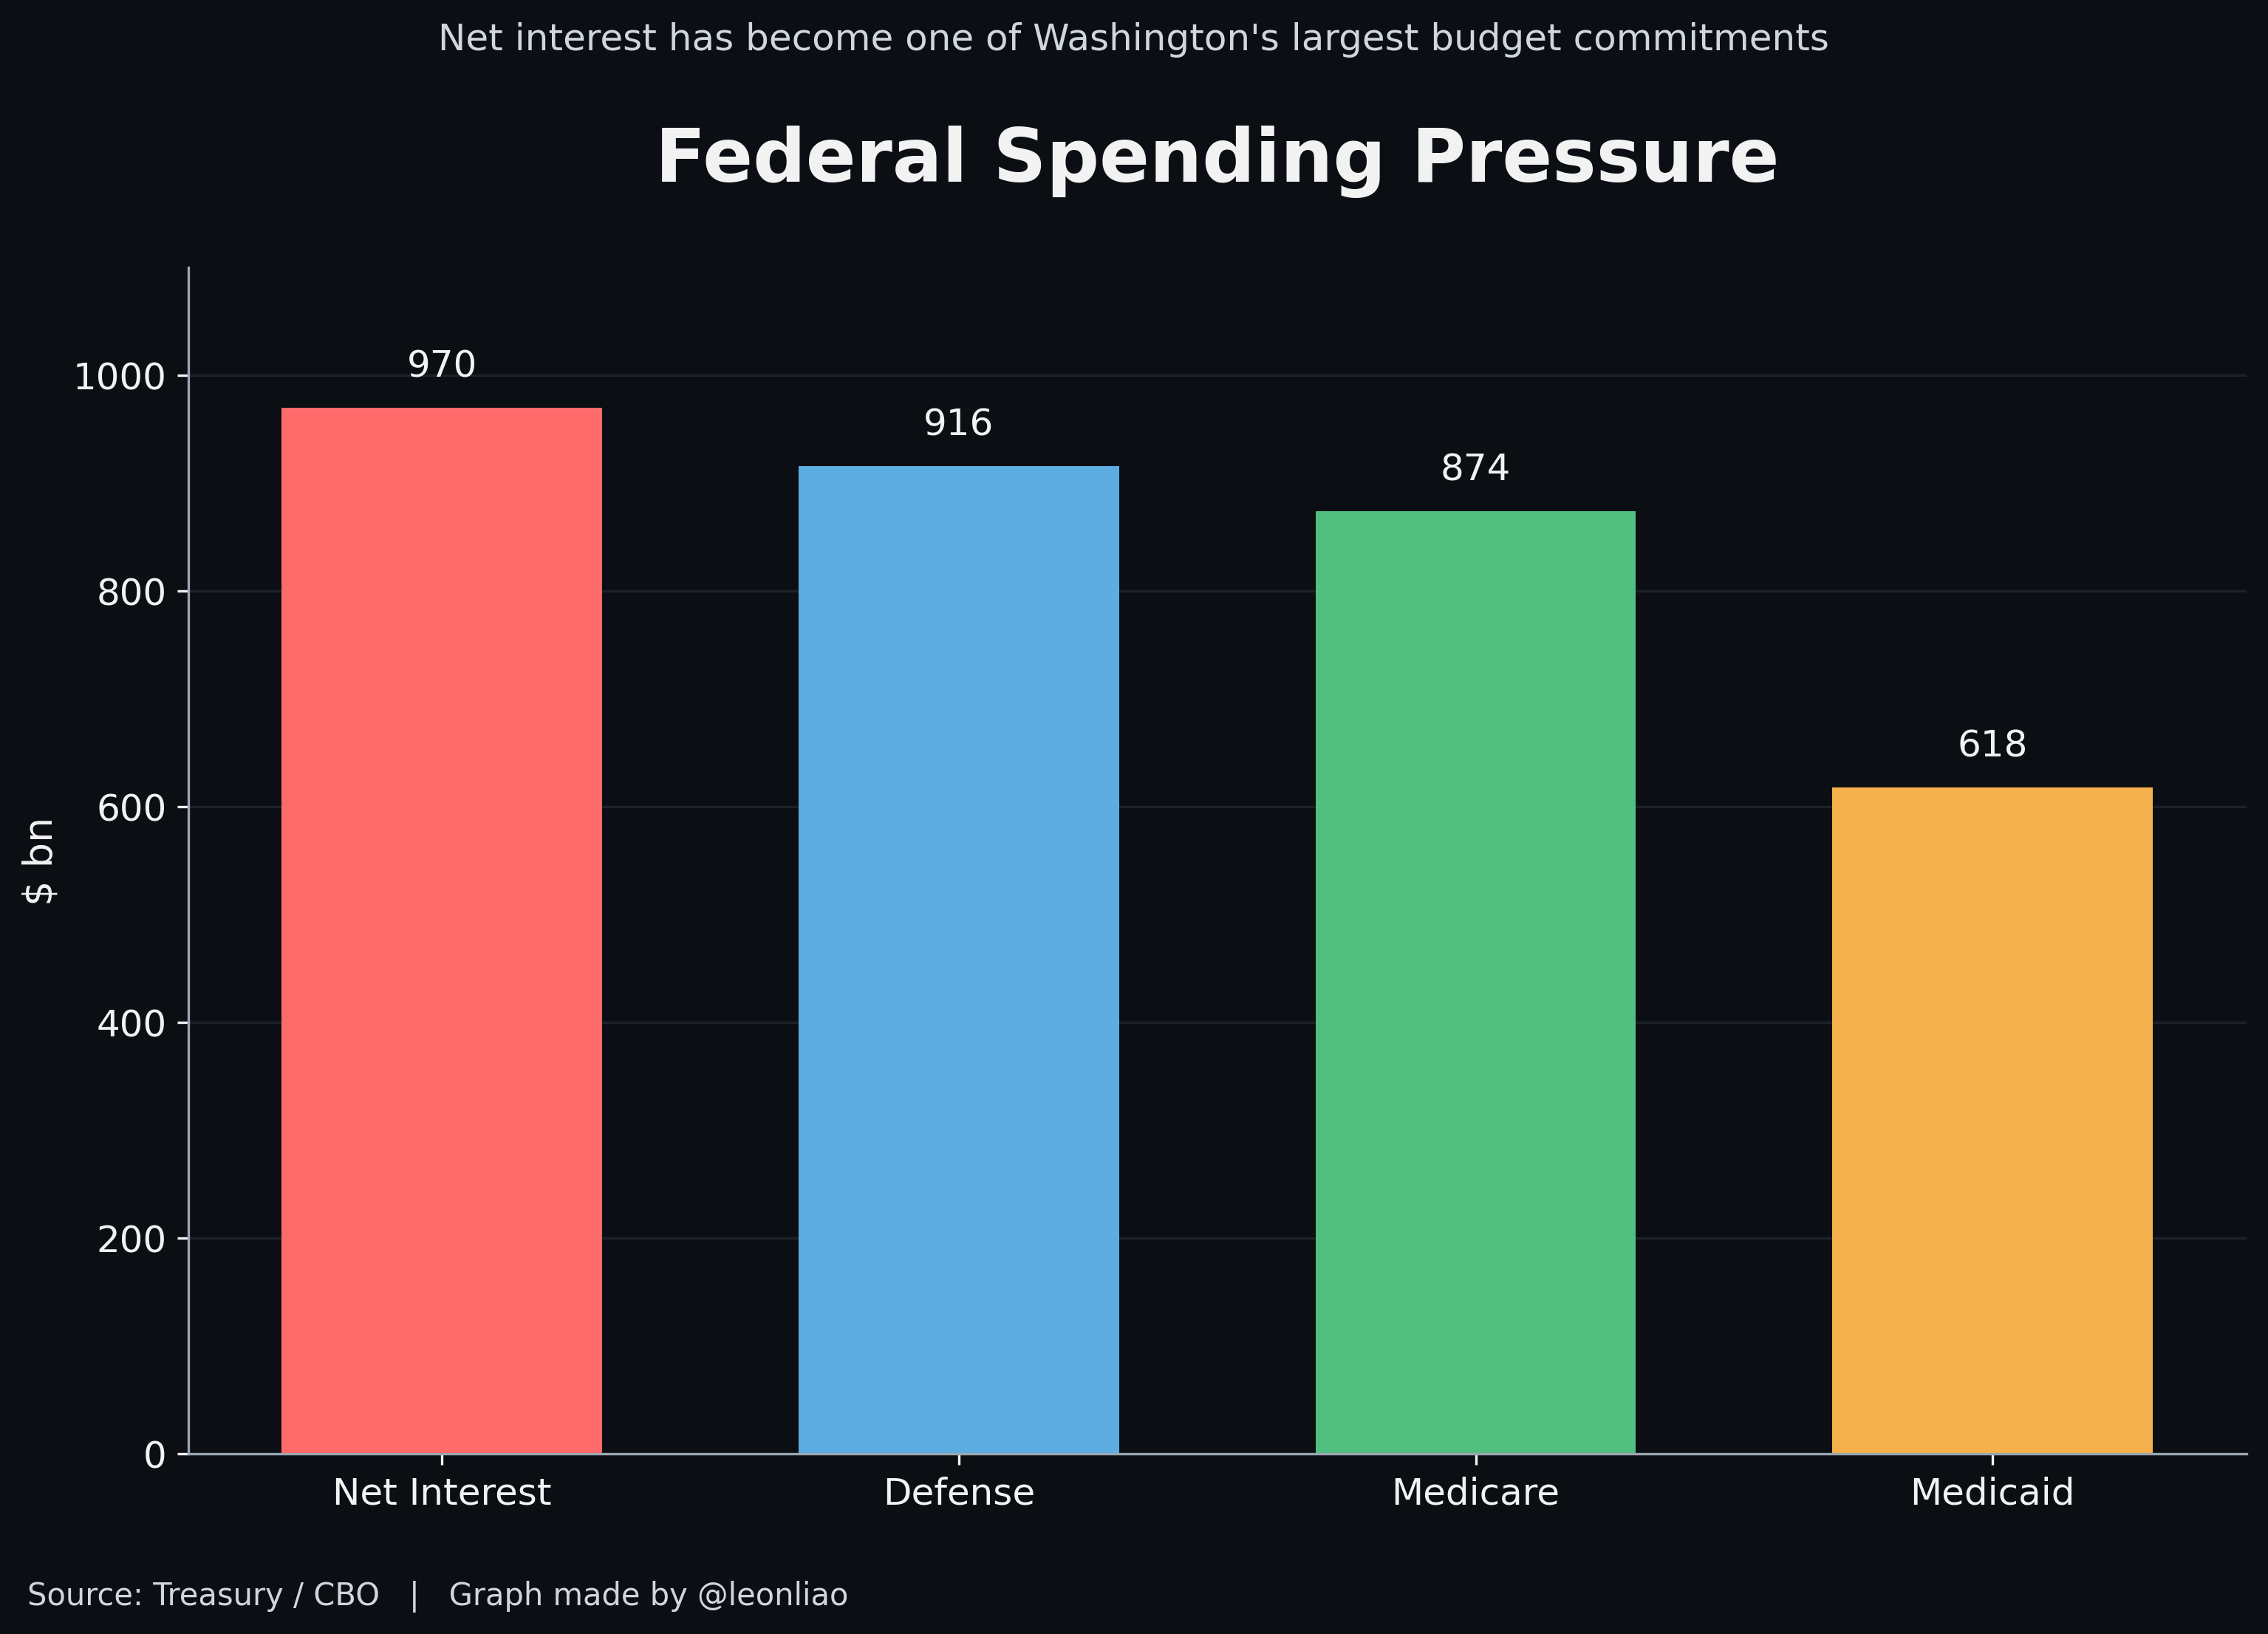
The federal government pays its creditors before it decides anything else. That is not a legal rule; it is what the arithmetic has become. Net interest came to $970 billion in fiscal 2025 against $5.24 trillion of revenue, and none of it was available to any committee, any agency or any president. Washington can still borrow whatever it needs — the auctions clear, the market is the deepest in the world, and no yield figure breaks the system on contact. What it can no longer do is borrow without narrowing the range of things it is free to decide. Call it the Treasury constraint.
By any measure this is small money. Against a marketable stock counted in tens of trillions, $4 billion is a rounding error. The reaction was out of all proportion to the amount. Long yields fell quickly, the 30-year by roughly ten basis points, and the dollar weakened alongside. Traders were pricing something the notice did not say:
Bessent’s Treasury has begun to care about the level of long-term interest rates itself.
That reading, if correct, means a convention that has held for decades is loosening. Every Treasury secretary since the 1970s has worked to the same brief — fund the government at the lowest cost over time, under the most stable market conditions possible, on a schedule that is regular and predictable. The department was the largest bond issuer in the world, but it did not manage bond prices, and bond prices did not manage it.
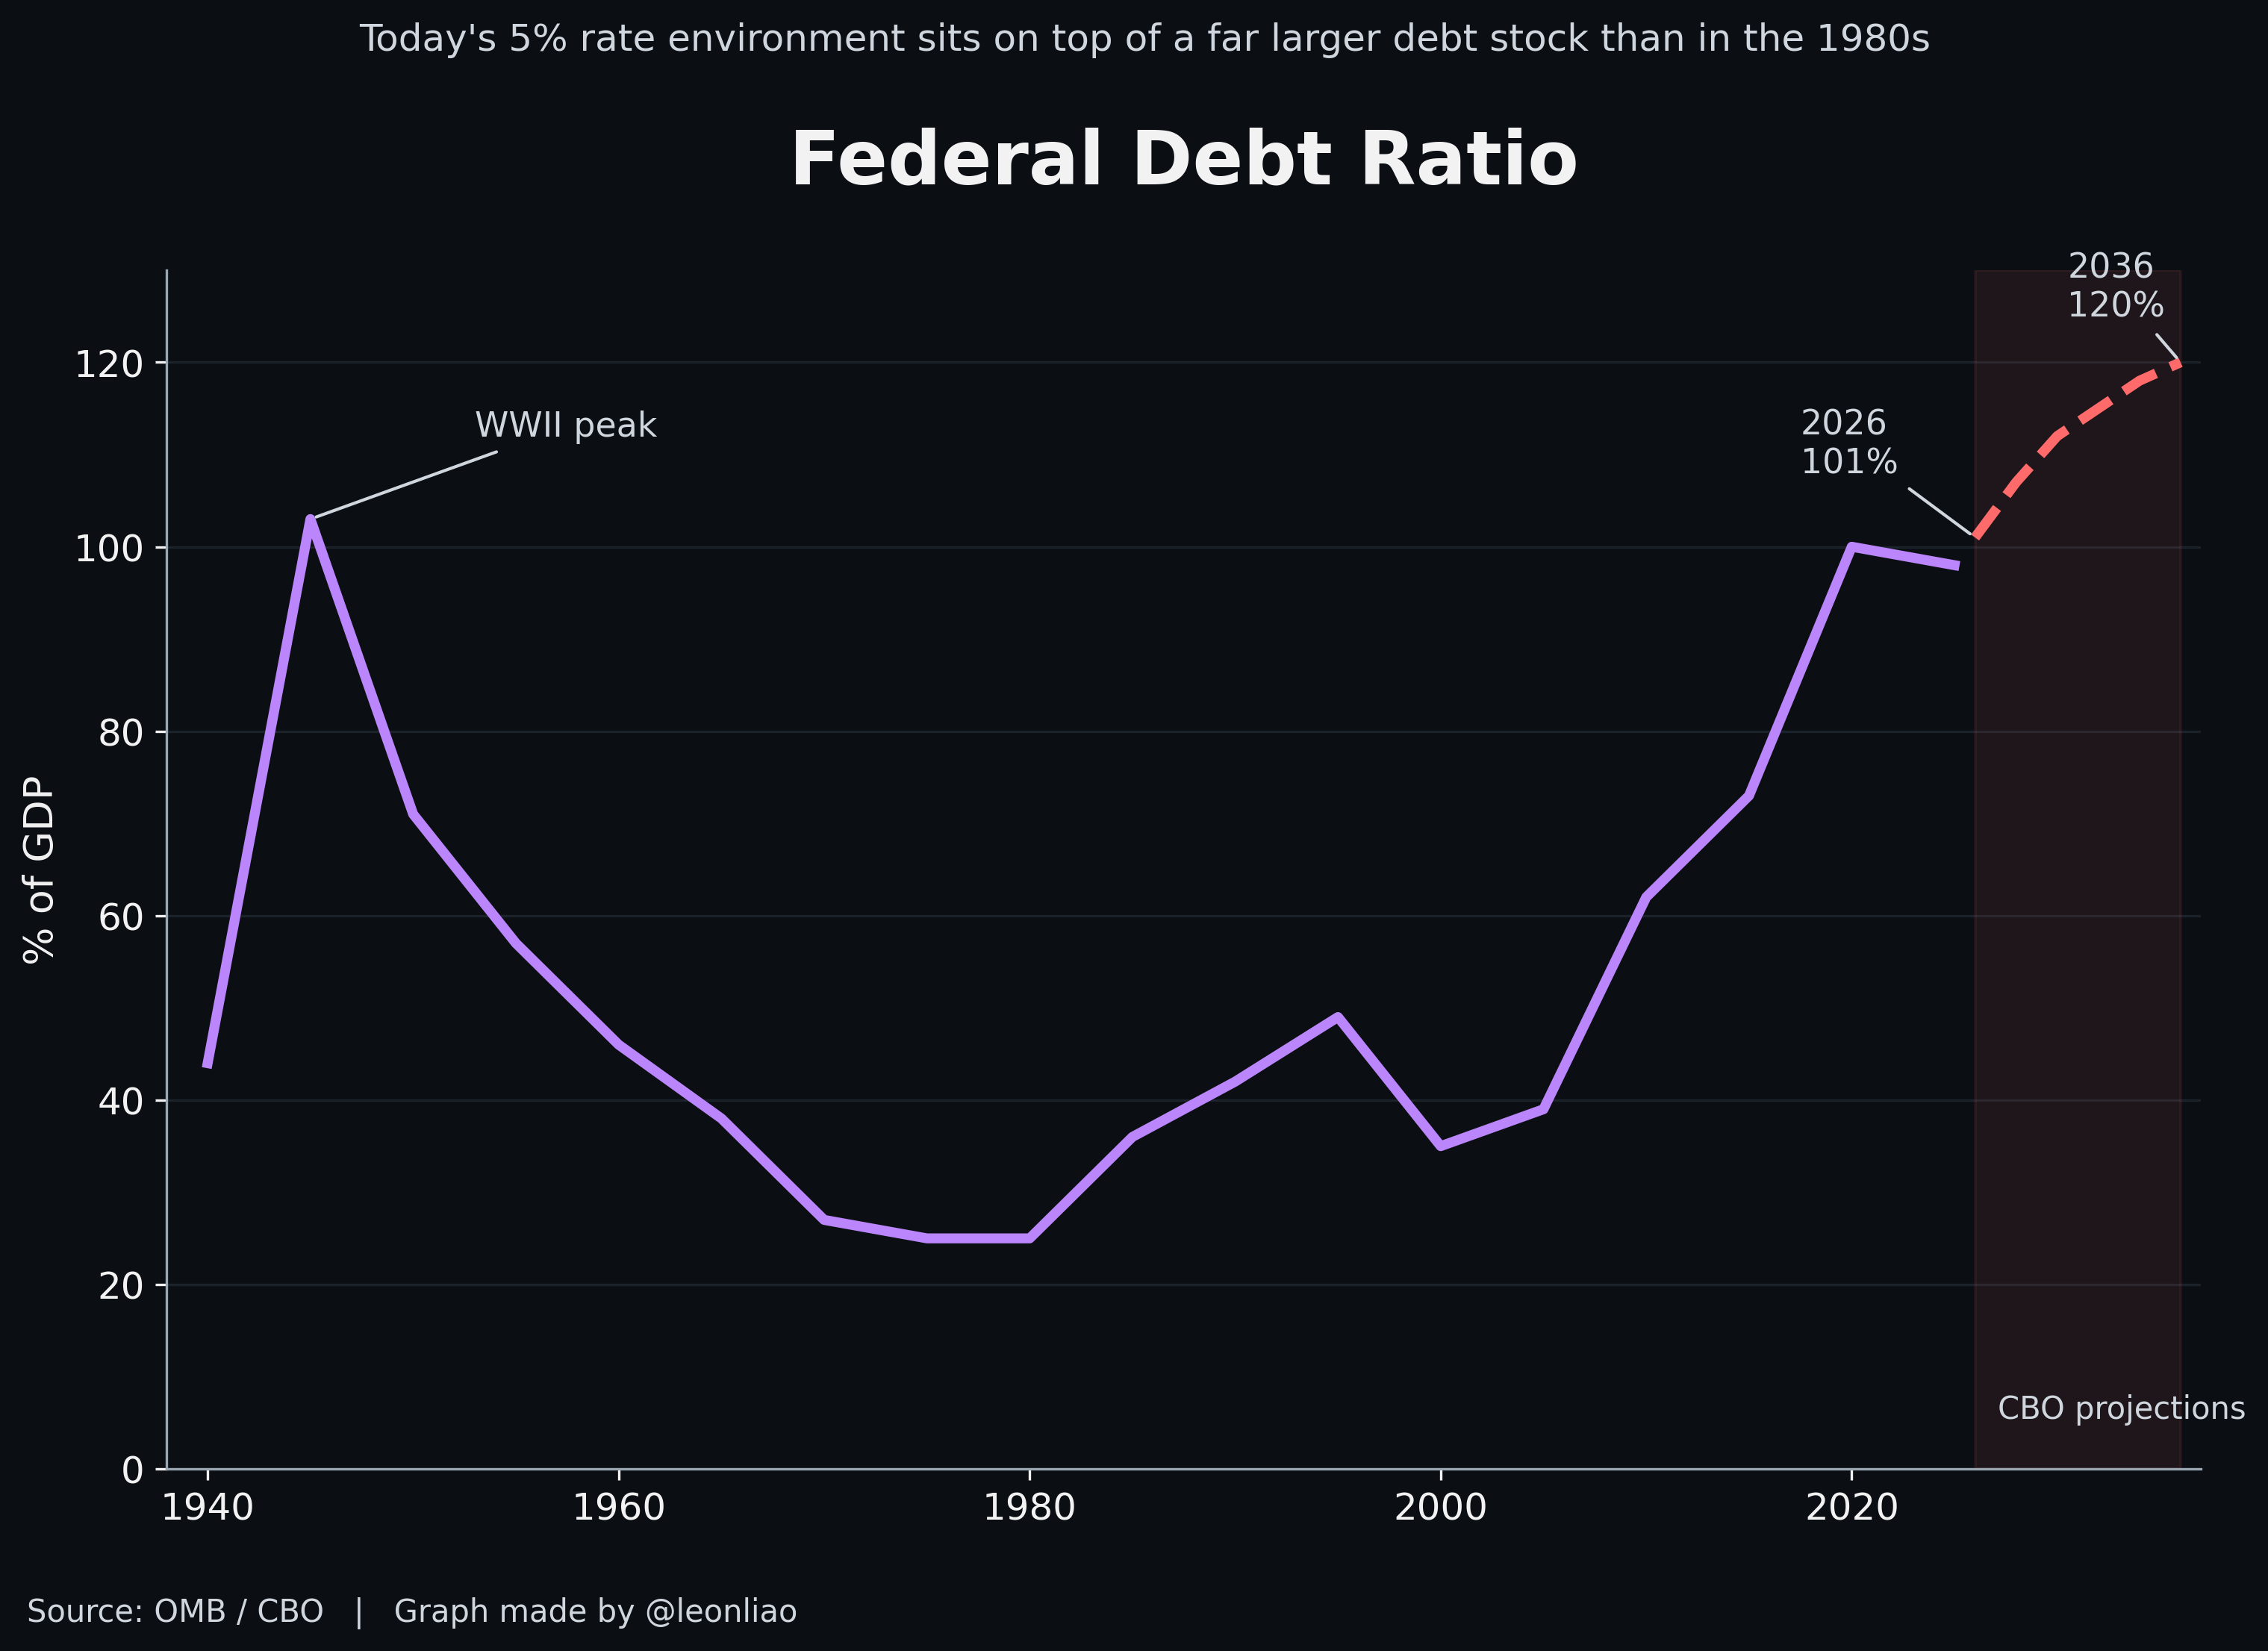
But now Bessent cannot hold that line as cleanly as Rubin or Paulson could, because the arithmetic underneath it has changed. He runs a debt stock above 100% of GDP into a market that reprices it continuously, and the cost of getting that wrong now shows up inside the budget within a single fiscal year. The United States retains formidable taxing capacity, full monetary sovereignty and a bond market no other issuer can match; nothing here breaks at some particular yield. But the constraint is real, and it is already operating.
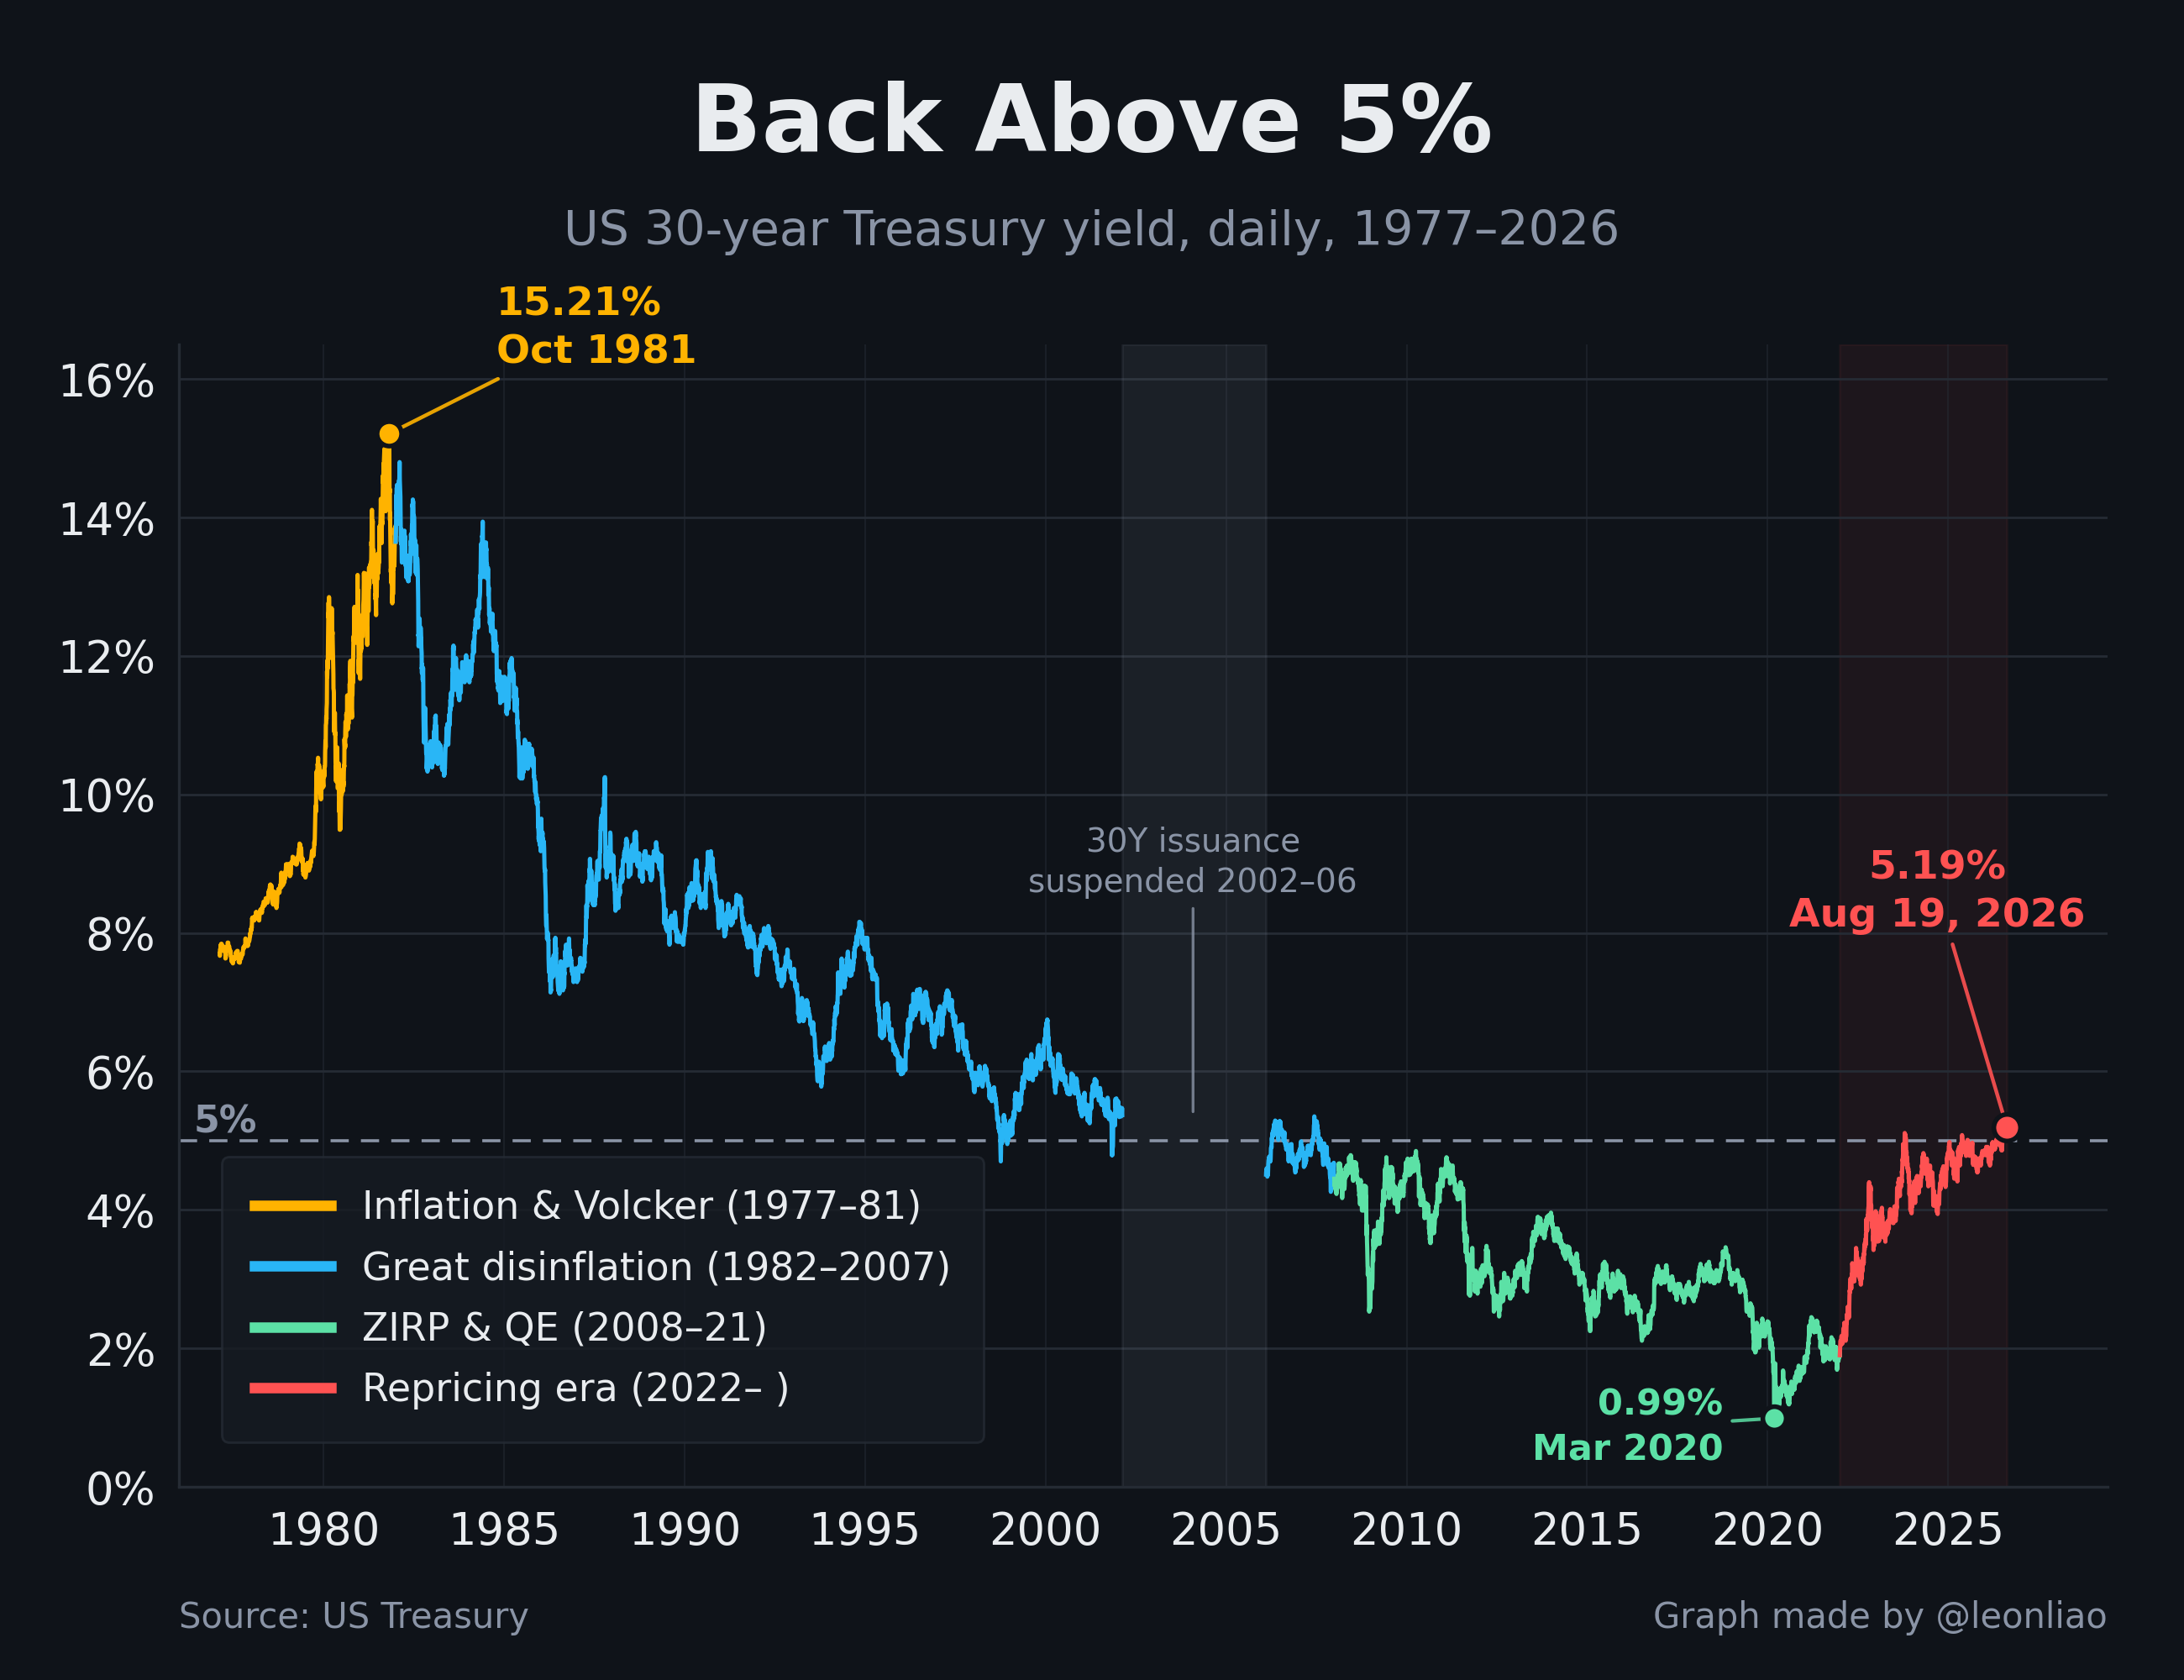
In 1981 the 30-year Treasury yielded more than 15%. Set against that, today’s 5.19% looks almost benign, roughly a third of the Volcker peak. The comparison comes out whenever someone worries about the fiscal consequences of high rates: America has lived through much higher yields than these, and nothing broke.
The people who make that comparison drop the other term in the multiplication. Interest expense is the debt stock times the average rate. Rates in the 1980s were extreme, but the stock they applied to was modest, and the product topped out with net interest a little above 3% of GDP. Today the composition is inverted. The rate is a third of what it was, while federal debt has gone from around 31% of GDP in 1981 to more than 100%. The same one-point move in yields, applied to balance sheets that differ this much in size, produces entirely different fiscal outcomes.
The 1980s answered the question of whether America can withstand a 5% interest rate. They did not answer whether America can withstand a 5% interest rate carrying debt above 100% of GDP. That combination has never persisted in American history.
Analysts reach first for debt as a share of GDP, but it is a stock measure with a very large and therefore very slow-moving denominator. It tells you how much America owes. It does not tell you how much America must hand over each year. The ratio that determines policy space is net interest as a share of federal revenue: for every dollar the government collects in tax, how much has already been claimed by money borrowed in the past, and is therefore unavailable to any present decision.
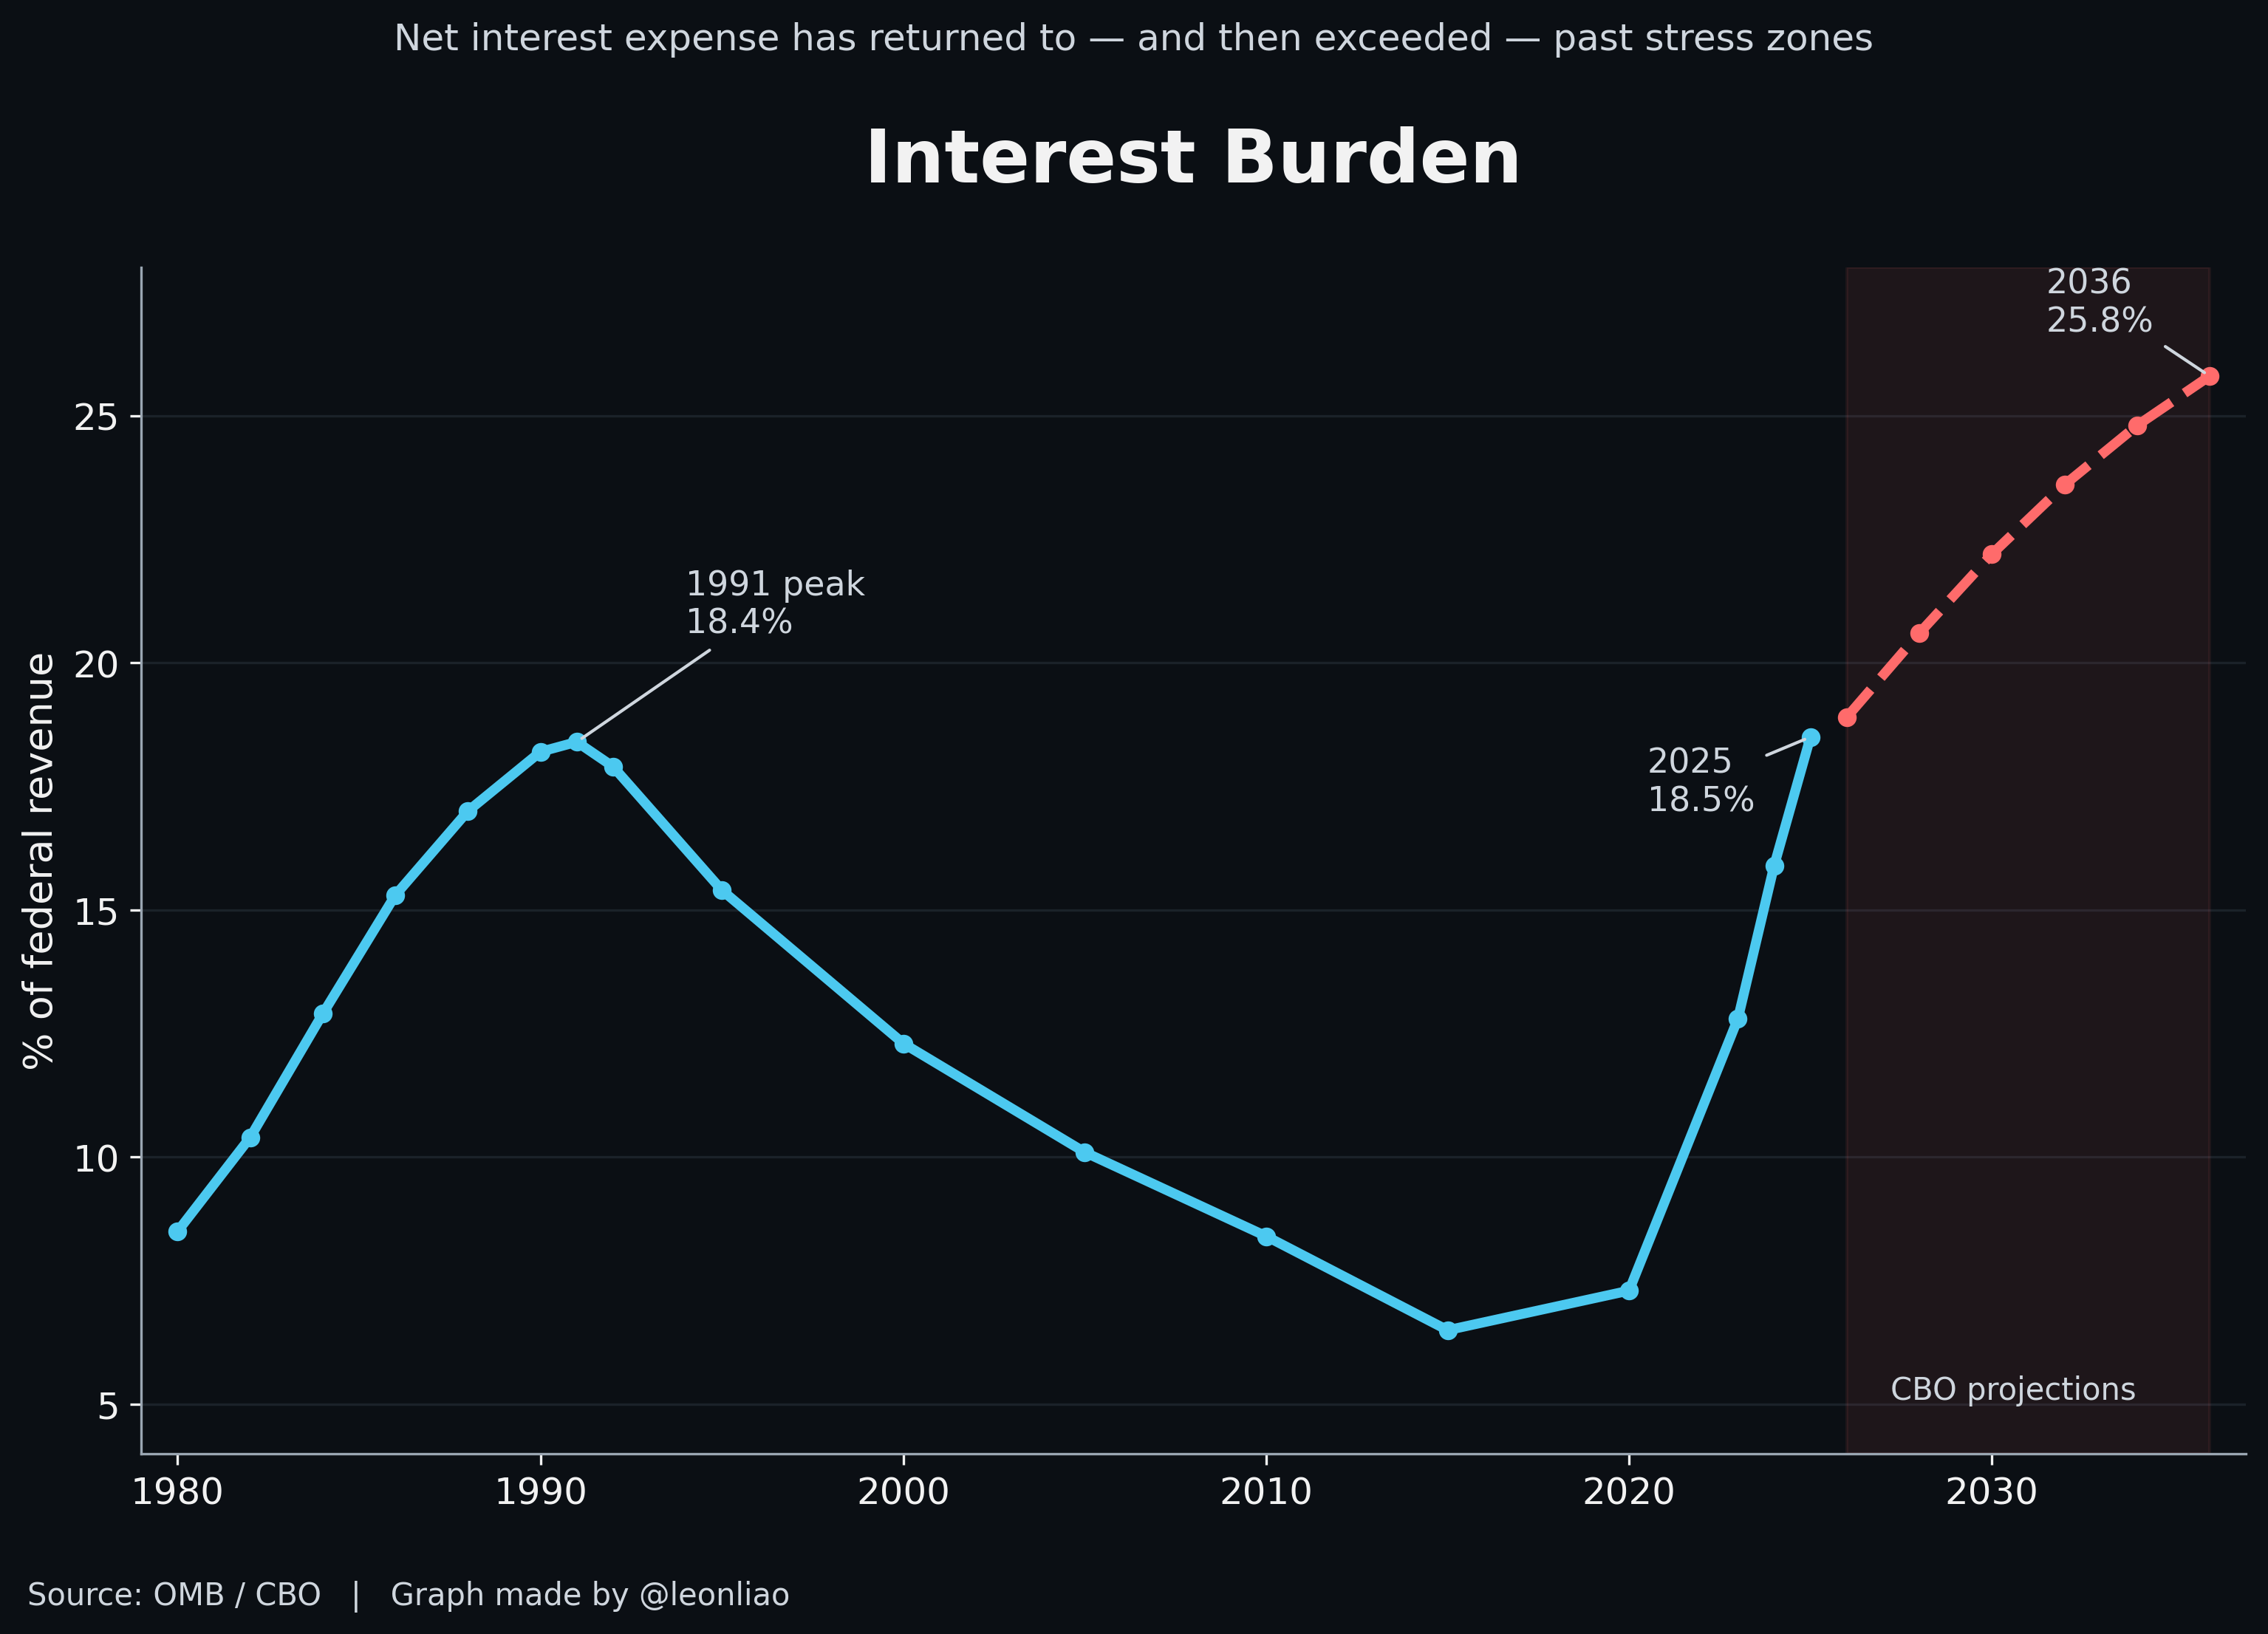
In fiscal 2025, federal net interest was $970 billion and federal revenue was $5.24 trillion. The ratio is 18.5%.
That figure matters because it has an exact historical reference. 1991 was the peak of the last era of American interest-burden pressure: net interest ran at 3.16% of GDP and revenue at 17.13% of GDP, which on the same basis puts interest at about 18.4% of revenue. The 18.5% of 2025 has already edged past it. After four decades, several rounds of tax cuts, an inflation and a period of zero rates, American public finance is back where it started.
What differs is what came next. 1991 was a peak, and Congress and the Fed then spent a decade pushing the ratio down: the post-Cold War decline in defense spending, the productivity boom of the 1990s, the budget agreements of the Clinton years, and a thirty-year decline in interest rates. The CBO’s current baseline points the other way. In 2026 net interest reaches 3.3% of GDP against revenue of 17.5%, or about 18.9% of revenue. By 2036 net interest reaches 4.6% of GDP against revenue of 17.8%, or roughly 25.8%.
At 25.8%, more than one dollar in every four the federal government collects goes straight to creditors. This is not a stress scenario. It is what the CBO produces in a neutral baseline that assumes no recession and no substantial further rise in rates.
Measured against GDP the same pressure is clearer, and even less precedented. Over the past fifty years the peak in net interest was around 3.2% of GDP. Fiscal 2025 came in at 3.15%, 2026 is projected at 3.3% and 2036 at 4.6%. The CBO states explicitly that in every single year from 2026 to 2036, net interest stays above 3.2% of GDP: for a full decade the United States sits in territory it has never occupied on a sustained basis since 1940, rather than touching it briefly and falling back. For scale, by 2036 net interest alone will roughly equal the whole of federal discretionary spending — defense, research, infrastructure, education, justice and diplomacy combined.
America is not approaching its previous interest-burden record. It is standing on it. The question is how much further beyond the historical range the fiscal system can go.
Appropriators are now bidding against bondholders for the same dollar. Once debt service is comparable in size to defense or Medicare, categories both parties have long treated as politically incompressible, the character of the fiscal argument changes. For decades the House and Senate argued about which program to cut, which is a question about priorities. When creditors take their claim first, the question becomes how much is left to argue over at all.
If the interest burden has already set a record, the natural inference is that this reflects the current rate environment, and that if rates stop rising the pressure stabilizes.
The inference is wrong.
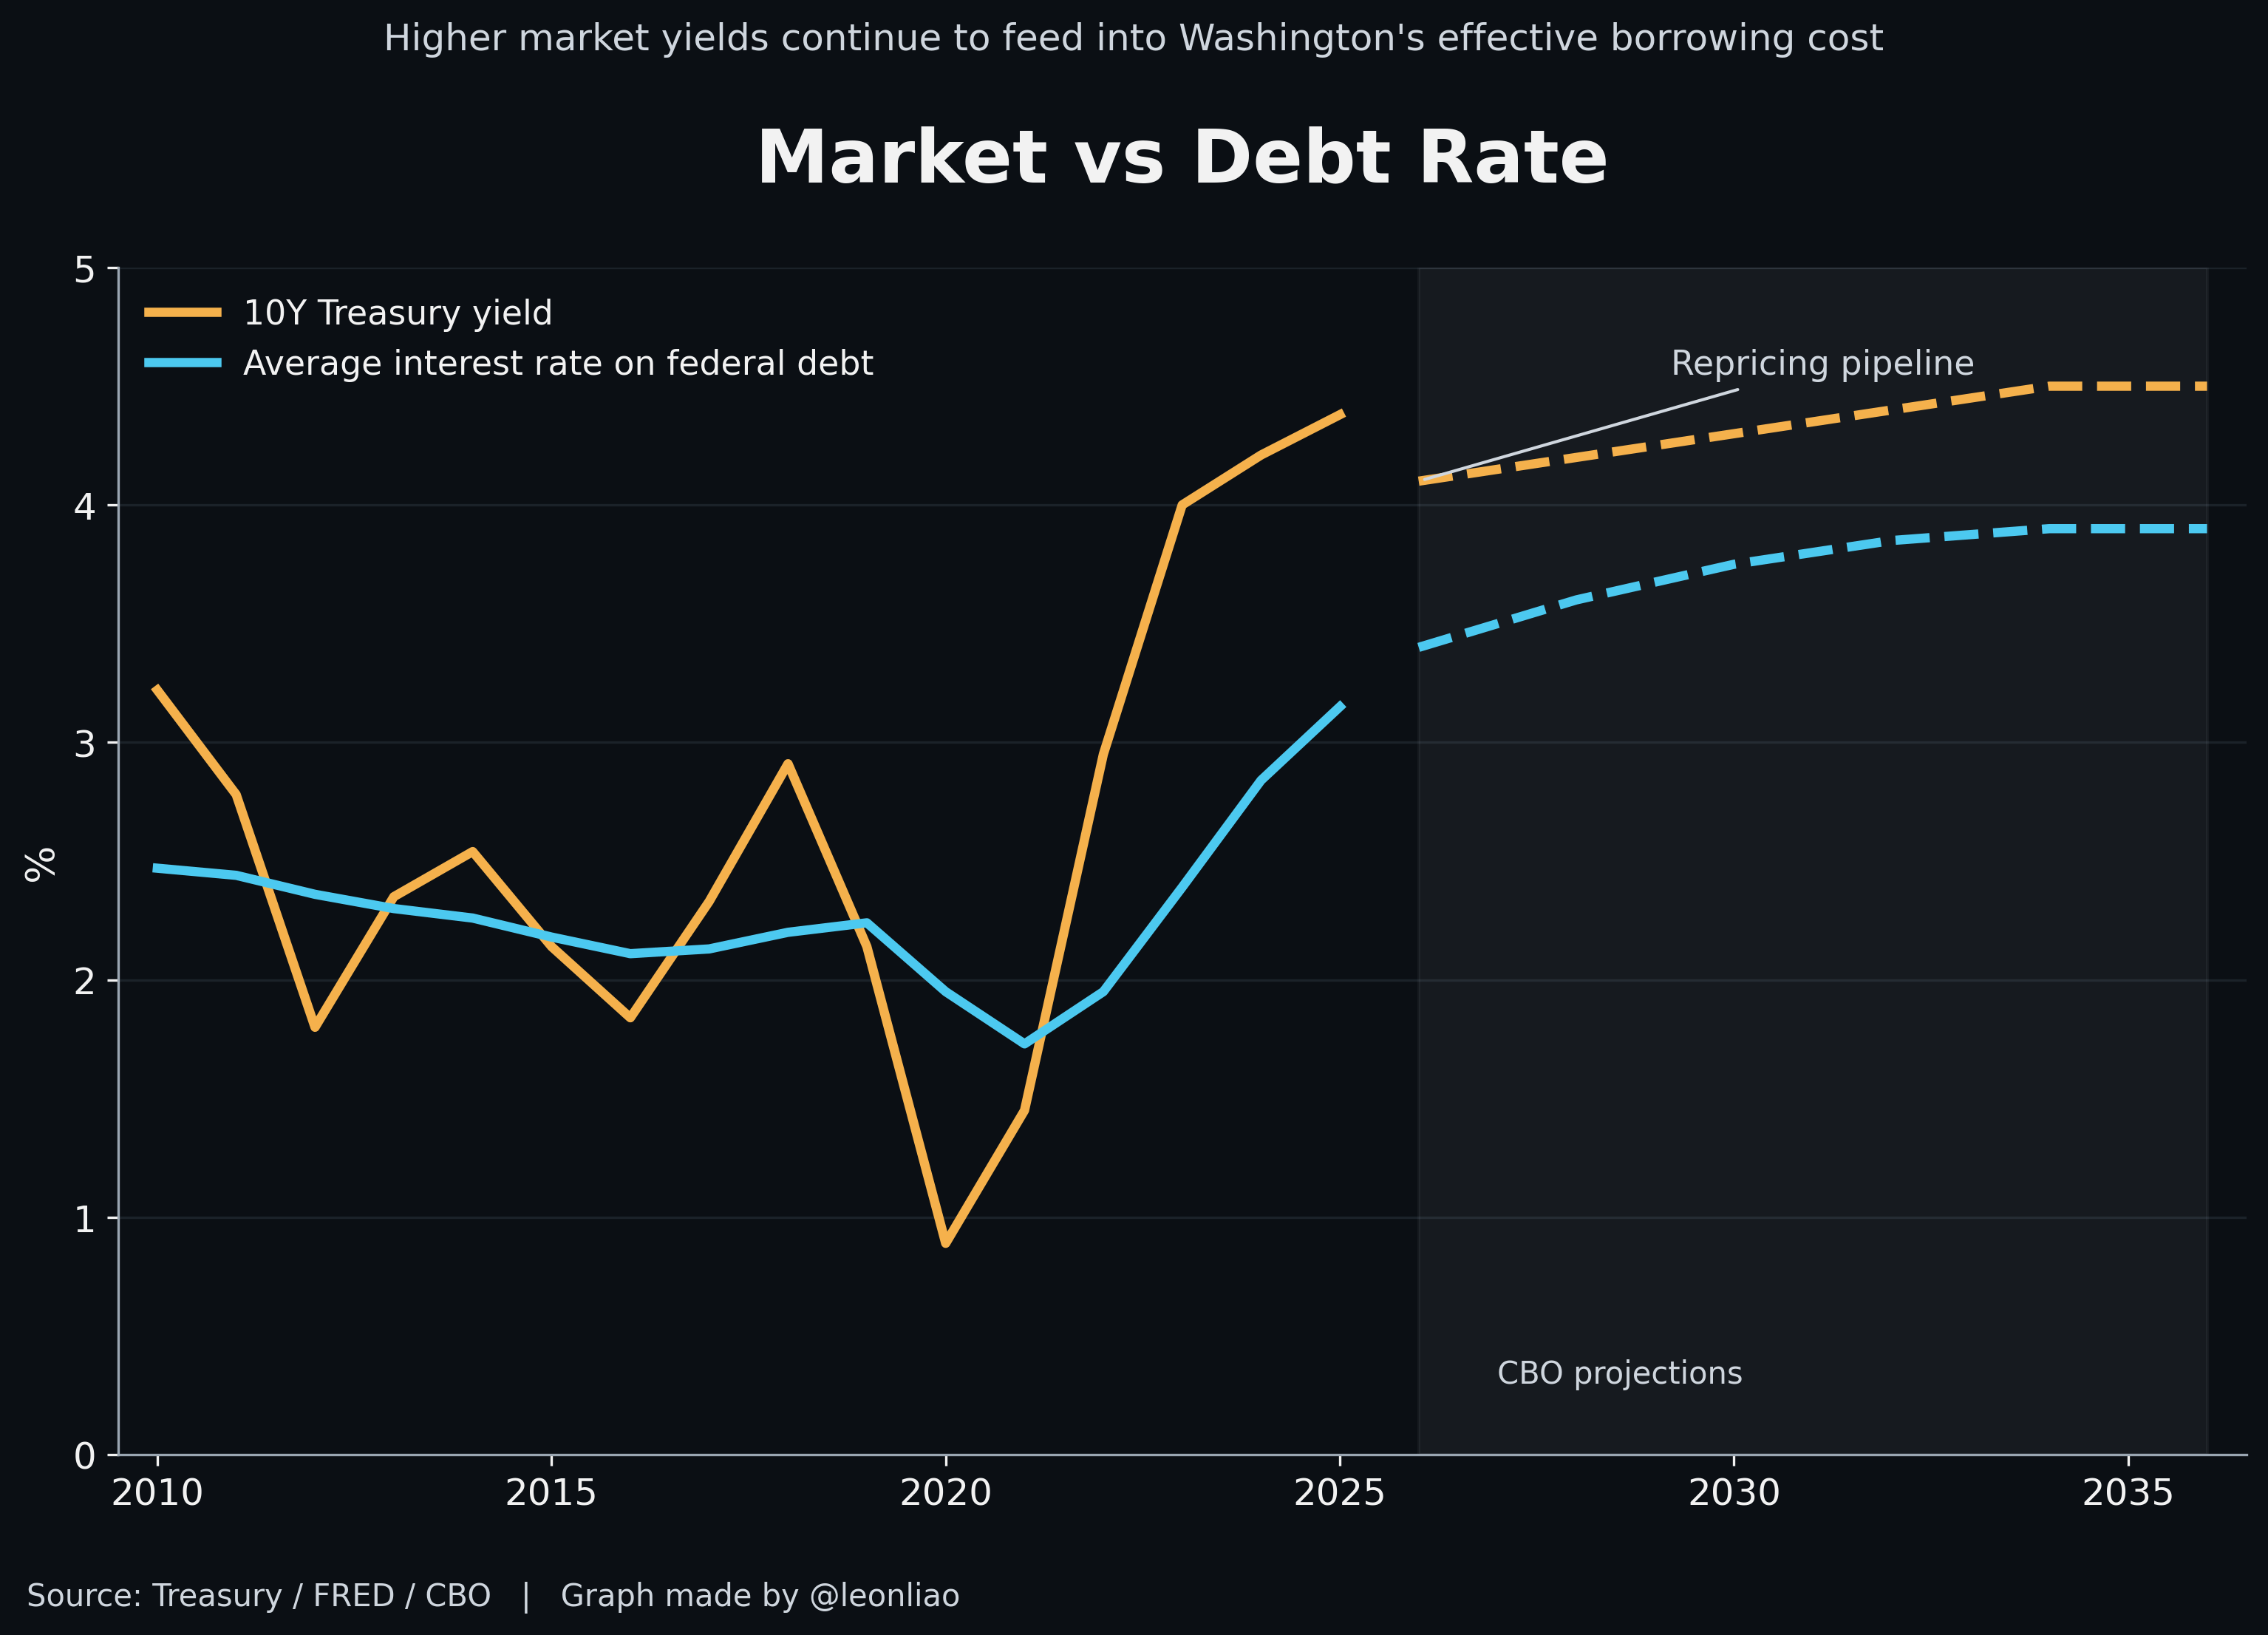
The rate on the fiscal ledger and the rate in the market are two different things. The CBO estimates the average effective interest rate on federal debt held by the public in 2026 at just 3.4%. The Treasury’s official yield curve on August 19, 2026 read: 4.00% at one year, 4.19% at two, 4.35% at five, 4.65% at ten, 5.17% at twenty and 5.19% at thirty.
The 3.4% on the books is a lagging weighted average, and much of its weight comes from debt the Treasury issued around the pandemic at very low rates and has not yet retired. Those securities still sit on the ledger, still accrue at the coupons locked in at the time, and hold the average cost of the portfolio artificially low. They constitute a large repricing gap that has yet to be realized.
That gap means one thing in particular. Even if ten- and thirty-year yields never rise again from here, simply holding around 4.5% to 5% is enough to keep the effective rate on federal debt climbing. The growth in interest expense needs no new rate shock to drive it; Treasury officials determined it years ago through their issuance choices. The CBO’s own baseline assumes exactly this, with the average effective rate drifting from 3.4% up to 3.9%. Its decomposition of the increase in net interest between 2026 and 2036 is more telling still:
roughly half comes from the higher average rate paid, and the remainder mainly from continued growth in the stock of debt.
Two engines are running at once, the debt stock rising multiplied by the effective rate rising. This is a product, not a sum.
Most analysts date the arrival of that repricing from weighted average maturity. At the end of July 2026 the WAM of US marketable debt stood at 70 months, comfortably above the 61.4-month average since 1980. Taken alone, that number supports a reassuring conclusion: America locked in long-term funding rather successfully during the low-rate years, faces no acute near-term repricing pressure, and will see the gap close slowly and gently.
The conclusion rests on a misuse of the measure. WAM is an average, and averages describe a highly asymmetric distribution very poorly. A small volume of very long bonds — a single 30-year issue contributes 360 months — pulls the mean up sharply, while the short-dated instruments that make up most of the outstanding balance get averaged away.
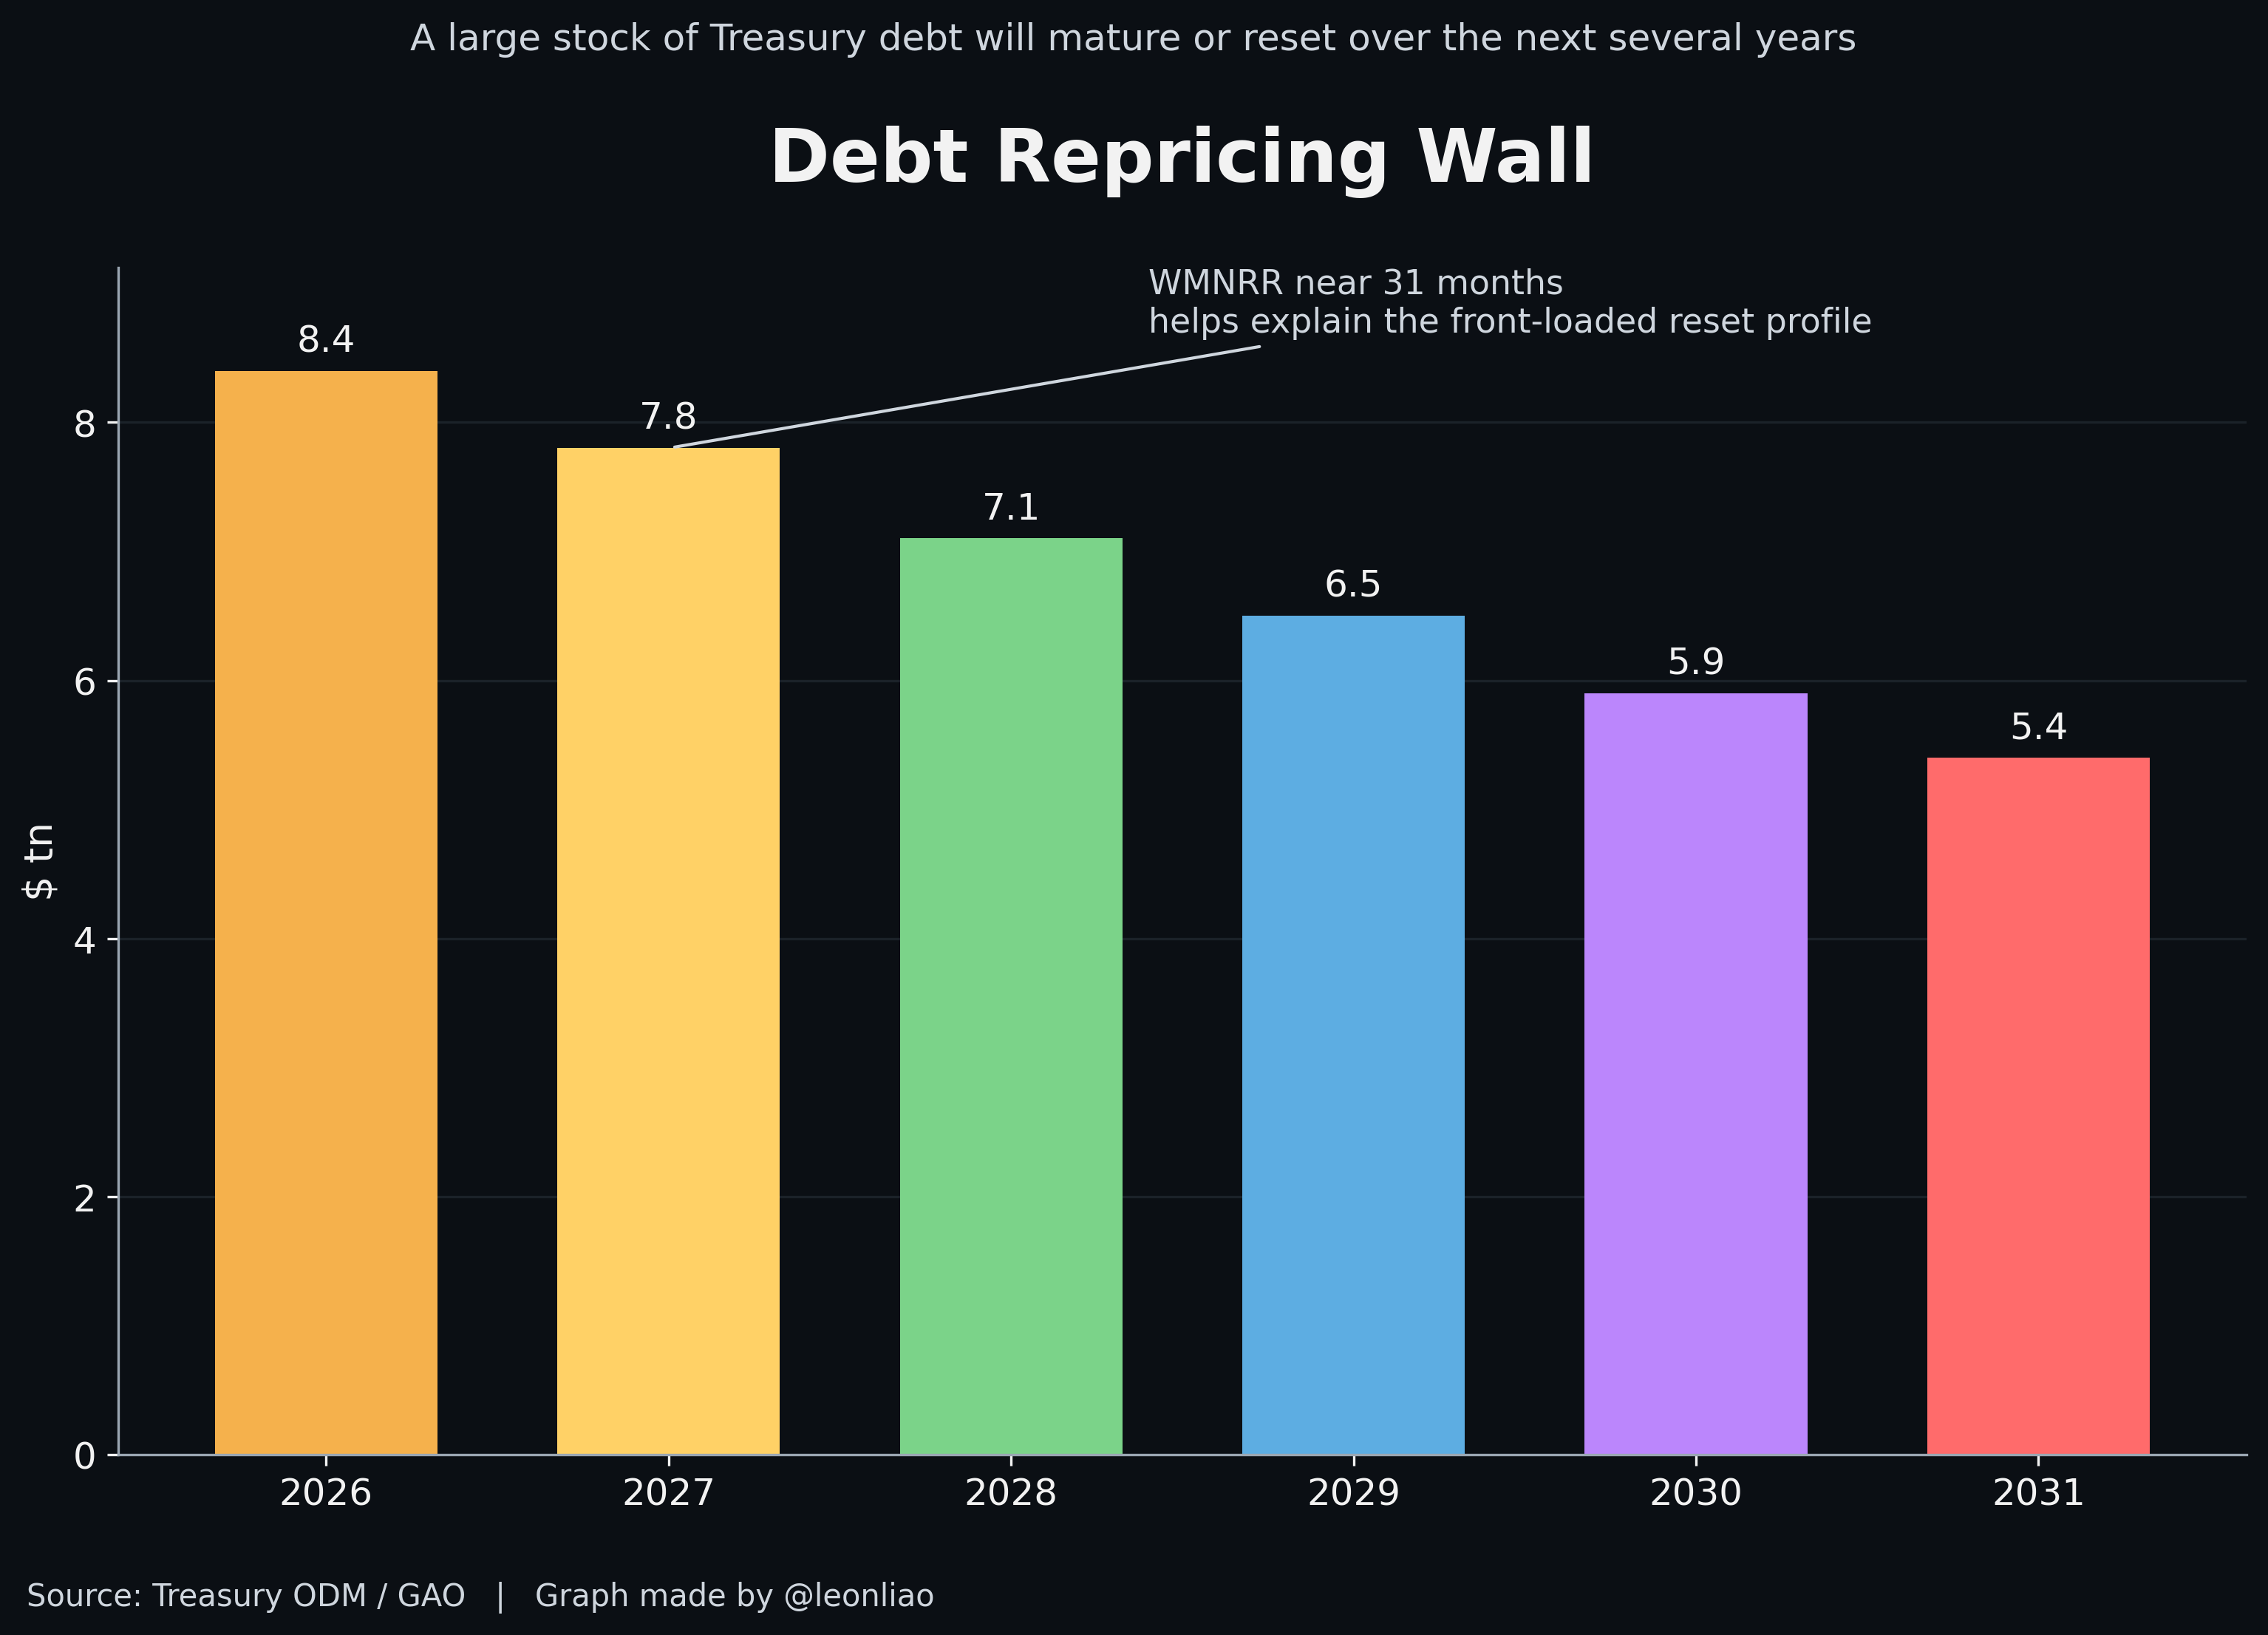
The Treasury evidently understands this, because it publishes another measure: the weighted median next rate reset, or WMNRR. As of July 29, 2026 it stood at 31.4 months for the total Treasury portfolio, 26.9 months for privately held debt, and 28.0 months on a consolidated basis excluding currency and the Treasury General Account.
Weighted by size, half of all Treasury debt either matures or reprices within roughly two and a half years.
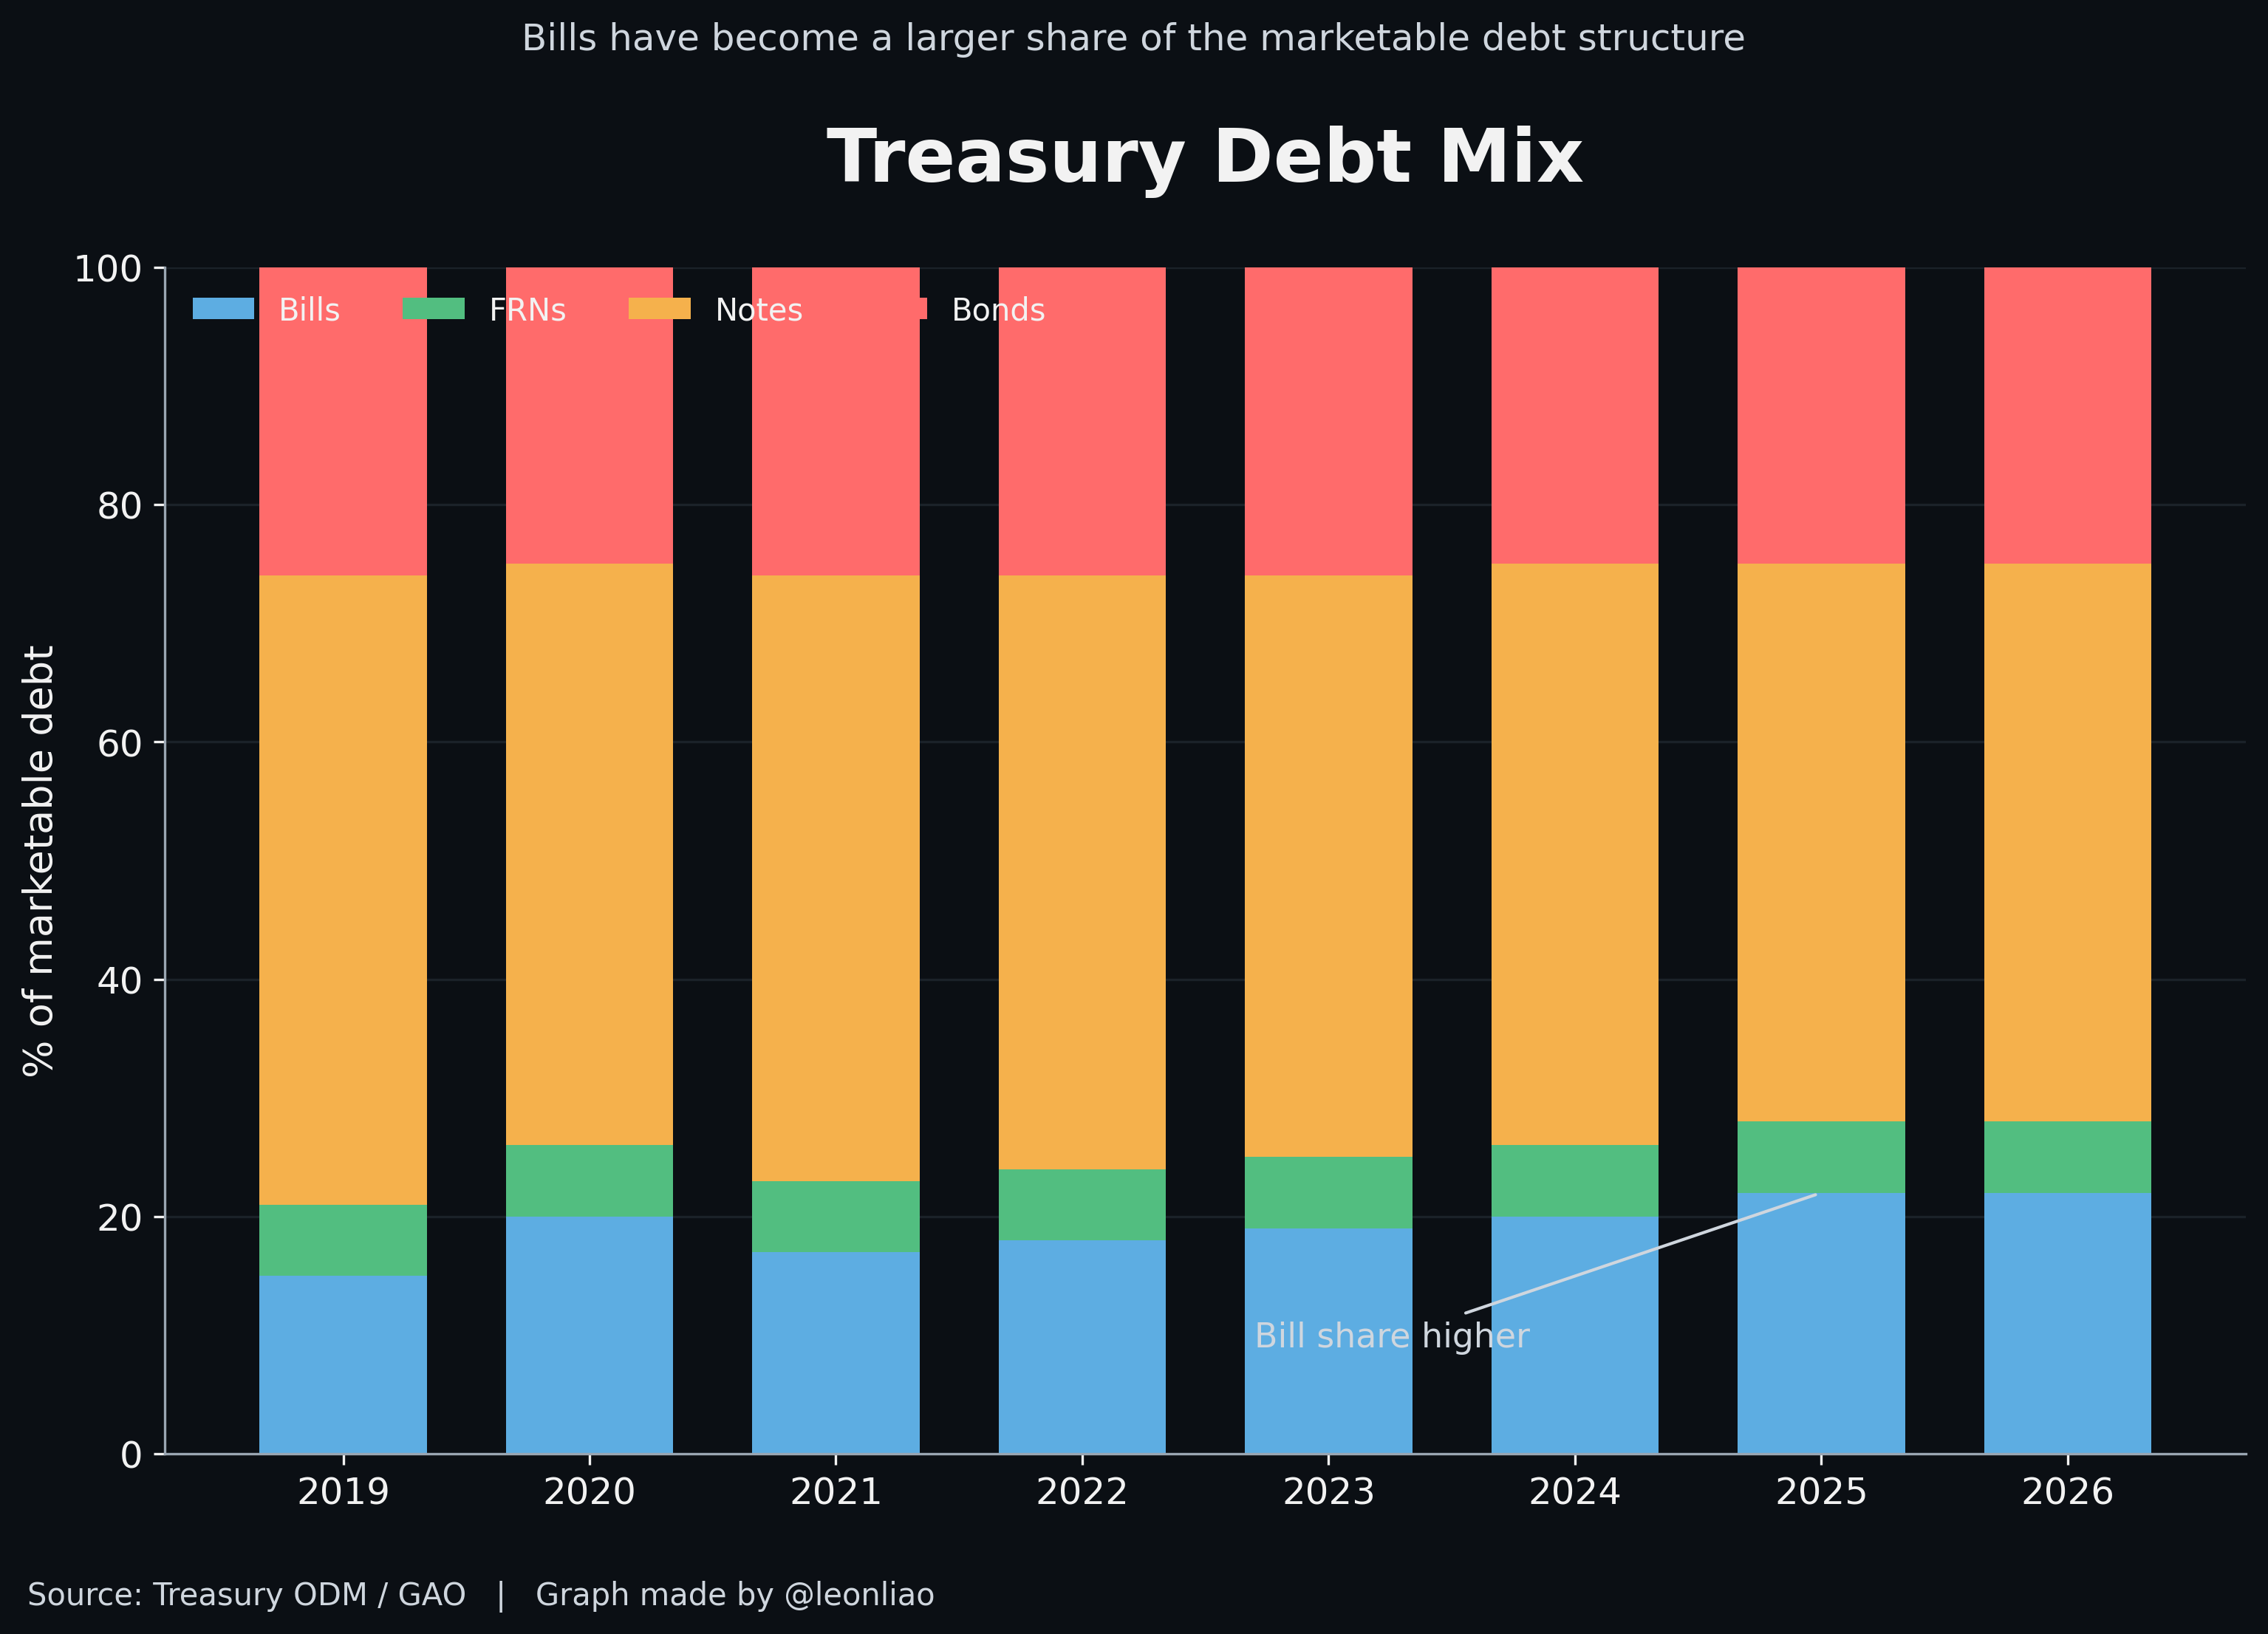
That is a very different picture from “average maturity approaching six years,” and both numbers are correct; they describe different properties of the same distribution. The gap is easy to explain. The Treasury runs an enormous bill book, around $7 trillion at the end of July, or 22.2% of marketable debt, alongside floating rate notes and a large volume of shorter-dated notes. Those instruments are diluted in the WAM and visible in the WMNRR.
WAM says six years. Rate reset says roughly two and a half.
“America has locked in low rates” is therefore the most misleading consensus currently held about US public finance. It mistakes a technical weakness in a descriptive statistic for a substantive fiscal cushion.
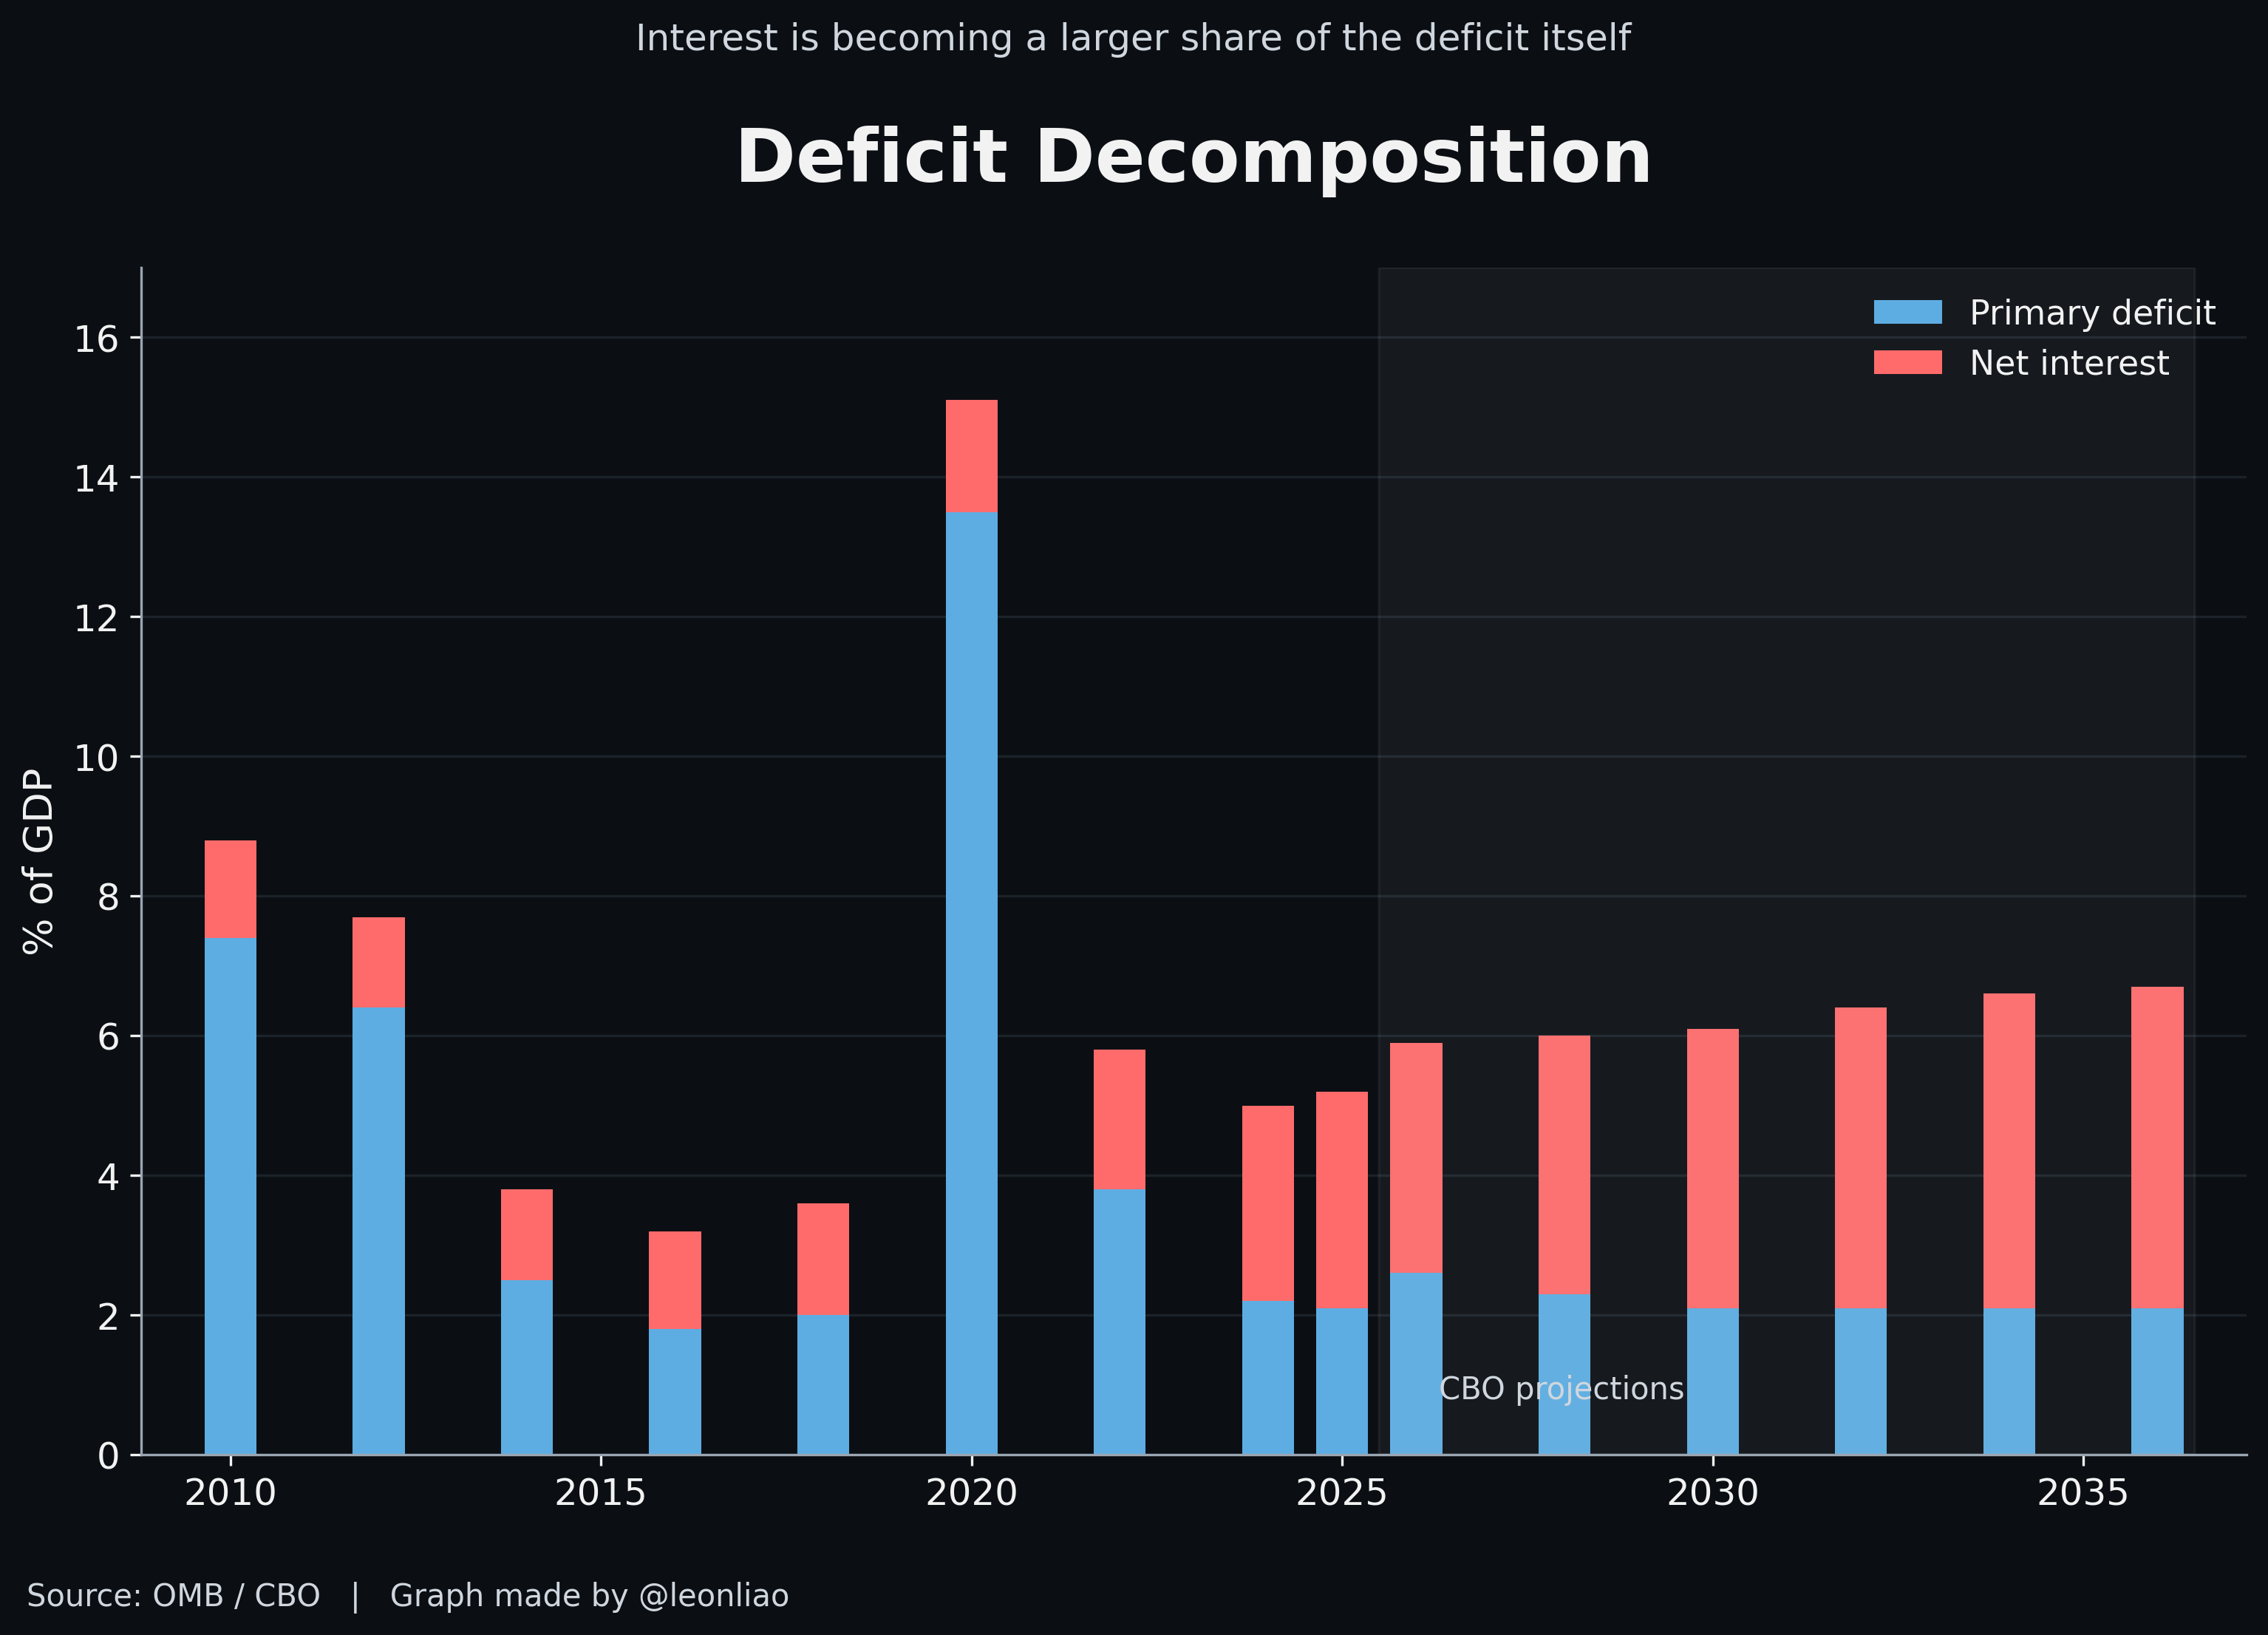
The fiscal deficit has two components:
Fiscal deficit = primary deficit + net interest
The split matters because the two halves carry entirely different policy implications. The primary deficit reflects current decisions about taxing and spending, and Congress can in principle adjust it. Net interest reflects the accumulated consequences of past decisions and is close to unadjustable in the present. America’s difficulty is that both halves are deteriorating at the same time.
The conventional fiscal cycle runs like this: recession depresses revenue and lifts spending, the deficit widens; recovery restores the tax base and the emergency measures expire, and the deficit narrows on its own. On that logic, waiting for a strong enough economy solves the problem.
The current data do not fit the pattern. The CBO projects a federal deficit of 5.8% of GDP in 2026 and 6.7% in 2036, while projecting unemployment below 5% in every year from 2026 to 2036. These are not recession deficits. They are deficits run close to full employment.
The historical comparison makes the contrast sharper. Between 1976 and 2025 there were fourteen years in which unemployment was below 5%. Across those fourteen years the primary deficit averaged just 0.5% of GDP and the total deficit 2.6%. In good years, in other words, American public finance ran close to balance and the deficit consisted mostly of interest. The 2026 primary deficit is already 2.6% of GDP, precisely the level of the total deficit in those historically good years, and the ten-year average stays around 2.1%.
So this is no longer a cycle of recession, deficit, recovery and normalization. Near-full employment, a persistent primary deficit and a record interest burden now occur in the same year.
The changing composition of the deficit shows where this leads. Of the 5.8% of GDP deficit in 2026, 2.6 points are primary and 3.3 points are net interest. Past borrowing now accounts for more than half of the American fiscal deficit. By 2036 the primary deficit falls to 2.1 points while net interest rises to 4.6, at which point close to 70% of the annual deficit corresponds to debt service.
This is the textbook debt-service feedback loop: interest widens the deficit, the deficit requires issuance, issuance enlarges the stock, and the stock pushes interest higher again. What is different is that the loop used to appear in textbooks and emerging-market case studies, and now appears in America’s own baseline projections.
Behind the loop sits an older test: the relationship between the government’s effective borrowing cost r and nominal GDP growth g. America sustained high debt for decades in large part because nominal growth persistently exceeded the average cost of the debt, and g > r diluted the debt ratio even while deficits ran. As the effective rate climbs and nominal growth returns to normal, the direction of that inequality becomes less secure; once r > g, the primary surplus required to stabilize the debt ratio rises quickly to levels no Congress would legislate. The United States has not clearly crossed that line.
The Treasury does not merely roll over old debt each year. It also has to find genuinely new money in the market.
Its July 2026 survey of primary dealers put the median forecast for privately held net marketable borrowing at $2.01 trillion in fiscal 2026, $2.11 trillion in 2027 and $2.20 trillion in 2028. That is net issuance alone, excluding the far larger volume of maturing debt to be refinanced. Over a longer horizon, the CBO projects that debt held by the public must rise by a cumulative $26 trillion between the end of 2025 and the end of 2036, reaching roughly $56 trillion, or 120% of GDP.
Bessent’s staff therefore manage two pressures at once: a vast stock repricing continuously, and close to or above $2 trillion of new market funding required every year. Looking at only one of them understates how hard the question of whether America can withstand higher rates actually is.
The CBO priced the sensitivity directly in April 2026. If every Treasury rate ran ten basis points above baseline in each year from 2027 to 2036, with nothing else changing, cumulative additional deficits over the decade would come to $379 billion: $323 billion from higher interest costs on baseline debt, plus $60 billion of second-order interest generated by the extra borrowing that the extra interest requires. The CBO notes that the relationship scales roughly linearly for deviations of up to about one percentage point in either direction.
As an approximation, that gives:
a sustained 50bp increase → roughly $1.9 trillion in additional ten-year deficits
a sustained 100bp increase → roughly $3.8 trillion
These are not point forecasts. But $3.8 trillion is the scale of a major tax package, the kind of measure that consumes a president’s first year, requires 218 votes in the House and 60 in the Senate, and gets litigated in every midterm afterward. A hundred basis points requires no vote at all.
The gap that already exists between baseline and reality is worth holding onto here. The CBO’s baseline puts the ten-year Treasury yield at around 4.1% for 2026; on August 19 the actual level was 4.65%. That does not imply a 55bp gap for the next decade, since the error bands around rate forecasts are far wider than that, but it does establish that the market is currently running above baseline — and every uncomfortable calculation above was derived inside the baseline.
American public finance is becoming less able to bear high interest rates, and the constraint has begun to appear. It is still not a fiscal crisis. The United States retains formidable taxing capacity, full monetary sovereignty and the deepest government bond market in the world, and no yield figure triggers a collapse on contact. Forecasts built around a crash overstate the near-term risk while understating the nature of the long-term problem.
What has changed is that a set of conditions rarely seen together now hold simultaneously. Net interest as a share of GDP has broken through its highs of the past eighty years. Net interest as a share of revenue has returned to and passed the 1991 peak. About half of all Treasury debt reprices within roughly two and a half years. And the primary deficit sits near 2% of GDP even with unemployment below 5%.
Can America afford its debt? Over any meaningful horizon the answer is yes, which is why the question yields so little. The question worth asking is this:
How high can Treasury yields remain, and for how long, before debt service begins materially constraining Washington?
Nobody has to wait for a future date to find out. Appropriators, taxpayers and bondholders are already living inside the answer: the share of federal revenue absorbed by interest rises every year, low-coupon legacy debt reprices continuously, and annual net financing shows no sign of shrinking.
If that judgment holds, Bessent’s Treasury should already show observable changes in behavior:
Issuance tilting toward the front end to hold down current costs, at the price of pushing interest-rate risk into the future; a management toolkit extending from issuance alone into buybacks; a secretary who talks about long-end yields more often and more specifically than his predecessors did.
Whether those changes have in fact occurred, and whether they amount to de facto quasi-yield management, is the subject of the second piece in this series.
The direction, though, can be stated now. When the world’s largest debt issuer starts watching its own cost of funds, every other borrower’s rates sit downstream of that decision. The American bond market used to export financial conditions to the world. It has started importing constraints to Washington.
The $4 billion buyback expansion of August 19 changed nothing in itself. It simply let the market see a constraint that was already there.
Read more
No posts
Comments
Nothing yet. Say the first thing.
Sign in to join the conversation.