
The Climate Engine API has various impactful raster calculation endpoints that have been co-developed through partnerships with teams from the National Oceanic and Atmospheric Administration (NOAA). These endpoints provide insight into topics like drought severity, vegetation status and trend, heat persistence, and more. This gives users a way to move beyond raw data values and understand how current conditions compare to historical patterns across a landscape. The flexibility of the calculations you can compute combined with the large dataset catalog available makes the Climate Engine API a powerful tool for analyzing climate and remote sensing data. In this article, we'll cover what each of these endpoints generates and provide example API calls to help you get started.
Values - Returns the values of the dataset variable. See full documentation here.
Climatologies - Returns the average values of the dataset variable for a specific time period. See full documentation here.
Anomalies - Returns the difference of the dataset values for a specific time period from average conditions. Can also be calculated as a percent of or percent change. See full documentation here.
Percentiles - Returns a percentile value from 0-100 for a dataset variable within the historical climatology distribution for a given time period. See full documentation here.
Ranks - Returns a rank value for a dataset variable across a specified period. See full documentation here.
Standard Index - Returns a drought index for a dataset variable. See full documentation here.
Mann Kendall - Returns the trend values for a dataset variable for a specific time period. See full documentation here.
Counts - Returns a map of the counts/probabilities that a pixel met the selected threshold, i.e. gt, gte, lt, lte, interior, exterior., between a start and end date for a dataset variable. See full documentation here.
Date Threshold - Returns a map of the dates that the given threshold value was met between a start and end date for a dataset variable. See full documentation here.
Degree Days – Returns a map of heating degree or cooling degree days for a dataset variable. See full documentation here.
Growing Degree Days - Returns a map of growing degree days for a dataset variable. See full documentation here.
For these examples, we will use the mapid endpoints which return tiled XYZ layers. They are structured similarly to the raster endpoints, which export GeoTiffs to Google Cloud Storage buckets, and can be used to visualize the raster calculations in a Colab Notebook using mapping packages like Folium. You can find the example notebook here. To use the API, you will need an API key. You can request a quota-limited key following these directions, or connect your earth engine account to Climate Engine to create your own non-quota limited key following these directions.
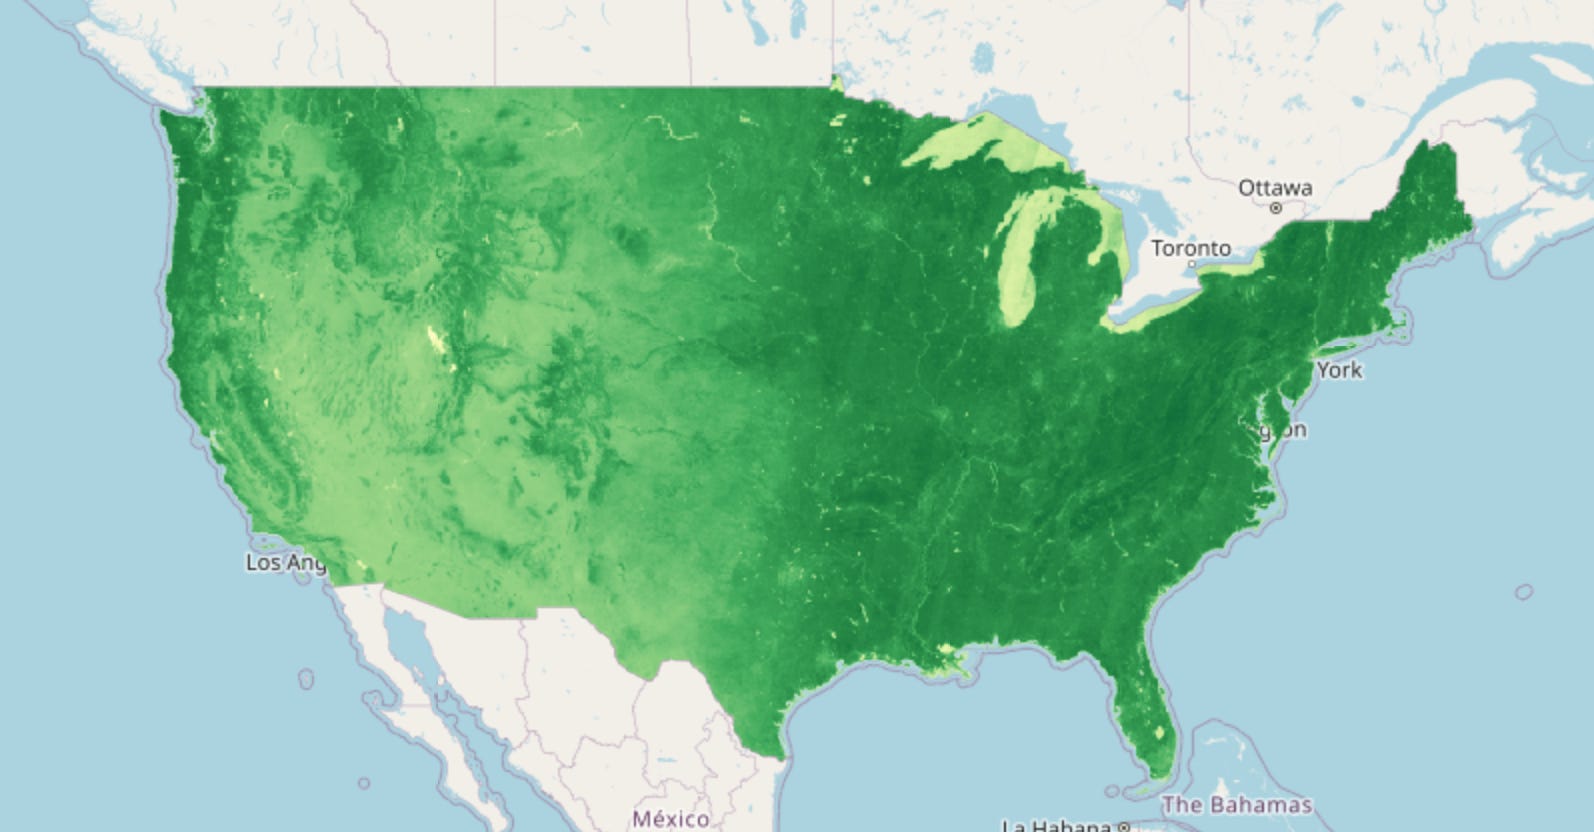
This code sends a request to the raster/mapid/values endpoint to generate a tiled map layer of NDVI (Normalized Difference Vegetation Index) values from the RAP_NDVI dataset. The parameters specify the median NDVI statistic over a summer date range (June 1 to August 31, 2025), along with a colormap configuration setting the value range from -1 to 1, an opacity of 0.7, and a continuous color scale. After sending the request, the response is printed and parsed as JSON, and the tile_fetcher object is extracted, which can then be used to retrieve and display the resulting tiled map layer.
#Select values endpoint #Set up parameters dictionary for API call # Send API request#Set up for API Requests
endpoint_1 = ‘raster/mapid/values’
params_1 = {
‘dataset’: ‘RAP_NDVI’,
‘variable’: ‘NDVI’,
‘temporal_statistic’: ‘median’,
‘start_date’: ‘2025-06-01’,
‘end_date’: ‘2025-08-31’,
‘colormap_min_max’: ‘[-1, 1]’,
‘colormap_opacity’: ‘0.7’,
‘colormap_type’: ‘continuous’
}
r1 = requests.get(root_url + endpoint_1, params=params_1, headers=headers, verify=False)
print(r1.content)
tf1 = r1.json()[’Data’][’tile_fetcher’]
Output:
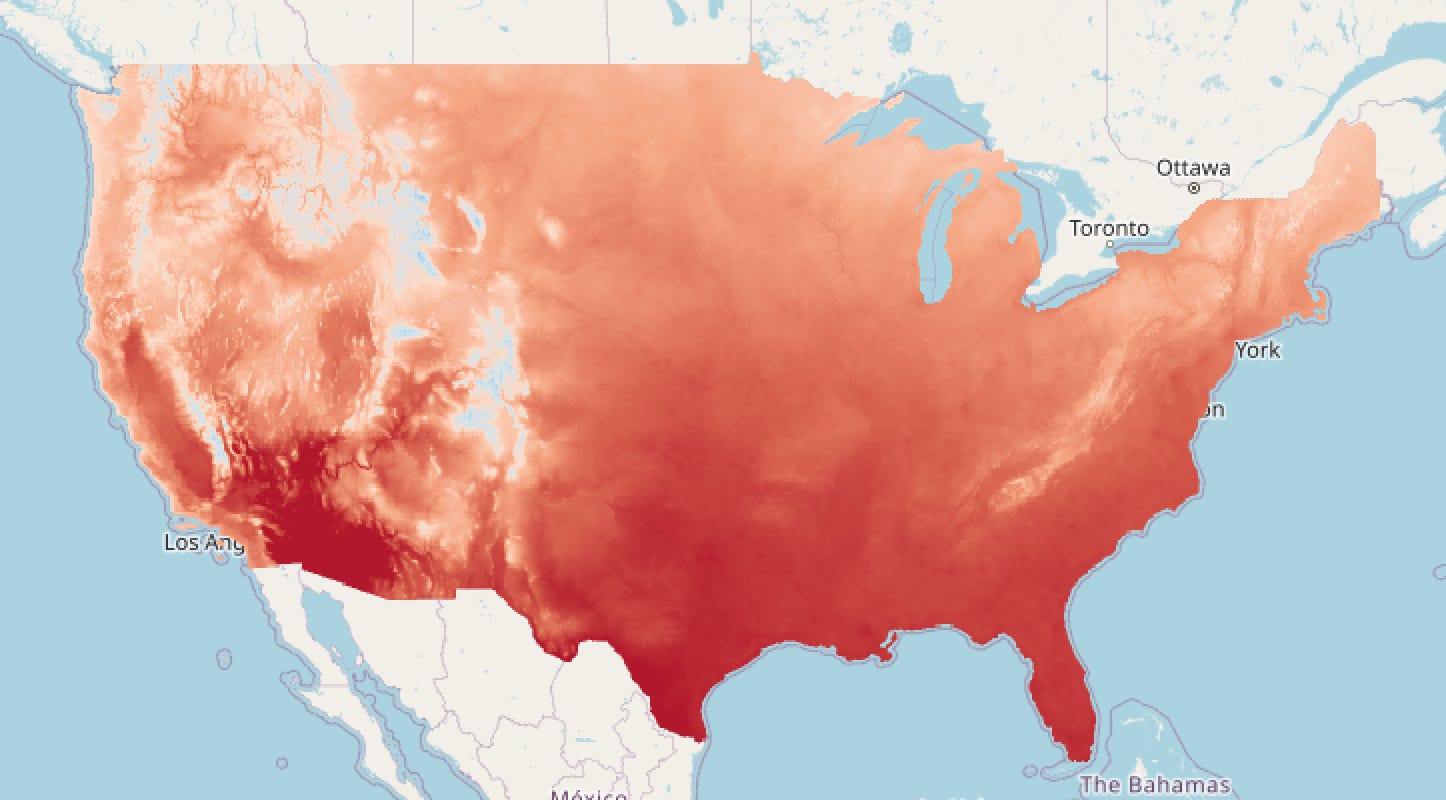
This code sends a request to the raster/mapid/climatologies endpoint to generate a tiled map layer showing mean temperature (tmean) climatology from the GRIDMET dataset. The parameters specify the mean statistic calculated over a summer seasonal window from June 1 to August 31, evaluated against a historical baseline period spanning 1990 to 2020. A colormap configuration sets the value range from negative 10 to 30, an opacity of 0.7, and a continuous color scale. After sending the request, the response is printed and parsed as JSON, and the tile_fetcher object is extracted from within the Data field, which can then be used to retrieve and display the resulting climatology map.
#Select climatologies endpoint #Set up parameters dictionary for API call # Send API request#Set up for API Requests
endpoint_2 = ‘raster/mapid/climatologies’
params_2 = {
‘dataset’: ‘GRIDMET’,
‘variable’: ‘tmean’,
‘temporal_statistic’: ‘mean’,
‘start_season’: ‘06-01’,
‘end_season’: ‘08-31’,
‘start_year’: ‘1990’,
‘end_year’: ‘2020’,
‘colormap_min_max’: ‘[-10, 30]’,
‘colormap_opacity’: ‘0.7’,
‘colormap_type’: ‘continuous’
}
r2 = requests.get(root_url + endpoint_2, params=params_2, headers=headers, verify=False)
print(r2.content)
tf2 = r2.json()[’Data’][’tile_fetcher’]
Output:
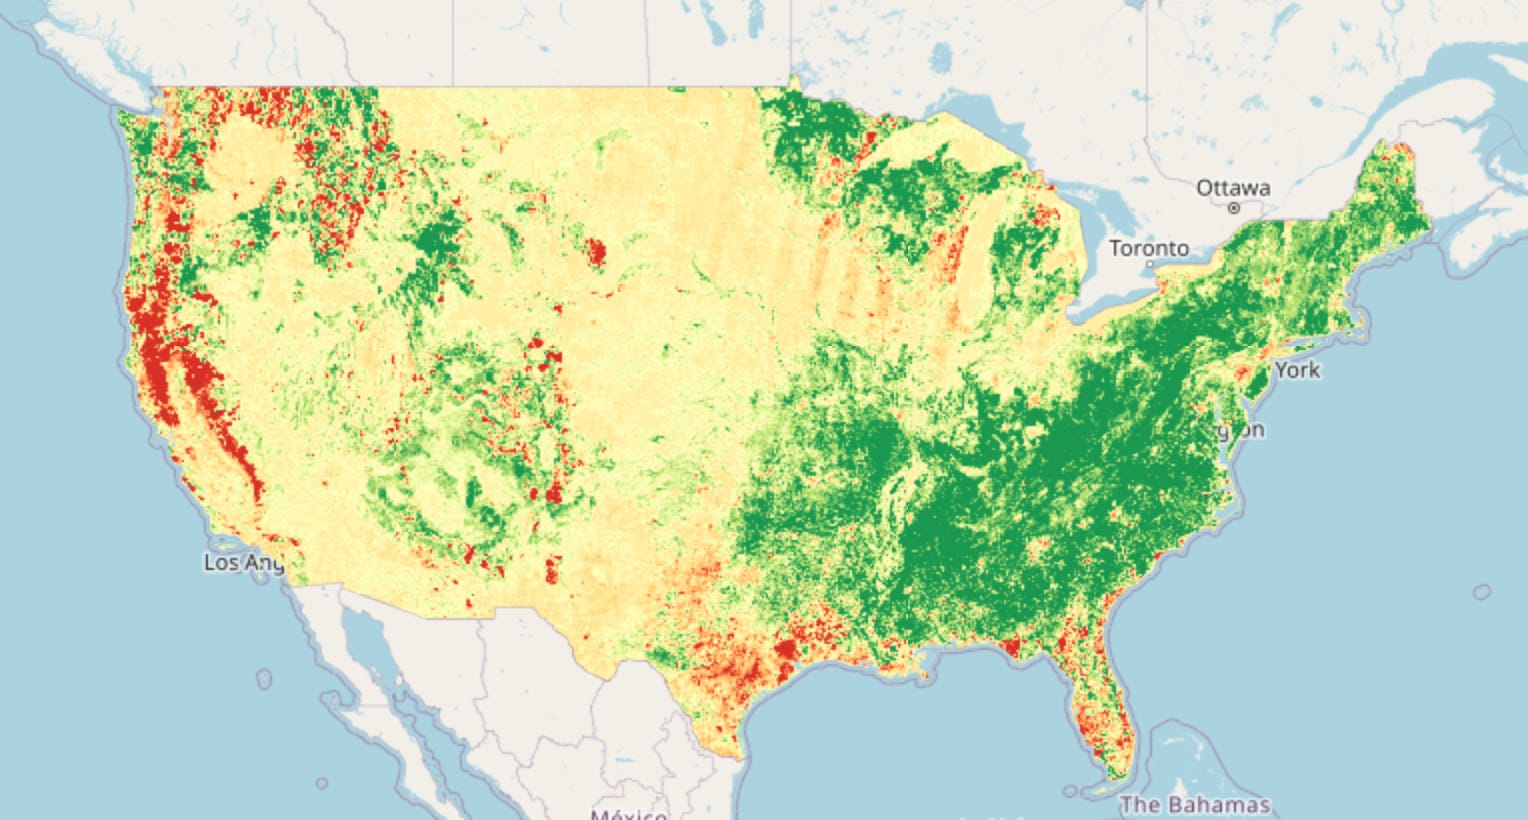
This code sends a request to the raster/mapid/anomalies endpoint to generate a tiled map layer showing anomalies in tree cover (variable TRE) from the RAP_COVER dataset. The parameters specify the mean statistic calculated as an anomaly over the full 2025 calendar year, compared against a historical baseline period spanning 1990 to 2020. A colormap configuration sets the value range from negative ten to ten, an opacity of 0.7, and a continuous color scale. After sending the request, the response is printed and parsed as JSON, and the tile_fetcher object is extracted from within the Data field, which can then be used to retrieve and display the resulting anomaly map.
#Select anomalies endpoint #Set up parameters dictionary for API call # Send API request#Set up for API Requests
endpoint_3 = ‘raster/mapid/anomalies’
params_3 = {
‘dataset’: ‘RAP_COVER’,
‘variable’: ‘TRE’,
‘temporal_statistic’: ‘mean’,
‘calculation’: ‘anom’,
‘start_date’: ‘2025-01-01’,
‘end_date’: ‘2025-12-31’,
‘start_year’: ‘1990’,
‘end_year’: ‘2020’,
‘colormap_min_max’: ‘[-10, 10]’,
‘colormap_opacity’: ‘0.7’,
‘colormap_type’: ‘continuous’
}
r3 = requests.get(root_url + endpoint_3, params=params_3, headers=headers, verify=False)
print(r3.content)
tf3 = r3.json()[’Data’][’tile_fetcher’]
Output:
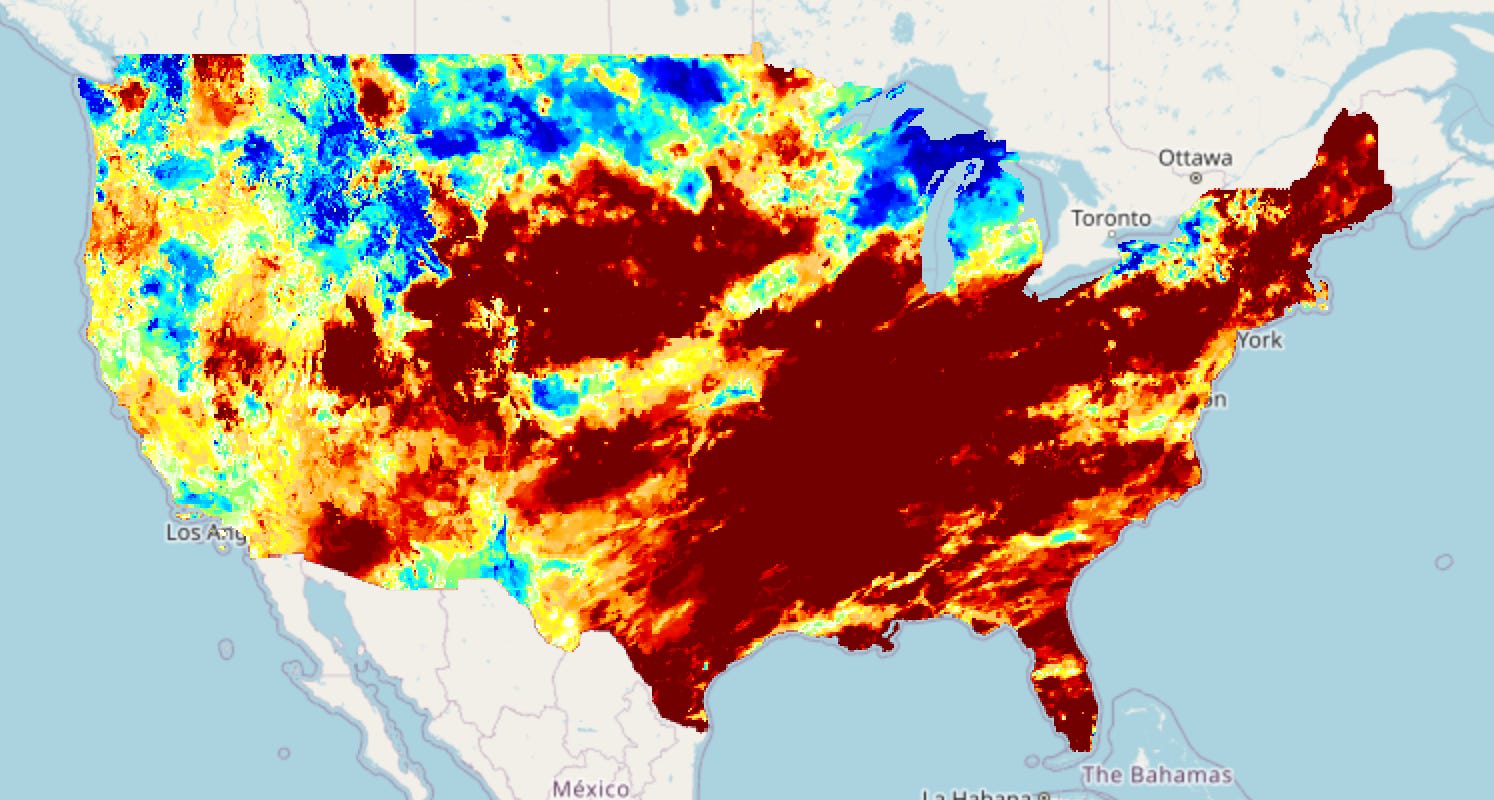
This code sends a request to the raster/mapid/percentiles endpoint to generate a tiled map layer showing precipitation percentiles (variable pr) from the GRIDMET dataset. The parameters specify the total precipitation statistic summed over a winter period spanning December 1, 2025 to February 28, 2026, evaluated against a historical baseline period spanning 1990 to 2020. A colormap configuration sets the value range from 0 to 100, matching the percentile scale, an opacity of 0.7, and a continuous color scale. After sending the request, the response is printed and parsed as JSON, and the tile_fetcher object is extracted from within the Data field, which can then be used to retrieve and display the resulting percentile map.
#Select percentiles endpoint #Set up parameters dictionary for API call # Send API request#Set up for API Requests
endpoint_4 = ‘raster/mapid/percentiles’
params_4 = {
‘dataset’: ‘GRIDMET’,
‘variable’: ‘pr’,
‘temporal_statistic’: ‘total’,
‘start_date’: ‘2025-12-01’,
‘end_date’: ‘2026-02-28’,
‘start_year’: ‘1990’,
‘end_year’: ‘2020’,
‘colormap_min_max’: ‘[0, 100]’,
‘colormap_opacity’: ‘0.7’,
‘colormap_type’: ‘continuous’
}
r4 = requests.get(root_url + endpoint_4, params=params_4, headers=headers, verify=False)
print(r4.content)
tf4 = r4.json()[’Data’][’tile_fetcher’]
Output:
This code sends a request to the raster/mapid/ranks endpoint to generate a tiled map layer showing ranks for maximum temperature from the GRIDMET dataset. The parameters specify the median statistic over a summer period spanning June 1 to August 31, 2025, evaluated against a historical baseline period spanning 1990 to 2020. A custom colormap palette is applied, ranging from pale yellow through orange to dark red, with the value range set from 0 to 31, an opacity of 0.7, and a continuous color scale. After sending the request, the response is printed and parsed as JSON, and the tile_fetcher object is extracted from within the Data field, which can then be used to retrieve and display the resulting rank map.
#Select the ranks endpoint #Set up parameters dictionary for API call # Send API request#Set up for API Requests
endpoint_5 = ‘raster/mapid/ranks’
params_5 = {
‘dataset’: ‘GRIDMET’,
‘variable’: ‘tmmx’,
‘temporal_statistic’: ‘median’,
‘start_date’: ‘2025-06-01’,
‘end_date’: ‘2025-08-31’,
‘start_year’: ‘1990’,
‘end_year’: ‘2020’,
‘colormap_palette’: ‘[”#ffffcc”,”#ffeda0”,”#fed976”,”#feb24c”,”#fd8d3c”,”#fc4e2a”,”#e31a1c”,”#bd0026”,”#800026”]’,
‘colormap_min_max’: ‘[0, 31]’,
‘colormap_opacity’: ‘0.7’,
‘colormap_type’: ‘continuous’
}
r5 = requests.get(root_url + endpoint_5, params=params_5, headers=headers, verify=False)
print(r5.content)
tf5 = r5.json()[’Data’][’tile_fetcher’]
Output:
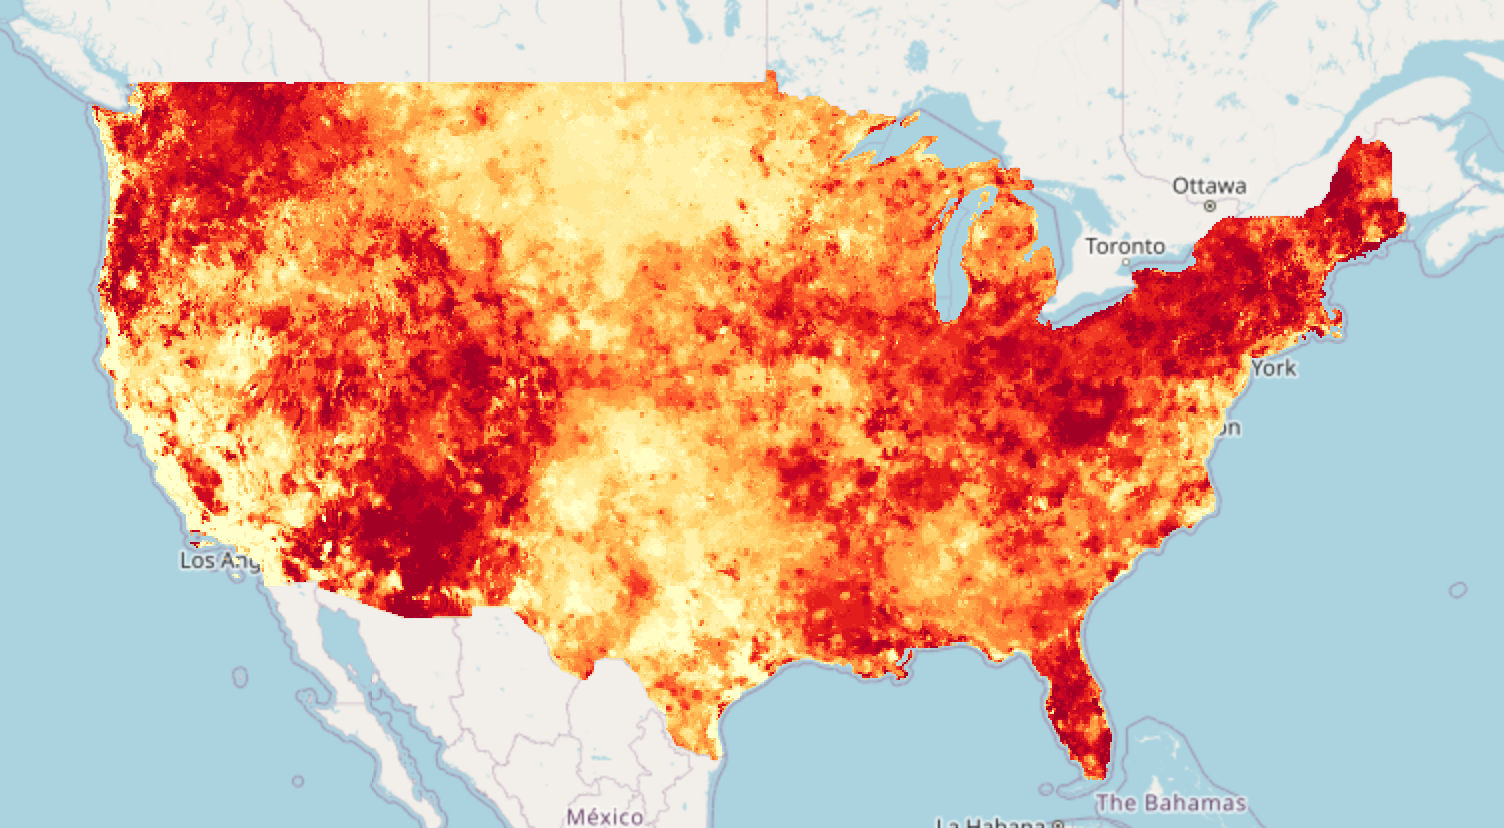
This code sends a request to the raster/mapid/standard_index endpoint to generate a tiled map layer showing the Standardized Precipitation Index (SPI) from the PRISM dataset. The parameters specify the total statistic over a one month period from June 1 to July 1, 2026, evaluated against a historical baseline period spanning 1990 to 2020. A colormap configuration sets the value range from -2.5 to 2.5, an opacity of 0.7, and a continuous color scale. After sending the request, the response is printed and parsed as JSON, and the tile_fetcher object is extracted from within the Data field, which can then be used to retrieve and display the resulting standardized index map.
#Select Standard Index endpoint #Set up parameters dictionary for API call # Send API request#Set up for API Requests
endpoint_6 = ‘raster/mapid/standard_index’
params_6 = {
‘dataset’: ‘PRISM’,
‘variable’: ‘spi’,
‘temporal_statistic’: ‘total’,
‘start_date’: ‘2026-06-01’,
‘end_date’: ‘2026-07-01’,
‘start_year’: ‘1990’,
‘end_year’: ‘2020’,
‘colormap_min_max’: ‘[-2.5, 2.5]’,
‘colormap_opacity’: ‘0.7’,
‘colormap_type’: ‘continuous’
}
r6 = requests.get(root_url + endpoint_6, params=params_6, headers=headers, verify=False)
print(r6.content)
tf6 = r6.json()[’Data’][’tile_fetcher’]
Output:
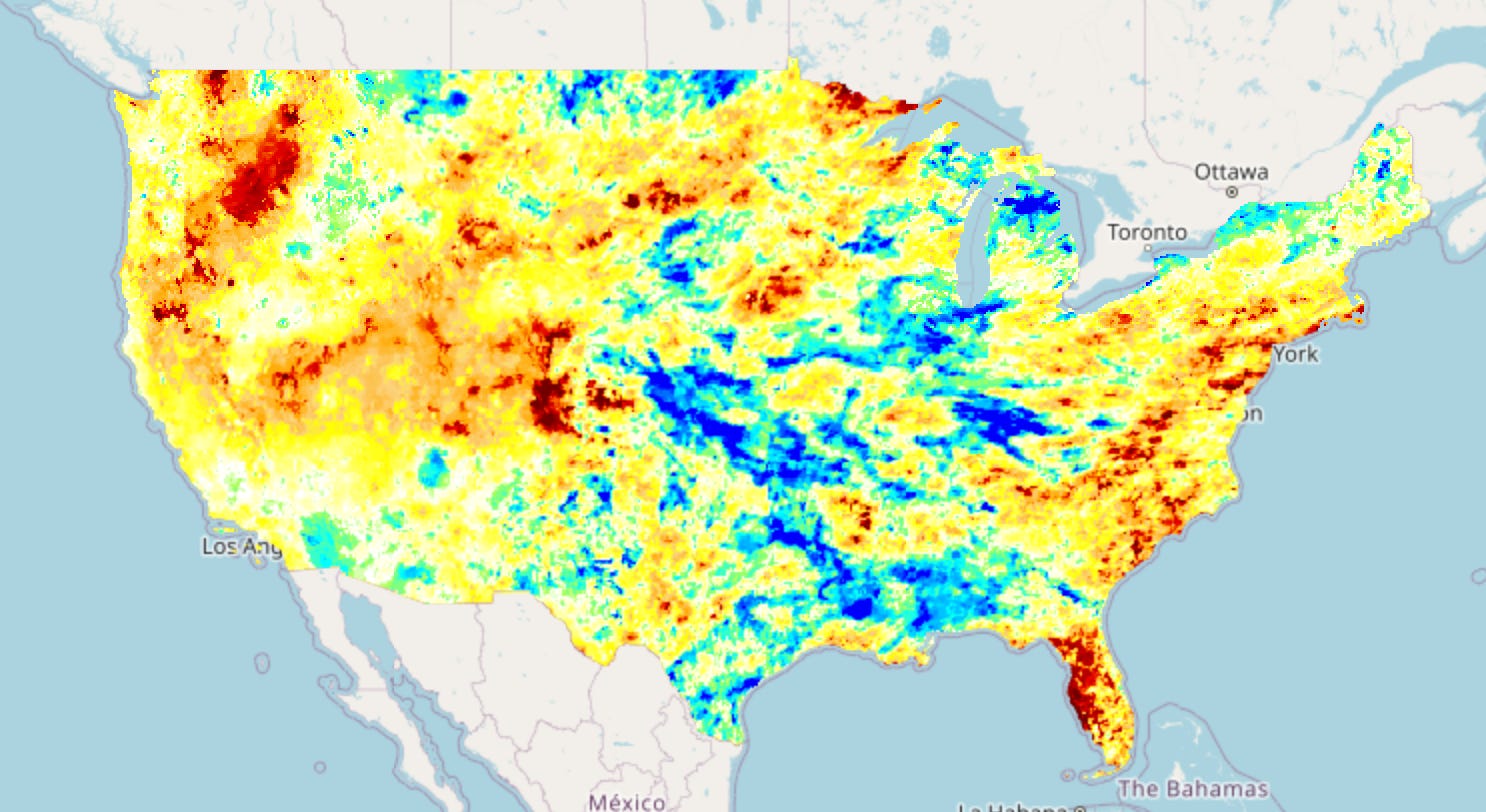
This code sends a request to the raster/mapid/mann_kendall endpoint to generate a tiled map layer showing trend results for rangeland tree cover from the RCMAP dataset. The parameters specify a mean statistic with the calculation set to mk_sen (sen’s slope) over a full year seasonal window (January 1 to December 31) across years 1990 to 2024. A colormap configuration sets the value range from -0.5 to 0.5, an opacity of 0.7, and a continuous color scale. After sending the request, the response is printed and parsed as JSON, and the tile_fetcher object is extracted from within the Data field, which can then be used to retrieve and display the resulting trend map.
#Select mann kendall endpoint #Set up parameters dictionary for API call # Send API request#Set up for API Requests
endpoint_7 = ‘raster/mapid/mann_kendall’
params_7 = {
‘dataset’: ‘RCMAP’,
‘variable’: ‘rangeland_tree’,
‘temporal_statistic’: ‘mean’,
‘calculation’: ‘mk_sen’,
‘start_season’: ‘01-01’,
‘end_season’: ‘12-31’,
‘start_year’: ‘1990’,
‘end_year’: ‘2024’,
‘p_value’: ‘1’,
‘colormap_min_max’: ‘[-0.5, 0.5]’,
‘colormap_opacity’: ‘0.7’,
‘colormap_type’: ‘continuous’
}
r7 = requests.get(root_url + endpoint_7, params=params_7, headers=headers, verify=False)
print(r7.content)
tf7 = r7.json()[’Data’][’tile_fetcher’]
Output:
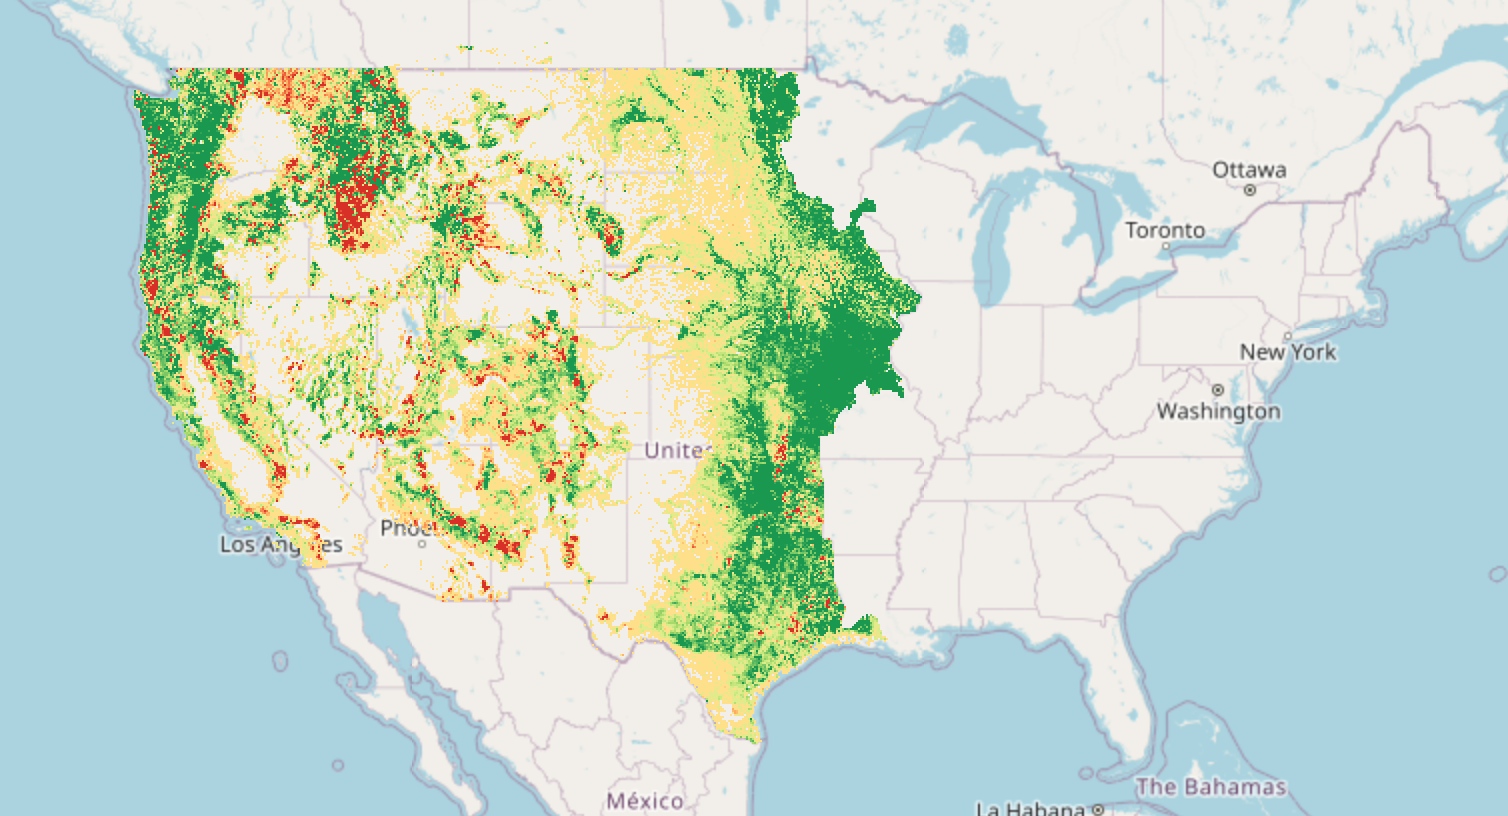
This code sends a request to the raster/mapid/counts endpoint to generate a tiled map layer showing the probability of extreme heat stress conditions, using utci_mean (Universal Thermal Climate Index) from the ERA5_HEAT dataset. The operator is set to threshold_gte with a value_1 of 32, so the calculation determines how often UTCI values met or exceeded that threshold across the date range, expressed as a probability (the count divided by the total number of data points considered) rather than a raw count. The date range spans the full 2025 calendar year, from January 1 to December 31. A custom colormap palette is applied, ranging from pale yellow through orange to dark red, with the value range set from 0 to 0.5, an opacity of 0.7, and a continuous color scale. After sending the request, the response is printed and parsed as JSON, and the tile_fetcher object is extracted from within the Data field, which can then be used to retrieve and display the resulting probability map.
#Select counts endpoint #Set up parameters dictionary for API call # Send API request#Set up for API Requests
endpoint_8 = ‘raster/mapid/counts’
params_8 = {
‘dataset’: ‘ERA5_HEAT’,
‘variable’: ‘utci_mean’,
‘operator’: ‘threshold_gte’,
‘value_1’: ‘32’,
‘output’: ‘probability’,
‘start_date’: ‘2025-01-01’,
‘end_date’: ‘2025-12-31’,
‘colormap_palette’: ‘[”#ffffcc”, “#ffeda0”, “#fed976”, “#feb24c”, “#fd8d3c”, “#fc4e2a”, “#e31a1c”, “#bd0026”, “#800026”]’,
‘colormap_min_max’: ‘[0, 0.5]’,
‘colormap_opacity’: ‘0.7’,
‘colormap_type’: ‘continuous’
}
r8 = requests.get(root_url + endpoint_8, params=params_8, headers=headers, verify=False)
print(r8.content)
tf8 = r8.json()[’Data’][’tile_fetcher’]
Output:

This code sends a request to the raster/mapid/date_threshold endpoint to generate a tiled map layer for the LST_Day_1km variable (land surface temperature) from the VIIRS_DAILY dataset. The operator is set to threshold_max with an occurrence of first. The date range spans January 1 to December 31, 2025. A custom colormap palette is applied, ranging from pale blue through teal to dark green, with the colormap range set using timestamps corresponding to January 1, 2025 and December 31, 2025. Additional colormap settings include an opacity of 0.7 and a continuous color scale. After sending the request, the response is printed and parsed as JSON, and the tile_fetcher object is extracted from within the Data field, which can then be used to retrieve and display the resulting date threshold map.
#Select date threshold endpoint #Set up parameters dictionary for API call # Send API request#Set up for API Requests
endpoint_9 = ‘raster/mapid/date_threshold’
params_9 = {
‘dataset’: ‘VIIRS_DAILY’,
‘variable’: ‘LST_Day_1km’,
‘operator’: ‘threshold_max’,
‘occurrence’: ‘first’,
‘start_date’: ‘2025-01-01’,
‘end_date’: ‘2025-12-31’,
‘colormap_palette’: ‘[”#fff7fb”,”#ece2f0”,”#d0d1e6”,”#a6bddb”,”#67a9cf”,”#3690c0”,”#02818a”,”#016c59”,”#014636”]’,
‘colormap_min_max’: ‘[1735689600000, 1767139200000]’,
‘colormap_opacity’: ‘0.7’,
‘colormap_type’: ‘continuous’
}
r9 = requests.get(root_url + endpoint_9, params=params_9, headers=headers, verify=False)
print(r9.content)
tf9 = r9.json()[’Data’][’tile_fetcher’]
Output:
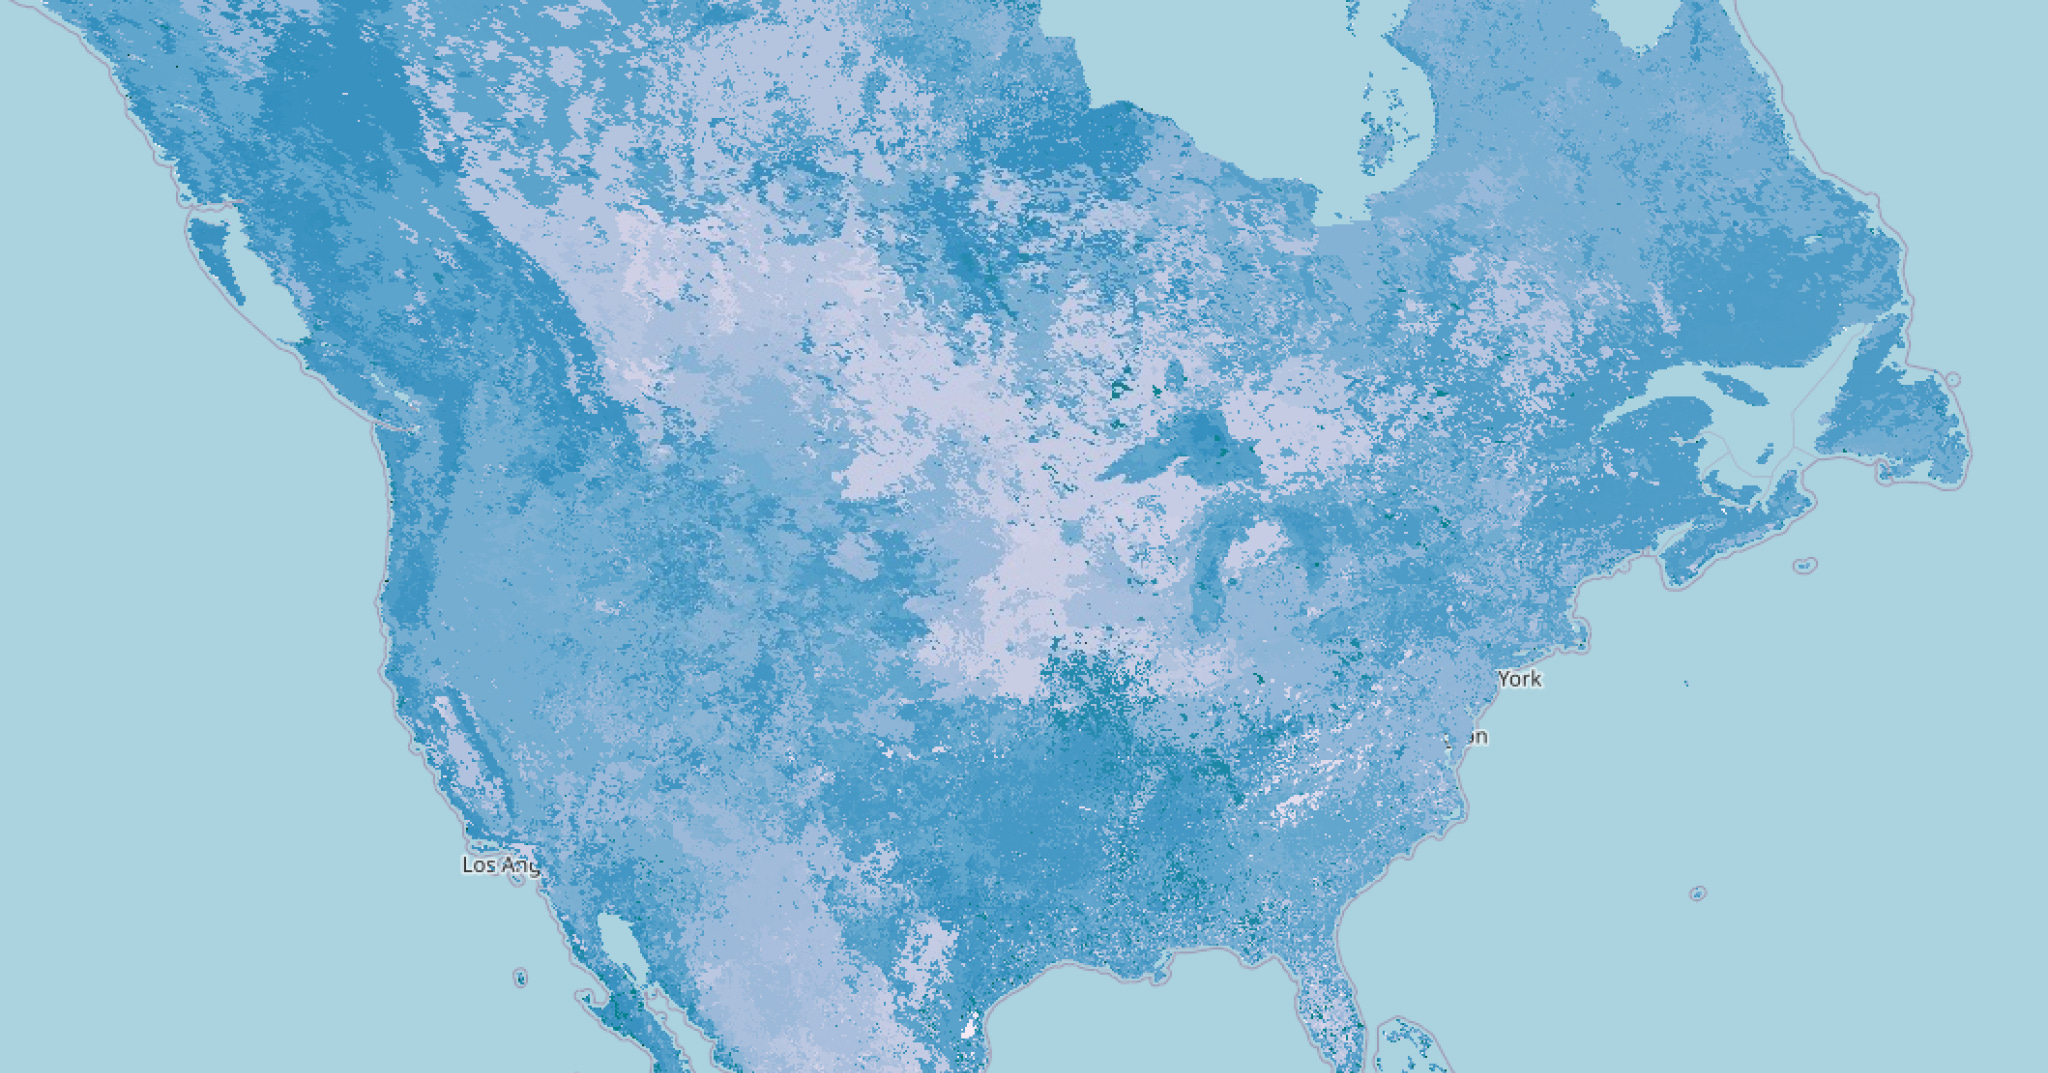
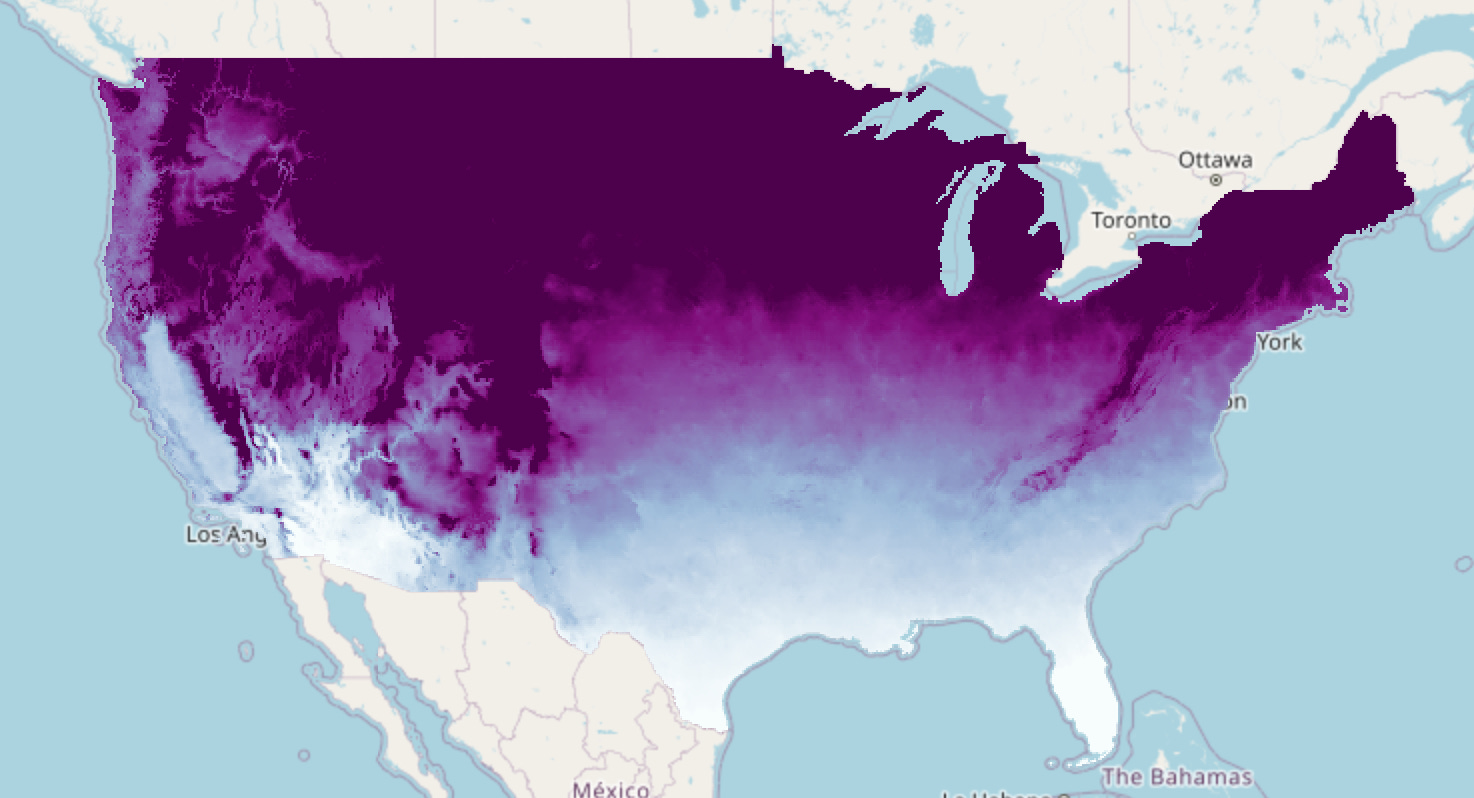
This code sends a request to the raster/mapid/degree_days endpoint to generate a tiled map layer of heating degree days from the PRISM dataset, using mean temperature as the input variable. A base value of 18.3 is used in the degree day calculation. The date range spans the full 2025 calendar year, from January 1 to December 31. A custom colormap palette is applied, ranging from pale blue through purple to dark violet, with the value range set from 0 to 3600, an opacity of 0.7, and a continuous color scale. After sending the request, the response is printed and parsed as JSON, and the tile_fetcher object is extracted from within the Data field, which can then be used to retrieve and display the resulting degree days map.
#Select degree days endpoint #Set up parameters dictionary for API call # Send API request#Set up for API Requests
endpoint_10 = ‘raster/mapid/degree_days’
params_10 = {
‘dataset’: ‘PRISM’,
‘variable’: ‘tmean’,
‘dd_type’: ‘hdd’,
‘value’: ‘18.3’,
‘start_date’: ‘2025-01-01’,
‘end_date’: ‘2025-12-31’,
‘colormap_palette’: ‘[”#f7fcfd”, “#e0ecf4”, “#bfd3e6”, “#9ebcda”, “#8c96c6”, “#8c6bb1”, “#88419d”, “#810f7c”, “#4d004b”]’,
‘colormap_min_max’: ‘[0, 3600]’,
‘colormap_opacity’: ‘0.7’,
‘colormap_type’: ‘continuous’
}
r10 = requests.get(root_url + endpoint_10, params=params_10, headers=headers, verify=False)
print(r10.content)
tf10 = r10.json()[’Data’][’tile_fetcher’]
Output:
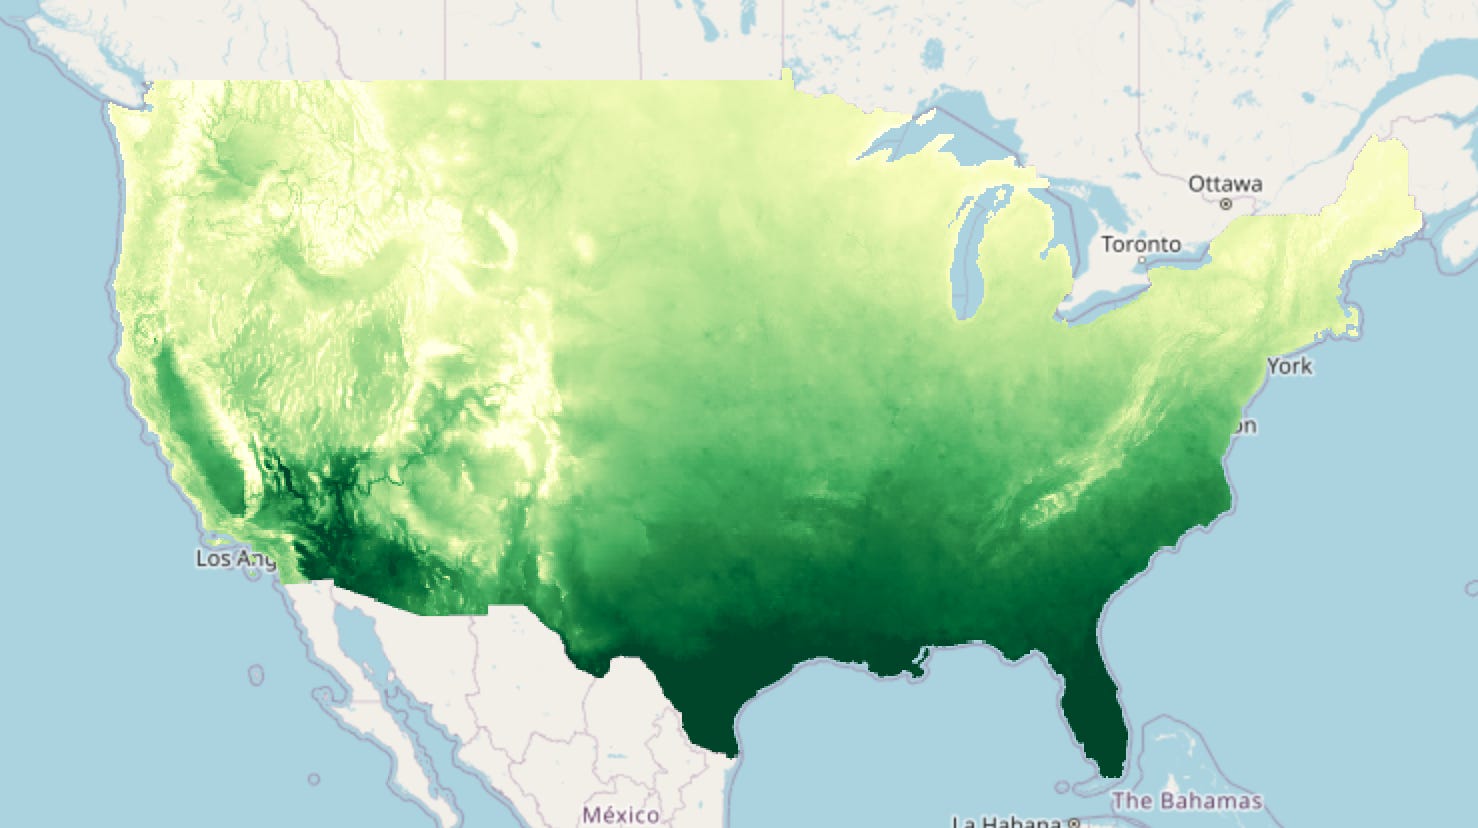
This code sends a request to the raster/mapid/growing_degree_days endpoint to generate a tiled map layer of growing degree days from the GRIDMET dataset, using tmmx and tmmn as the maximum and minimum temperature variables. A base threshold of 10 and a cutoff threshold of 30 define the temperature range used in the growing degree day calculation. The date range spans March 1 to June 20, 2025. A custom colormap palette is applied, ranging from pale yellow through green to dark green, with the value range set from 0 to 1400, an opacity of 0.7, and a continuous color scale. After sending the request, the response is printed and parsed as JSON, and the tile_fetcher object is extracted from within the Data field, which can then be used to retrieve and display the resulting growing degree days map.
#Select growing degree days endpoint #Set up parameters dictionary for API call # Send API request#Set up for API Requests
endpoint_11 = ‘raster/mapid/growing_degree_days’
params_11 = {
‘dataset’: ‘GRIDMET’,
‘variable_tmax’: ‘tmmx’,
‘variable_tmin’: ‘tmmn’,
‘base_threshold’: ‘10’,
‘cutoff_threshold’: ‘30’,
‘start_date’: ‘2025-03-01’,
‘end_date’: ‘2025-06-20’,
‘colormap_palette’: ‘[”#ffffe5”, “#f7fcb9”, “#d9f0a3”, “#addd8e”, “#78c679”, “#41ab5d”, “#238443”, “#006837”, “#004529”]’,
‘colormap_min_max’: ‘[0, 1400]’,
‘colormap_opacity’: ‘0.7’,
‘colormap_type’: ‘continuous’
}
r11 = requests.get(root_url + endpoint_11, params=params_11, headers=headers, verify=False)
print(r11.content)
tf11 = r11.json()[’Data’][’tile_fetcher’]
Output:
No posts
Comments
Nothing yet. Say the first thing.
Sign in to join the conversation.