
In round one, we focused on events across the US [see article here]; this time, we’re looking beyond US borders to explore how these tools apply worldwide. The Climate Engine app offers a range of calculations that reveal how specific events unfold. For example, comparing a given time period against a longer historical record helps identify anomalous values that may be driving impacts on the ground. As with Round 1, we’re pairing each map with the dataset and calculation used, so you can reproduce it yourself. Paired with a catalog of more than 100 datasets, these calculations make the Climate Engine platform a powerful tool for exploratory data analysis. Note: these are high-level snapshots meant to spark exploration, not full attributions of any single event. Deeper analysis would be needed to fully capture the dynamics behind each one.
June 2026 Heat Wave Across Europe
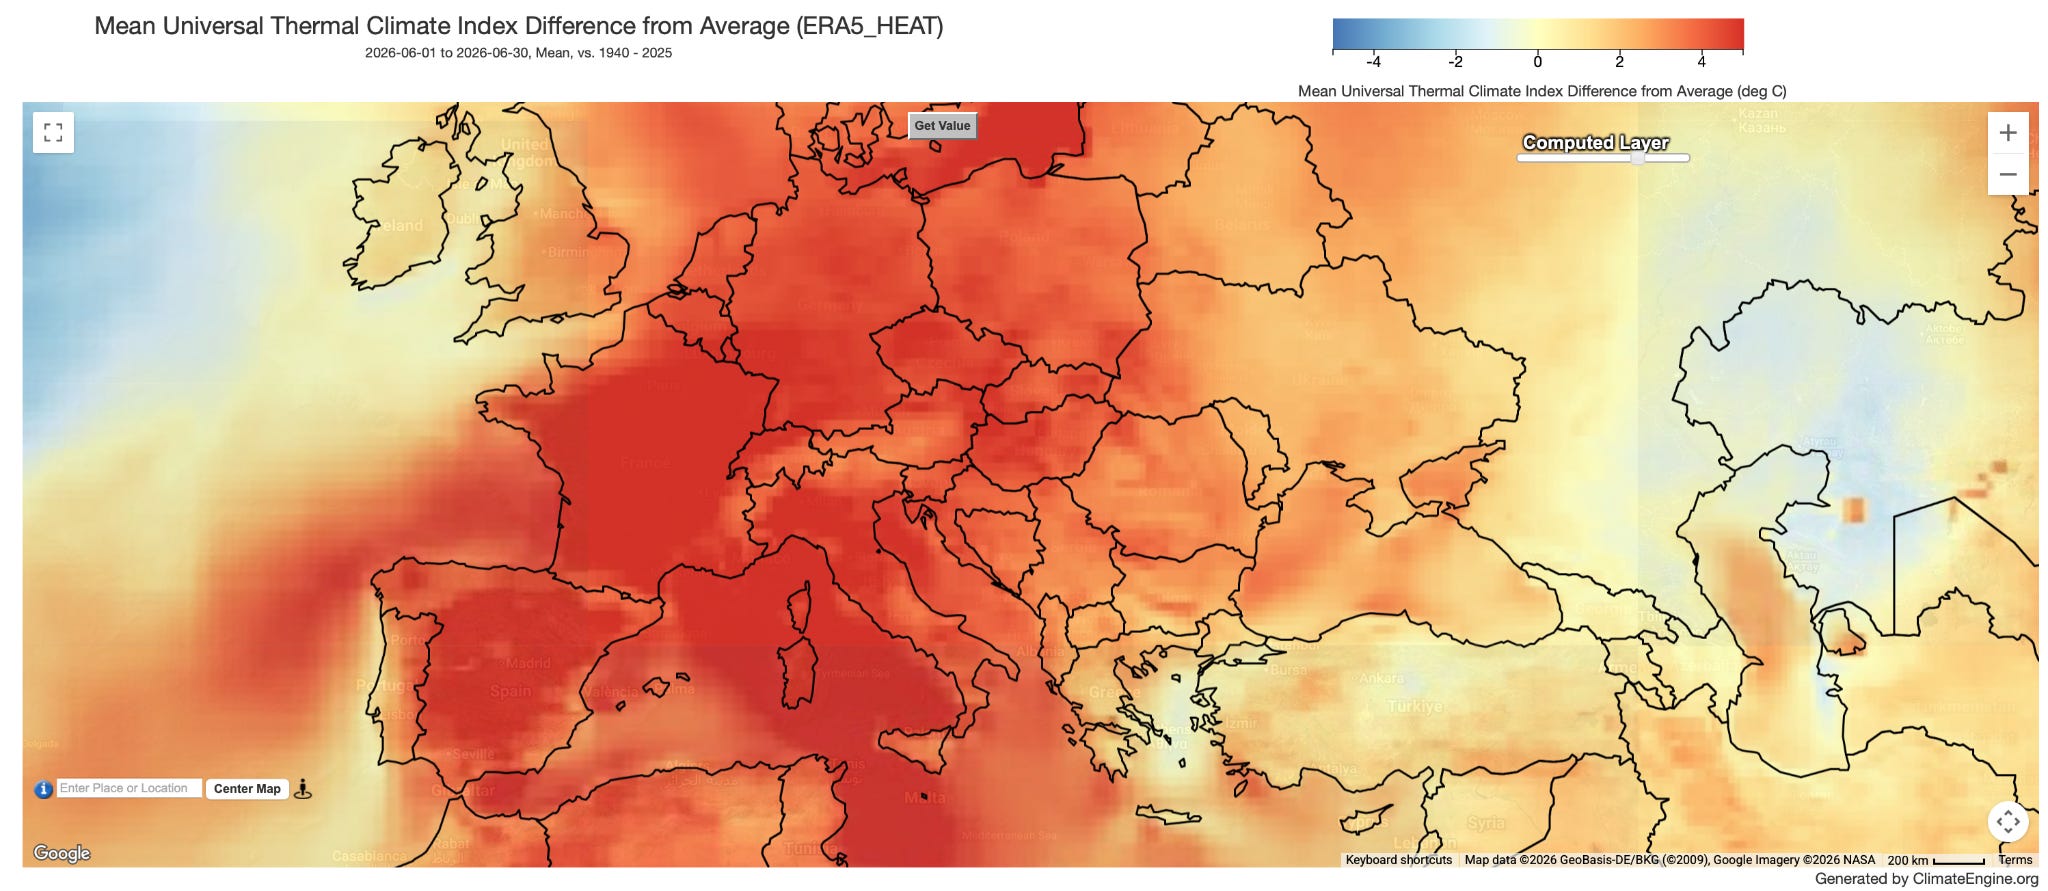
Western Europe experienced an exceptionally warm June, with a persistent heat dome driving temperatures well above average for much of the month. Maps of the Universal Thermal Climate Index (UTCI) difference from the 1940–2025 average highlight France, Spain, and Germany as the areas under the greatest heat stress, with values several degrees above typical June conditions across Western Europe.
Follow this link to bring up the map in the Climate Engine App: https://climengine.page.link/2C2w .
Relevant links: https://climate.copernicus.eu/copernicus-record-heatwave-brings-hottest-june-western-europe-during-second-warmest-june-globally
Florida Keys/ Caribbean Coral Reef Bleaching Event
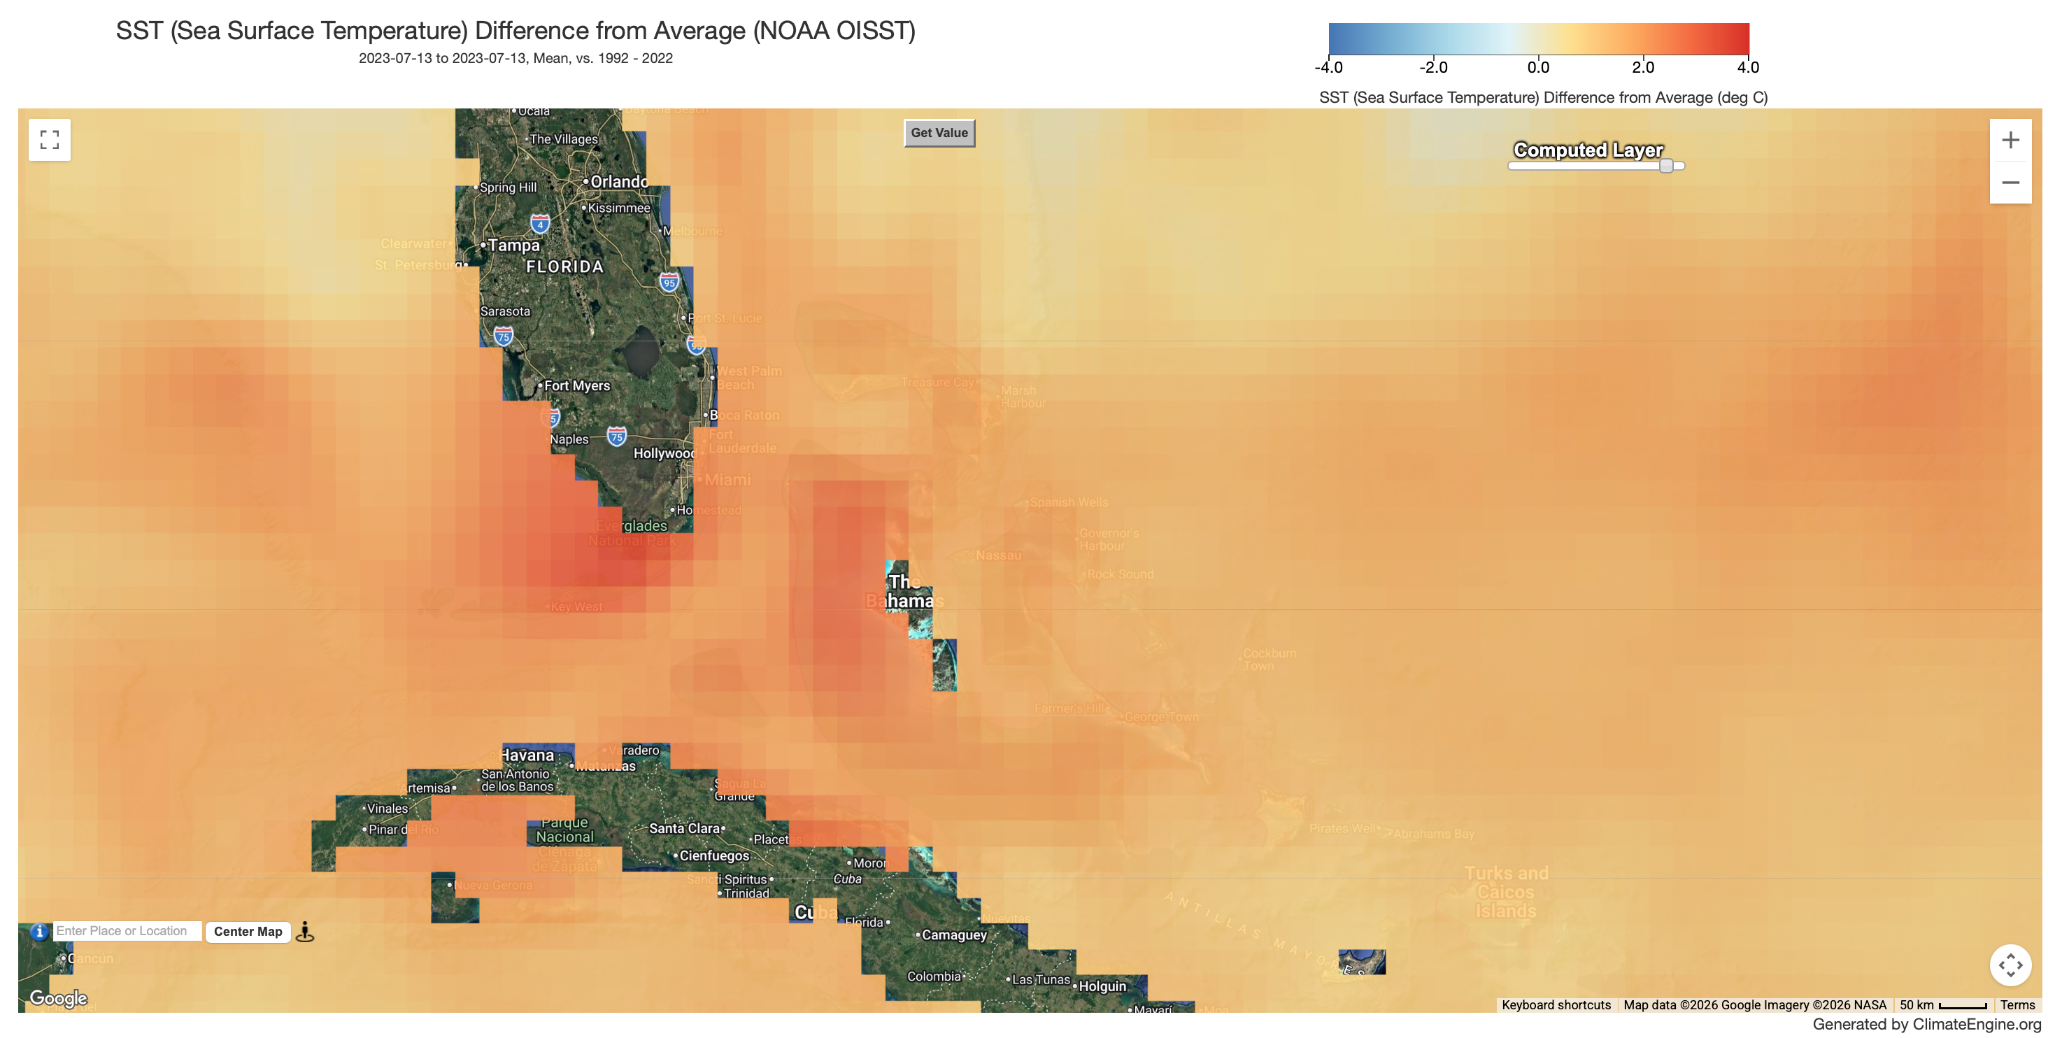
On July 13, 2023, sea surface temperatures across the Florida Keys and Straits of Florida were sharply above the 1992–2022 average, part of a marine heatwave that NOAA said had been building since April and was already the earliest and most severe on record for the region. The map highlights the Straits of Florida and waters south of the Keys as the hottest zone. This same area was later confirmed by NOAA to have 98–100% mortality among elkhorn and staghorn coral colonies.
Follow this link to bring up the map in the Climate Engine App: https://climengine.page.link/8DTT .
Relevent links: https://www.nesdis.noaa.gov/news/noaa-satellites-assist-scientists-studying-mass-bleaching-event-of-florida-corals, https://www.nesdis.noaa.gov/news/extreme-ocean-temperatures-are-affecting-floridas-coral-reef
2022 Flooding in Pakistan
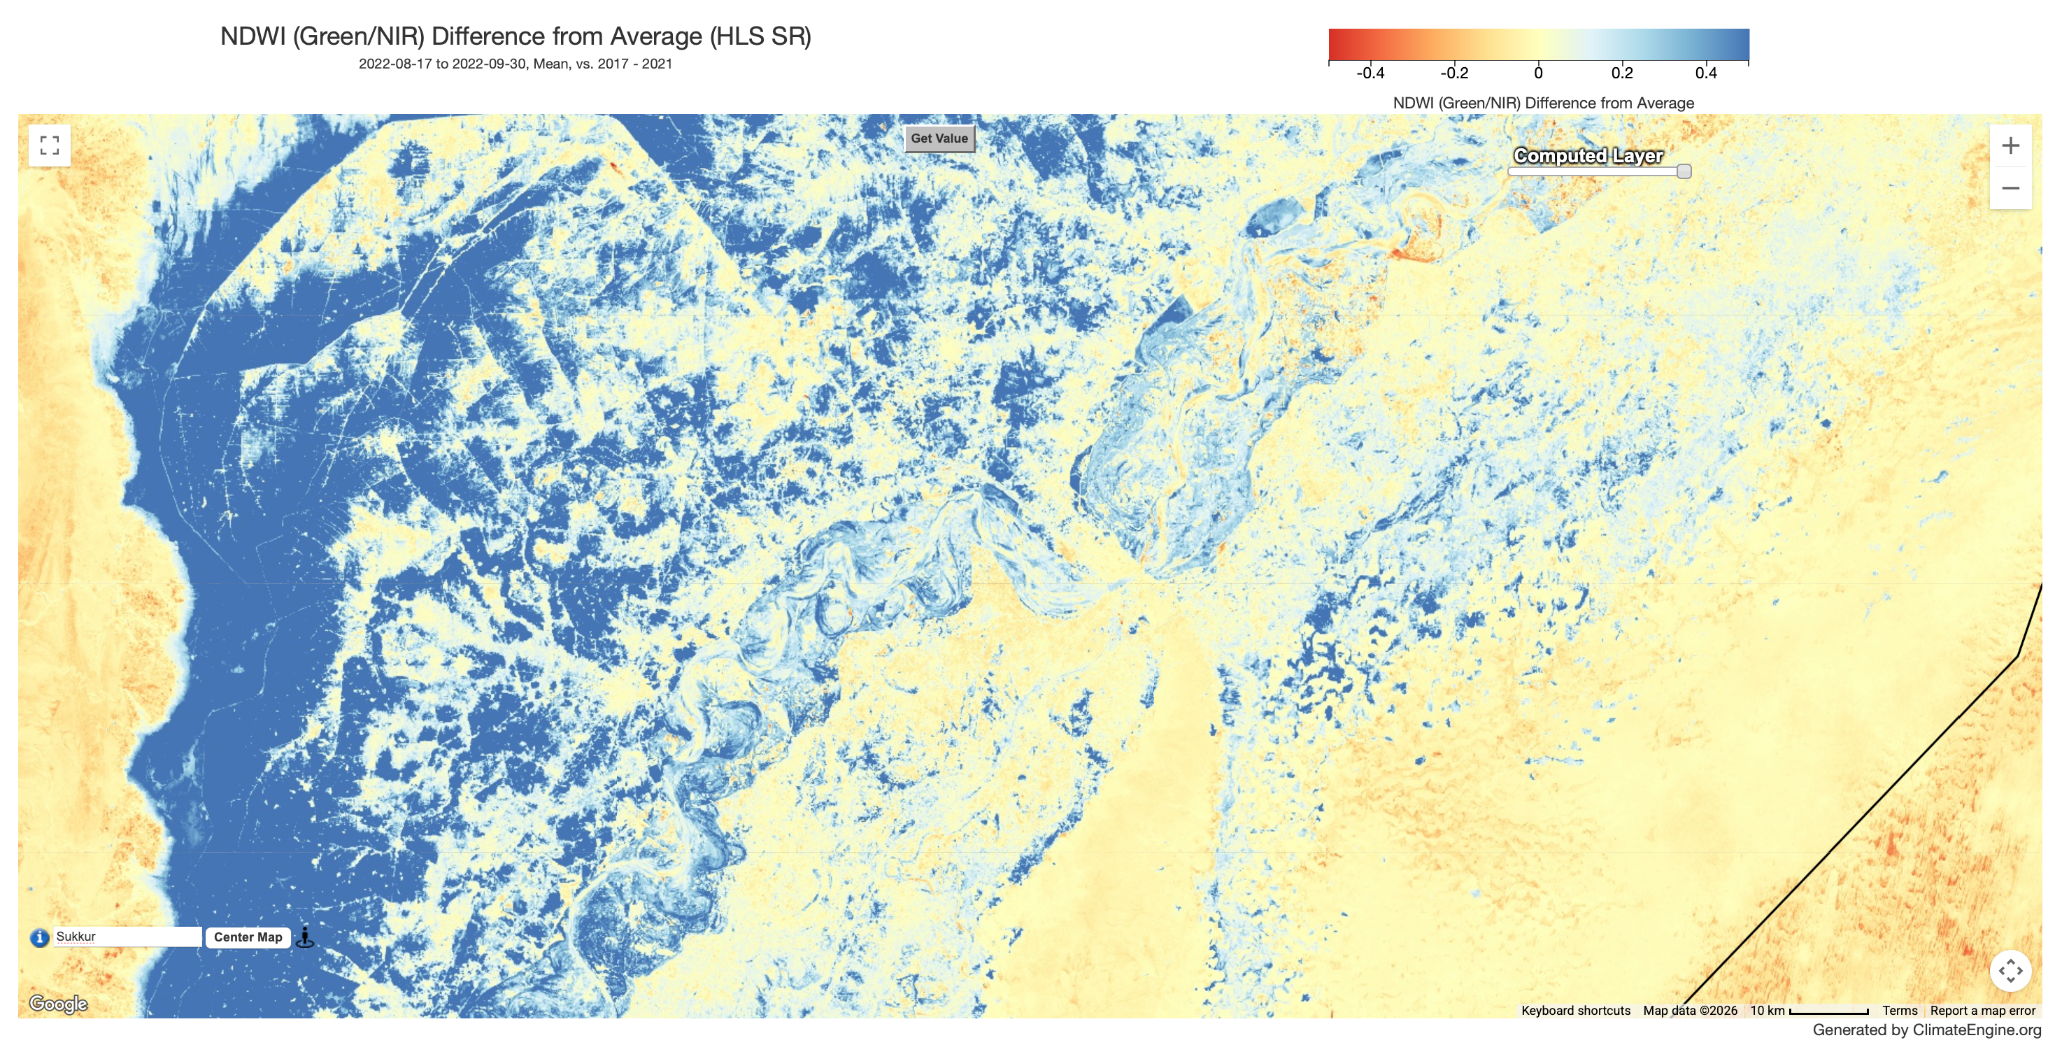
Between June and October 2022, record-breaking monsoon rains and intensified rainfall left large parts of southern Pakistan submerged for months. Maps of NDWI (Green/NIR) difference from the 2017–2021 average, near Sukkur for August 17–September 30, 2022, show widespread standing water across the floodplain compared to typical late-summer conditions.
Follow this link to bring up the map in the Climate Engine App: https://climengine.page.link/M1br .
Relevent links: https://reliefweb.int/report/pakistan/pakistan-2022-monsoon-floods-situation-report-no-10-28-october-2022
Multiple Australian bushfires following long-term drought
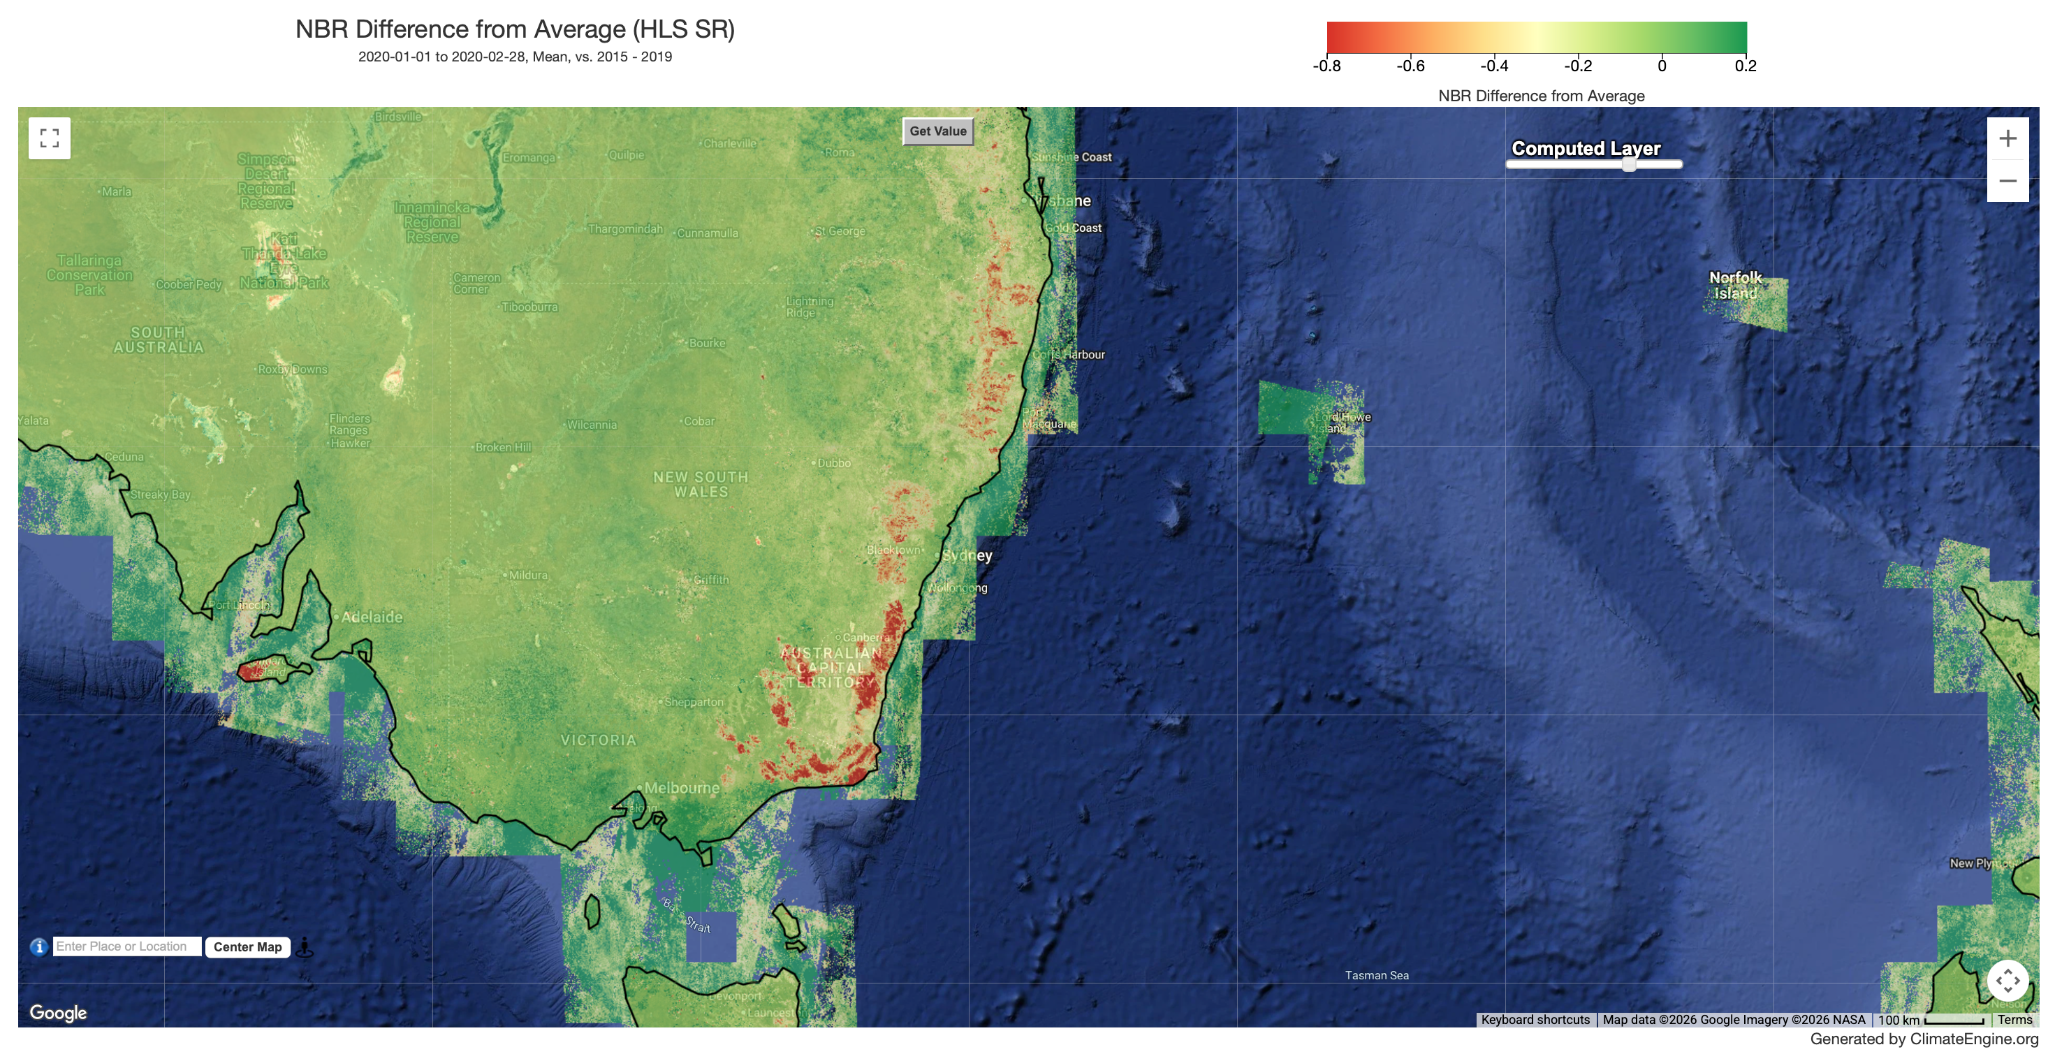
Following the region’s driest three-year period on record, southeast Australia experienced its most severe bushfire season to date, burning approximately 24 million hectares between mid-2019 and early 2020. Maps of NBR (Normalized Burn Ratio) difference from the 2015–2019 average, for January–February 2020, highlight a burn scar running along the coastal ranges of New South Wales into Victoria, consistent with where the fires were most severe.
Follow this link to bring up the map in the Climate Engine App: https://climengine.page.link/6cCH .
Relevent links: https://www.csiro.au/en/news/all/articles/2021/november/bushfires-linked-climate-change
2024 Rio Grande do Sul floods
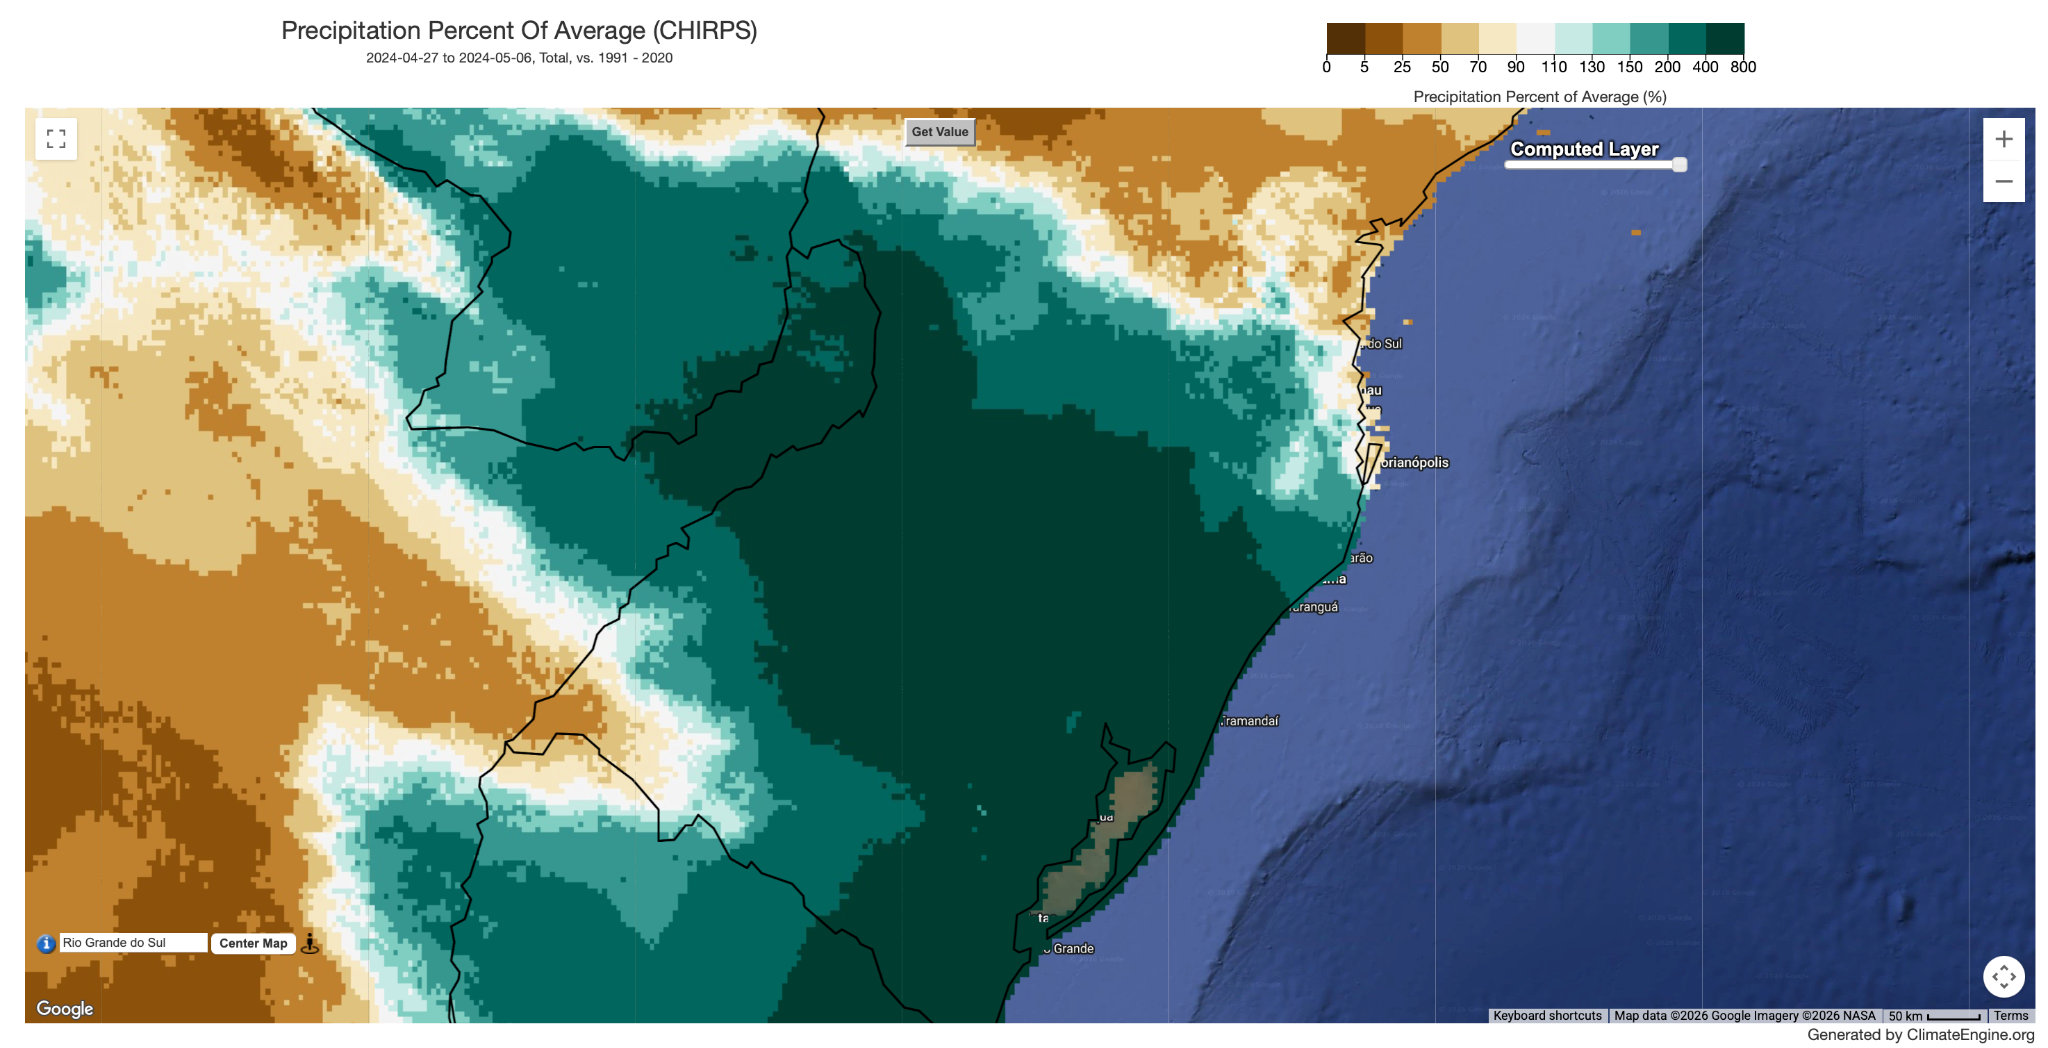
Between late April and early May 2024, an extreme rainfall event struck southern Brazil, surpassing water levels from the historic 1941 flood and becoming one of the worst natural disasters in the state’s recorded history. Maps of precipitation percent of average from the 1991–2020 baseline, for April 27–May 6, 2024, show much of Rio Grande do Sul and neighboring states receiving well above average rainfall.
Follow this link to bring up the map in the Climate Engine App: https://climengine.page.link/b8vN .
Relevent links: https://www.cbsnews.com/news/brazil-floods-death-toll-missing-persons-rio-grande-do-sul/
2020-2023 Horn of Africa Drought
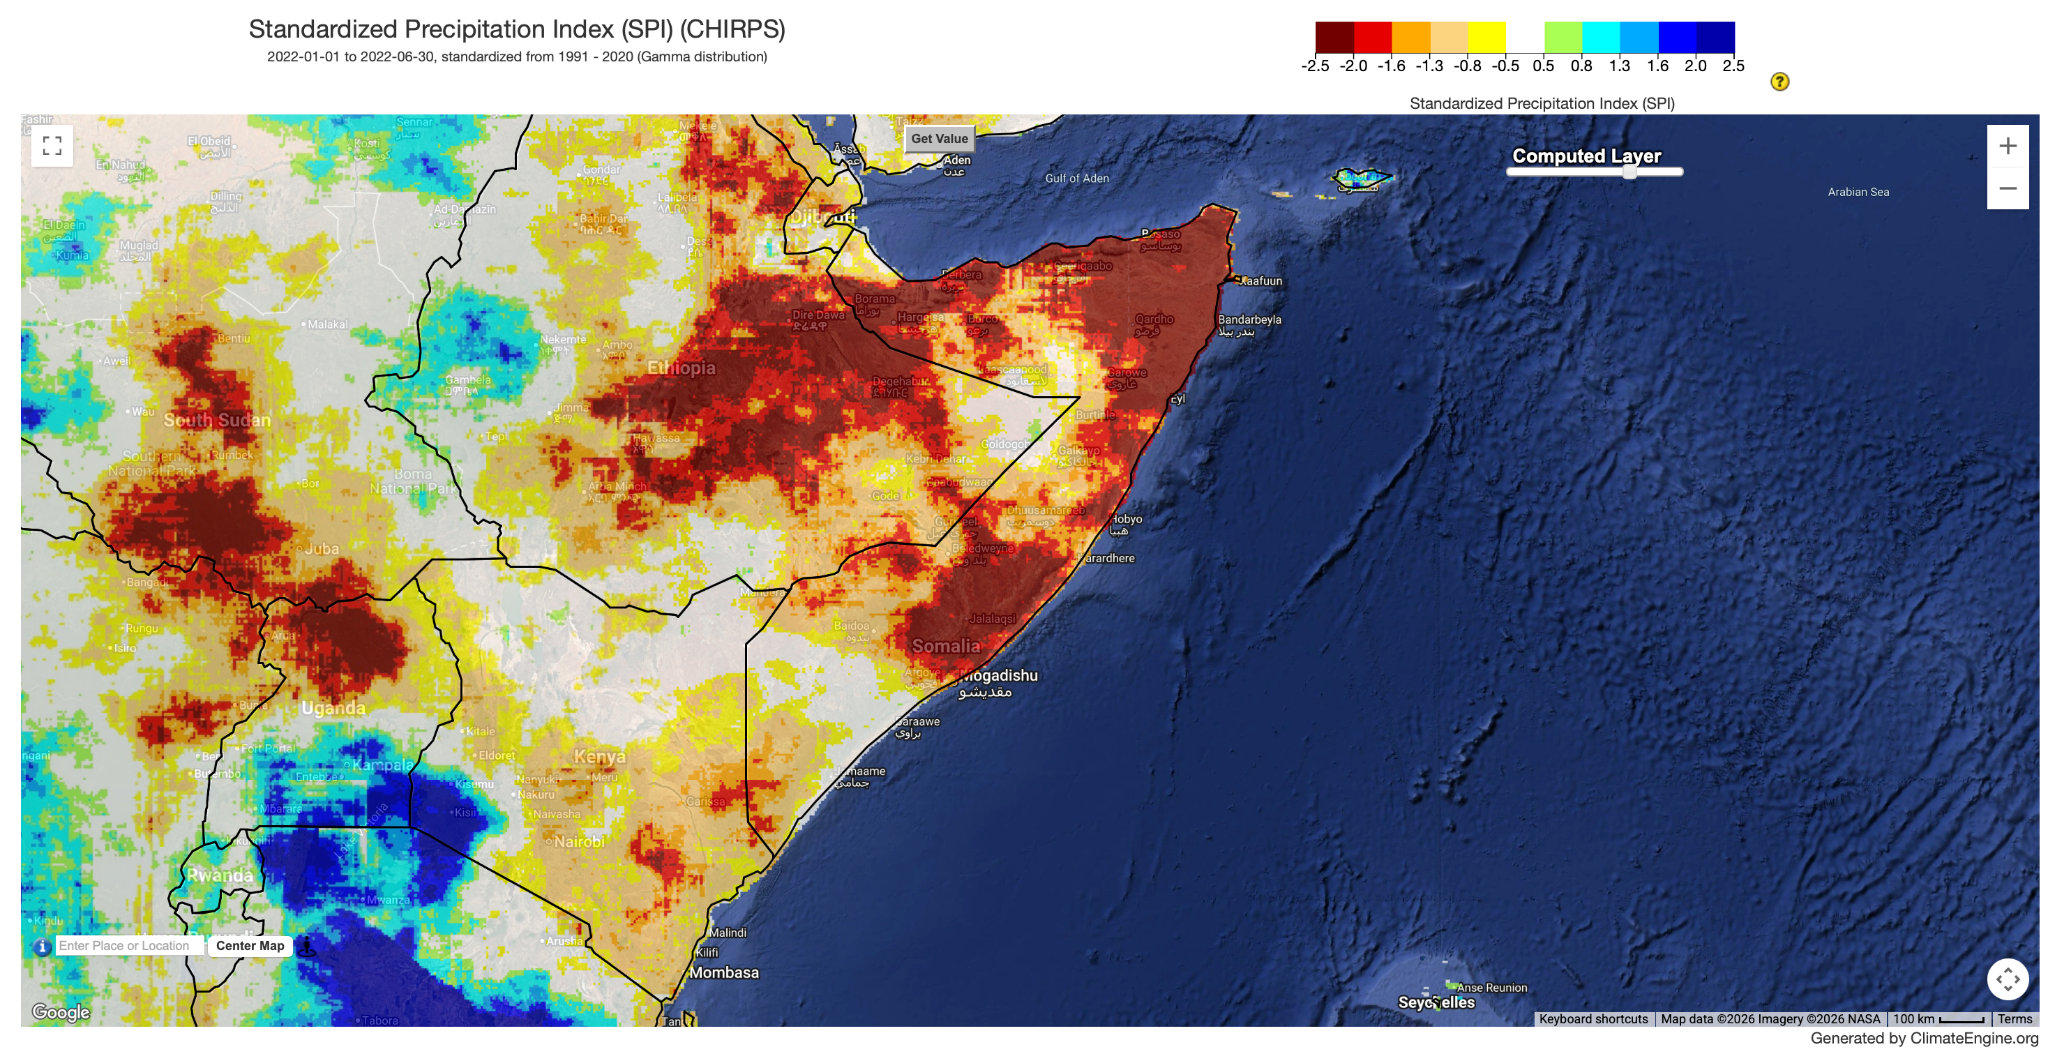
Somalia, Ethiopia, and Kenya experienced multiple consecutive failed rainy seasons in the early 2020s, contributing to one of the region’s most severe droughts in decades. Maps of the Standardized Precipitation Index (SPI) from the 1991–2020 baseline, for January–June 2022, show widespread precipitation deficits across much of Somalia and eastern Ethiopia.
Follow this link to bring up the map in the Climate Engine App: https://climengine.page.link/AtgT .
Relevent links: https://www.unocha.org/publications/report/ethiopia/horn-africa-drought-humanitarian-update-10-june-2022
2024 Crop Stress in Zambia
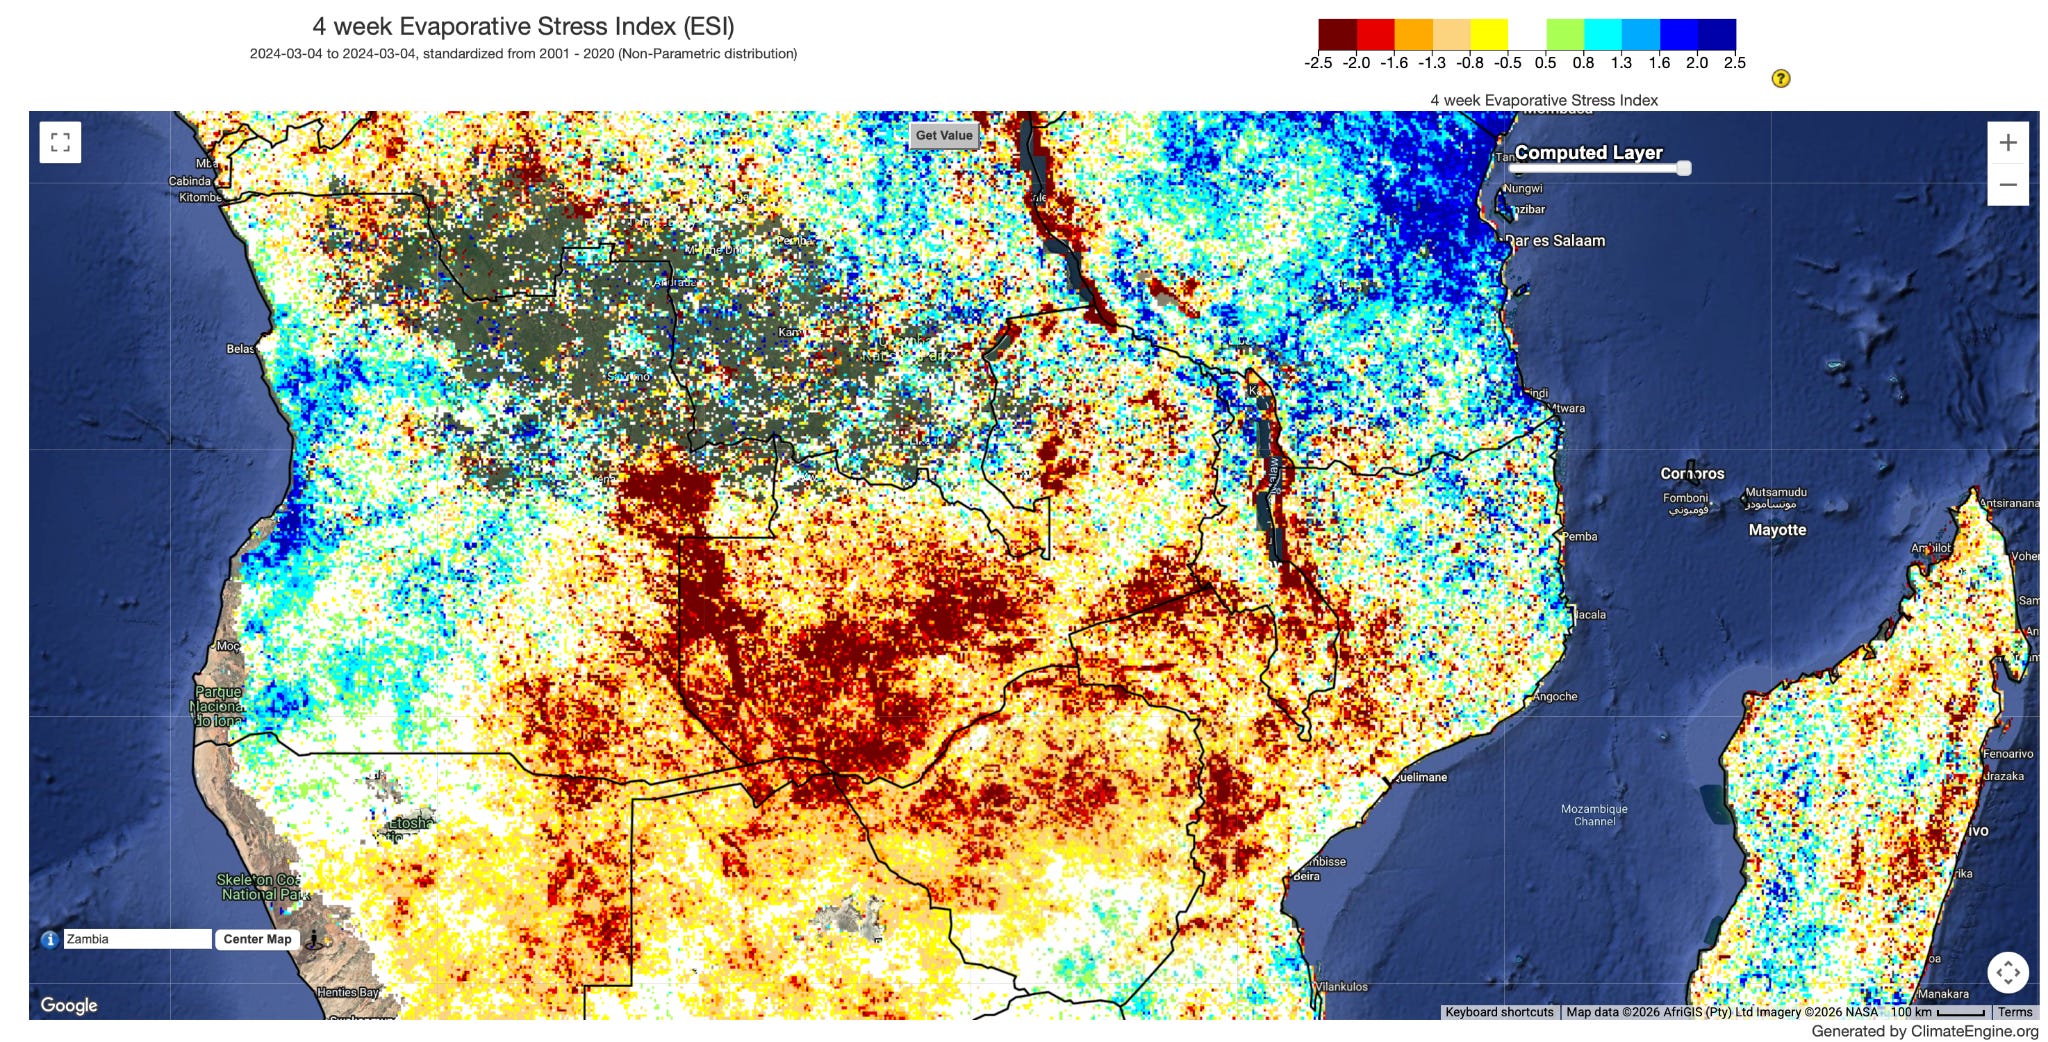
Driven by El Niño, a severe drought struck Southern Africa in early 2024, contributing to widespread crop failure and multiple national disaster declarations across the region. Maps of the 4-week Evaporative Stress Index from the 2001–2020 baseline show significant evaporative stress across Zambia and neighboring countries, consistent with the agricultural impacts reported at the time.
Follow this link to bring up the map in the Climate Engine App: https://climengine.page.link/51Xg .
Relevent links: https://www.wfp.org/stories/southern-africa-el-nino-drought-leaves-trail-scorched-harvests-and-hunger
May 2024 India Heat Wave
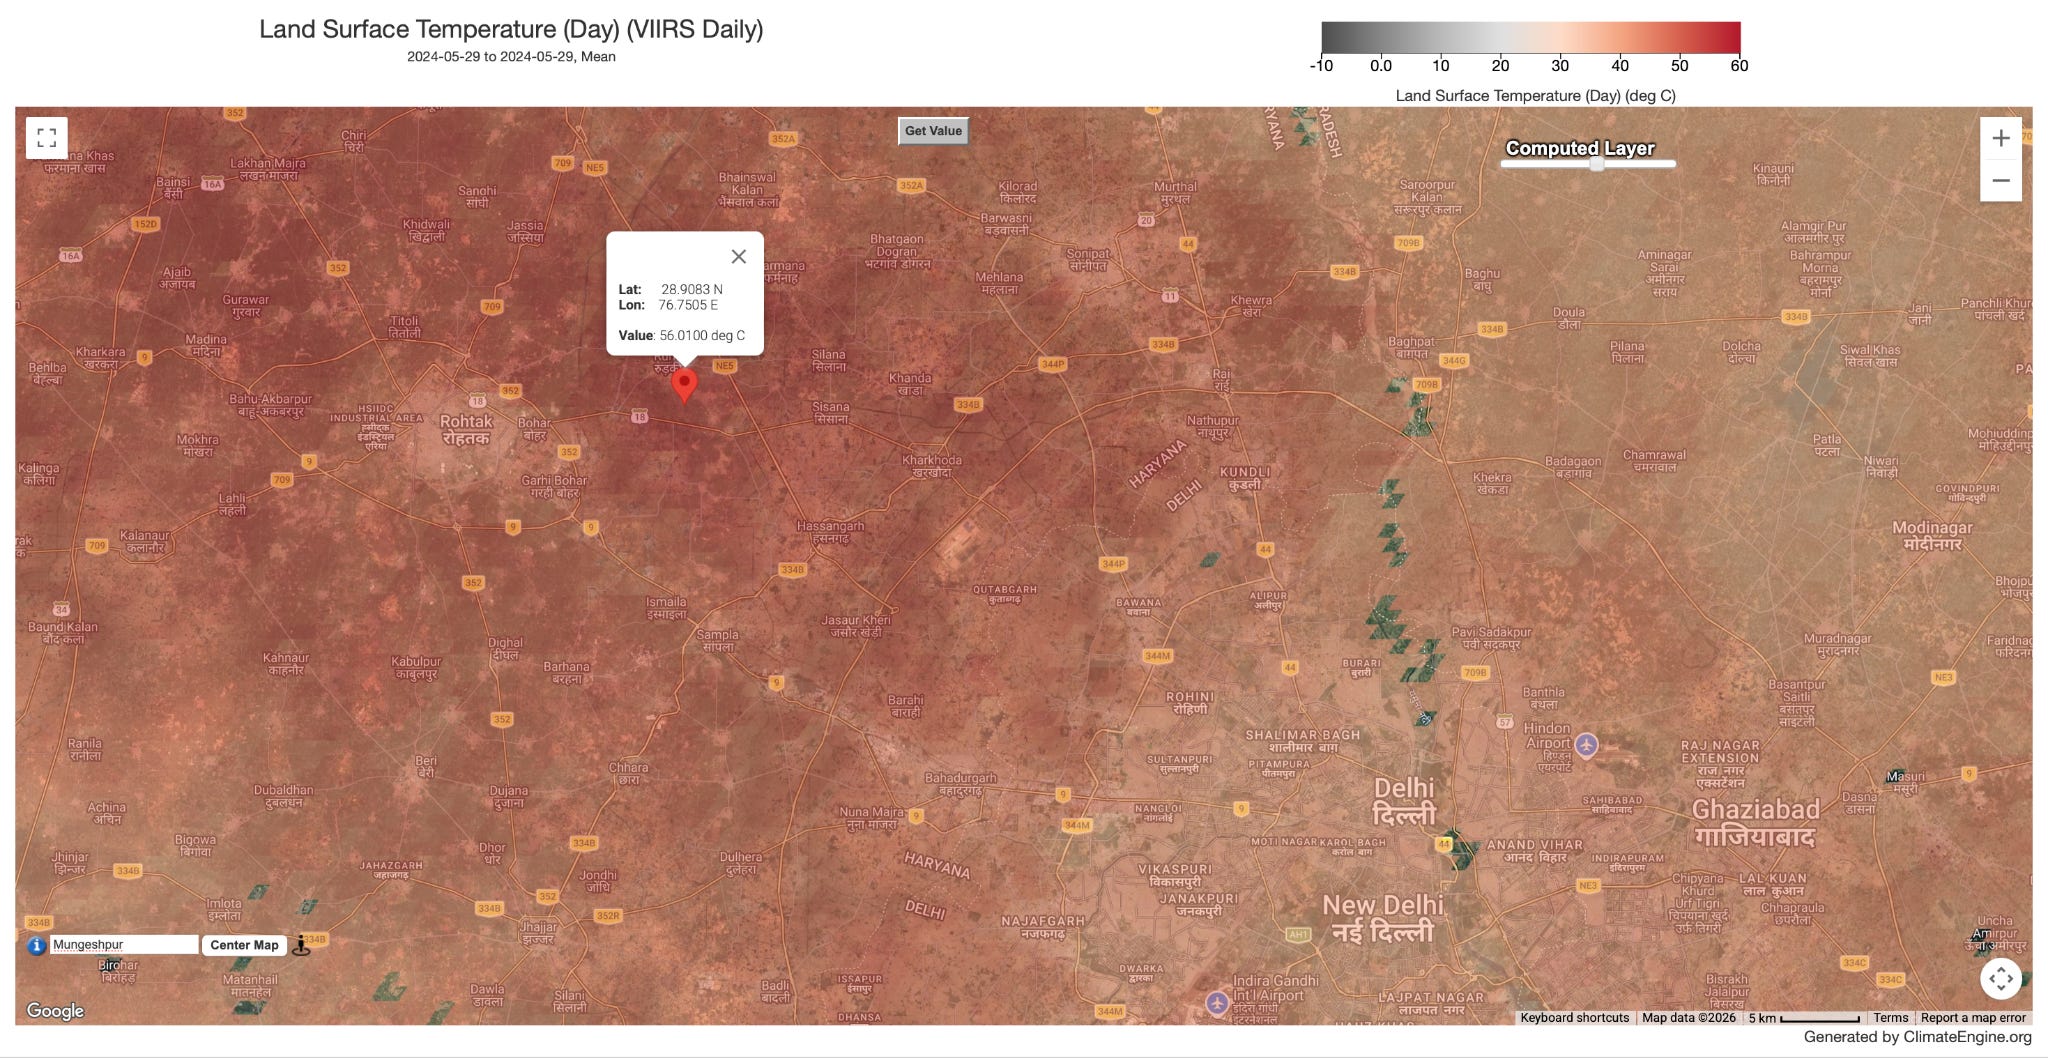
Northern India experienced a severe, weeks-long heat wave in April–June 2024, with temperatures well above normal across Rajasthan, Haryana, and Delhi, and record-breaking heat reported in parts of the region. Maps of land surface temperature from VIIRS for May 29, 2024, show extreme ground temperatures across the Delhi–Haryana region, reflecting the intensity of surface heating during the event.
Follow this link to bring up the map in the Climate Engine App: https://climengine.page.link/swGW .
Relevent links: https://wmo.int/publication-series/state-of-climate-asia-2024
Central Mexico Ground Water Depletion
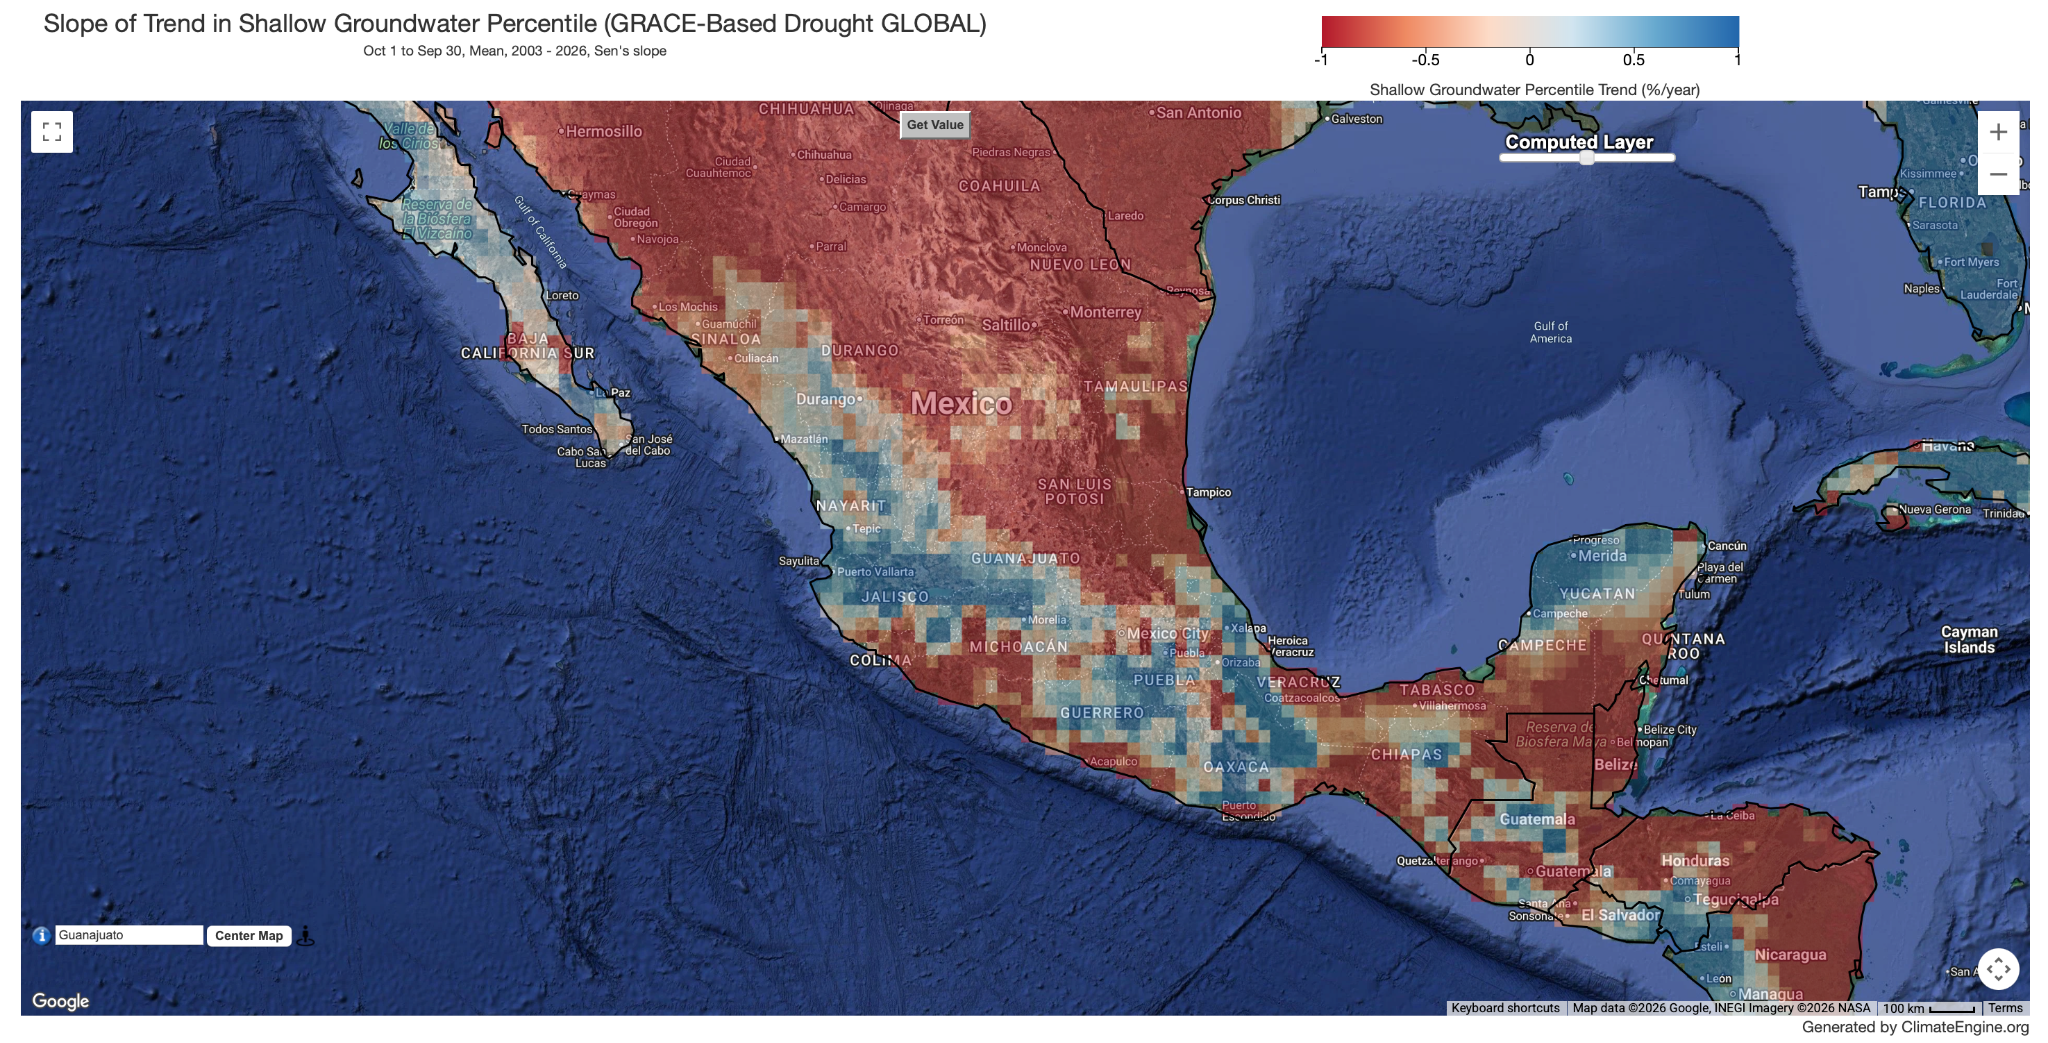
Central Mexico’s Bajío corridor, including Guanajuato and Aguascalientes, has experienced sustained groundwater depletion for decades, driven primarily by agricultural irrigation and urban demand in the region. Maps of the long-term trend in shallow groundwater percentile (2003–2026) show a consistent decline across much of central and northern Mexico, reflecting a chronic, ongoing loss of groundwater storage rather than a single drought event.
Follow this link to bring up the map in the Climate Engine App: https://climengine.page.link/dXXc .
Relevent links: https://www.sciencedirect.com/science/article/pii/S1462901117303982
September 2024 Typhoon Yagi, South China Sea
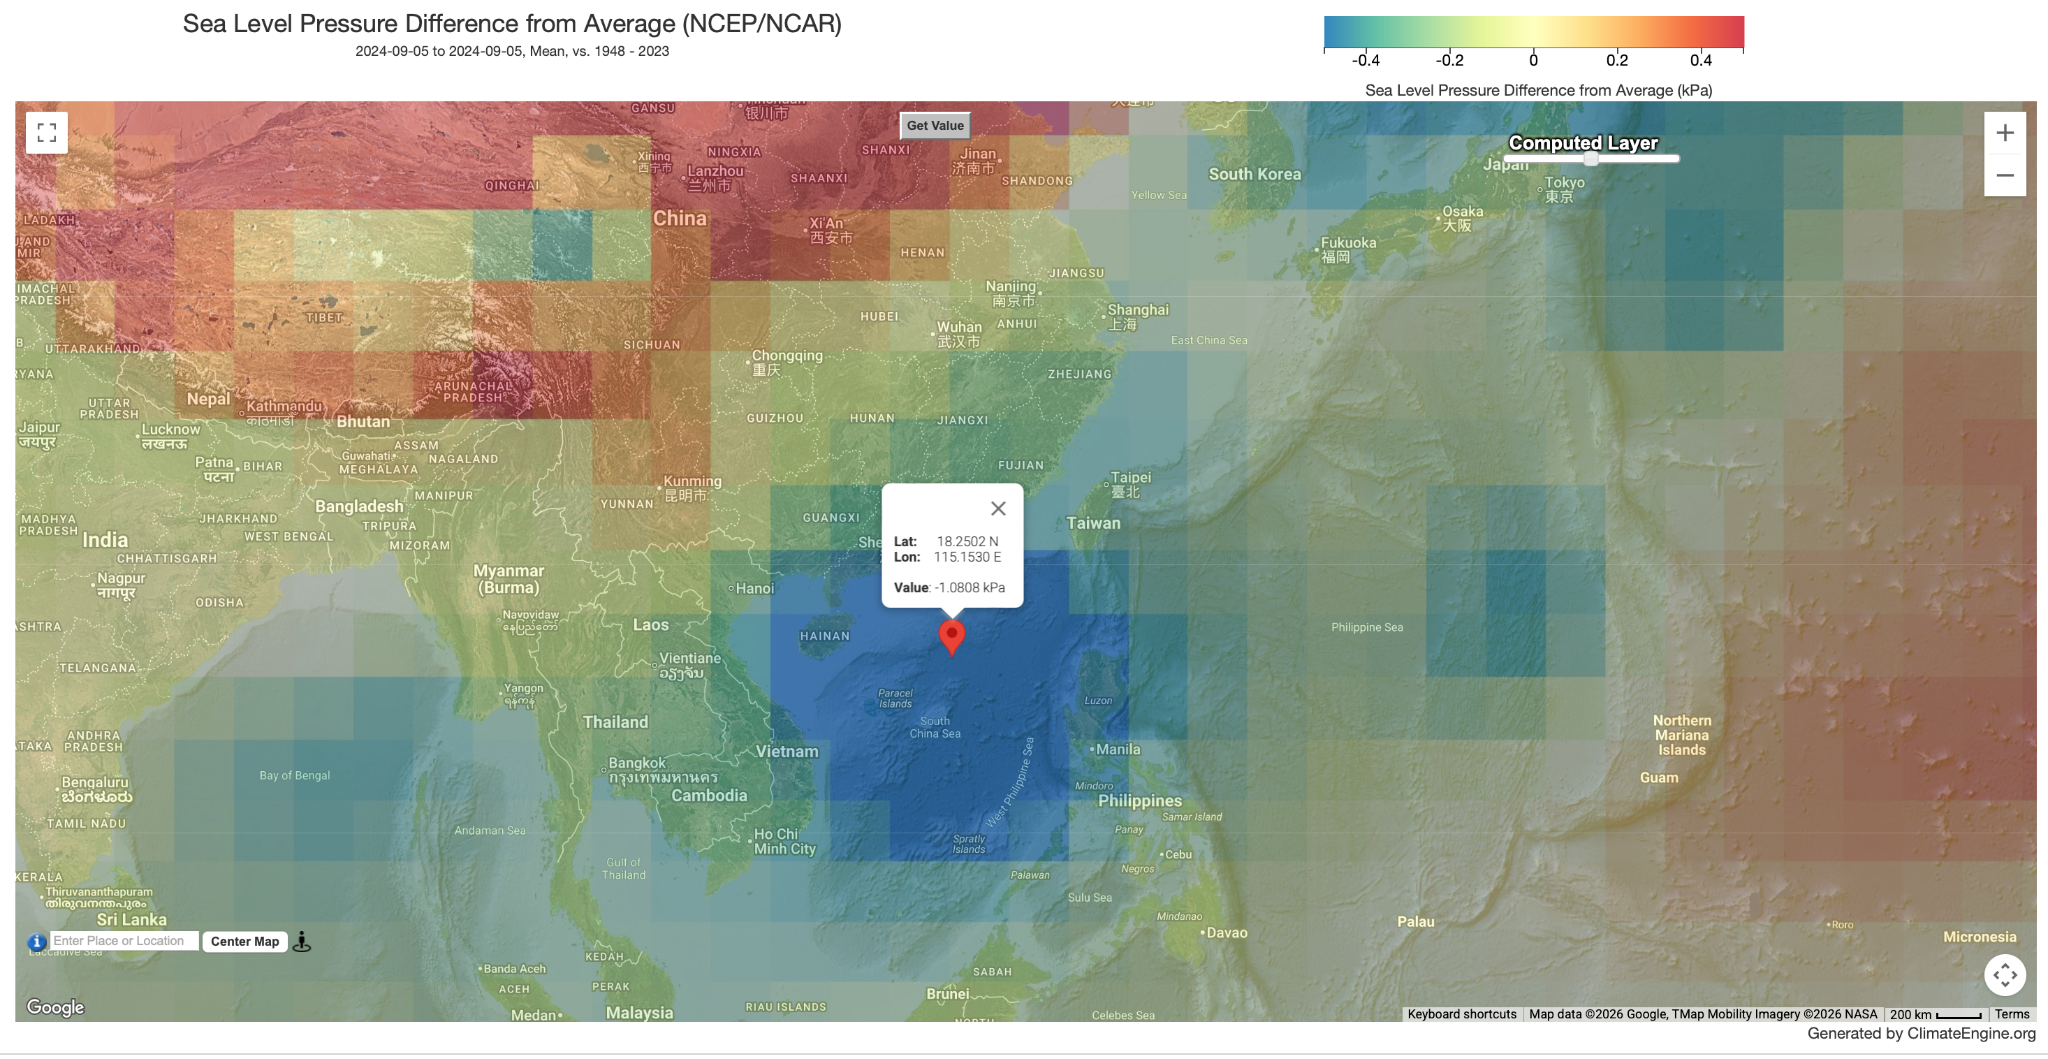
In early September 2024, Typhoon Yagi intensified into a Category 5-equivalent super typhoon, becoming the strongest storm to strike Vietnam in 70 years and one of only four such storms ever recorded in the South China Sea. Maps of sea level pressure difference from the 1948–2023 average, for September 5, 2024, show a pressure deficit of over 1 kPa south of Hainan, marking the storm’s position as it approached landfall.
Follow this link to bring up the map in the Climate Engine App: https://climengine.page.link/UxJr
Relevent links: https://www.unicef.org/vietnam/reports/viet-nam-typhoon-yagi-situation-report, https://www.iflscience.com/deadly-tropical-storm-yagi-has-become-a-super-typhoon-what-does-that-mean-75888
No posts
Comments
Nothing yet. Say the first thing.
Sign in to join the conversation.