
Hey Friend!
The S&P 500 just printed another record high. Bitcoin did not.
That’s most of the week in two sentences. Payrolls came in negative, the inflation print was the tamest in months, the Fed narrative flipped from hikes to holds, and equities ripped. Bitcoin has been sitting in the same price range since June, and the mood on social media matches: Nobody really cares.
We’re used to Bitcoin leading equities down. It’s supposed to lead them up too. Right now it isn’t, and that argues against the idea that the cycle bottom is behind us.
What’s harder to argue with is that this bear market is late. The question is how late.
Let’s get into the broader picture and how to set up for the coming week:
📈 Market Update – The S&P 500 hit another record while Bitcoin stayed near its June range. Softer inflation and negative payrolls flipped the rate narrative from hikes to holds, but BTC’s failure to follow equities argues against calling the cycle bottom confirmed. Bitcoin’s Cycle Composite is just short of its bottoming phase and Seller Exhaustion has fallen below 0.02, but spot demand remains negative. ETFs have lost $200 million since Monday, while Strategy sold 1,690 BTC in its fourth consecutive week of selling.
🔊 Project Updates – Robinhood Chain averaged 11.6 million daily transactions from August 3–9 and TVL climbed near $500 million. StonkPit explains much of the transaction spike, making stablecoin-led TVL the more important signal to watch.
🐂 Alpha Insights – Venice’s $65 million equity raise puts AI token value capture under the microscope. A five-tier framework separates tokens that mechanically capture business growth from those relying on incentives, sentiment or promises.

The current state of the market.
Start with energy, because everything else this month hangs off it. Traders spent early August betting on progress toward reopening the Strait of Hormuz, and the war premium that dominated July started coming out of oil. That was the first domino.
Cheaper energy feeds straight back into inflation expectations, and Wednesday’s US inflation print was the tamest in months. In a previous letter the market was pricing a September hike and a second one later in the year. That pricing is gone. Then July payrolls contracted by 23,000 jobs and the story flipped again, from hike fear to rate-hold optimism. A weak labour market used to be bad news. In this regime it reads as permission.
The S&P 500 closed at a record 7,757.64, the Dow crossed 54,000, and the index has now closed at a record high 25 times this year.
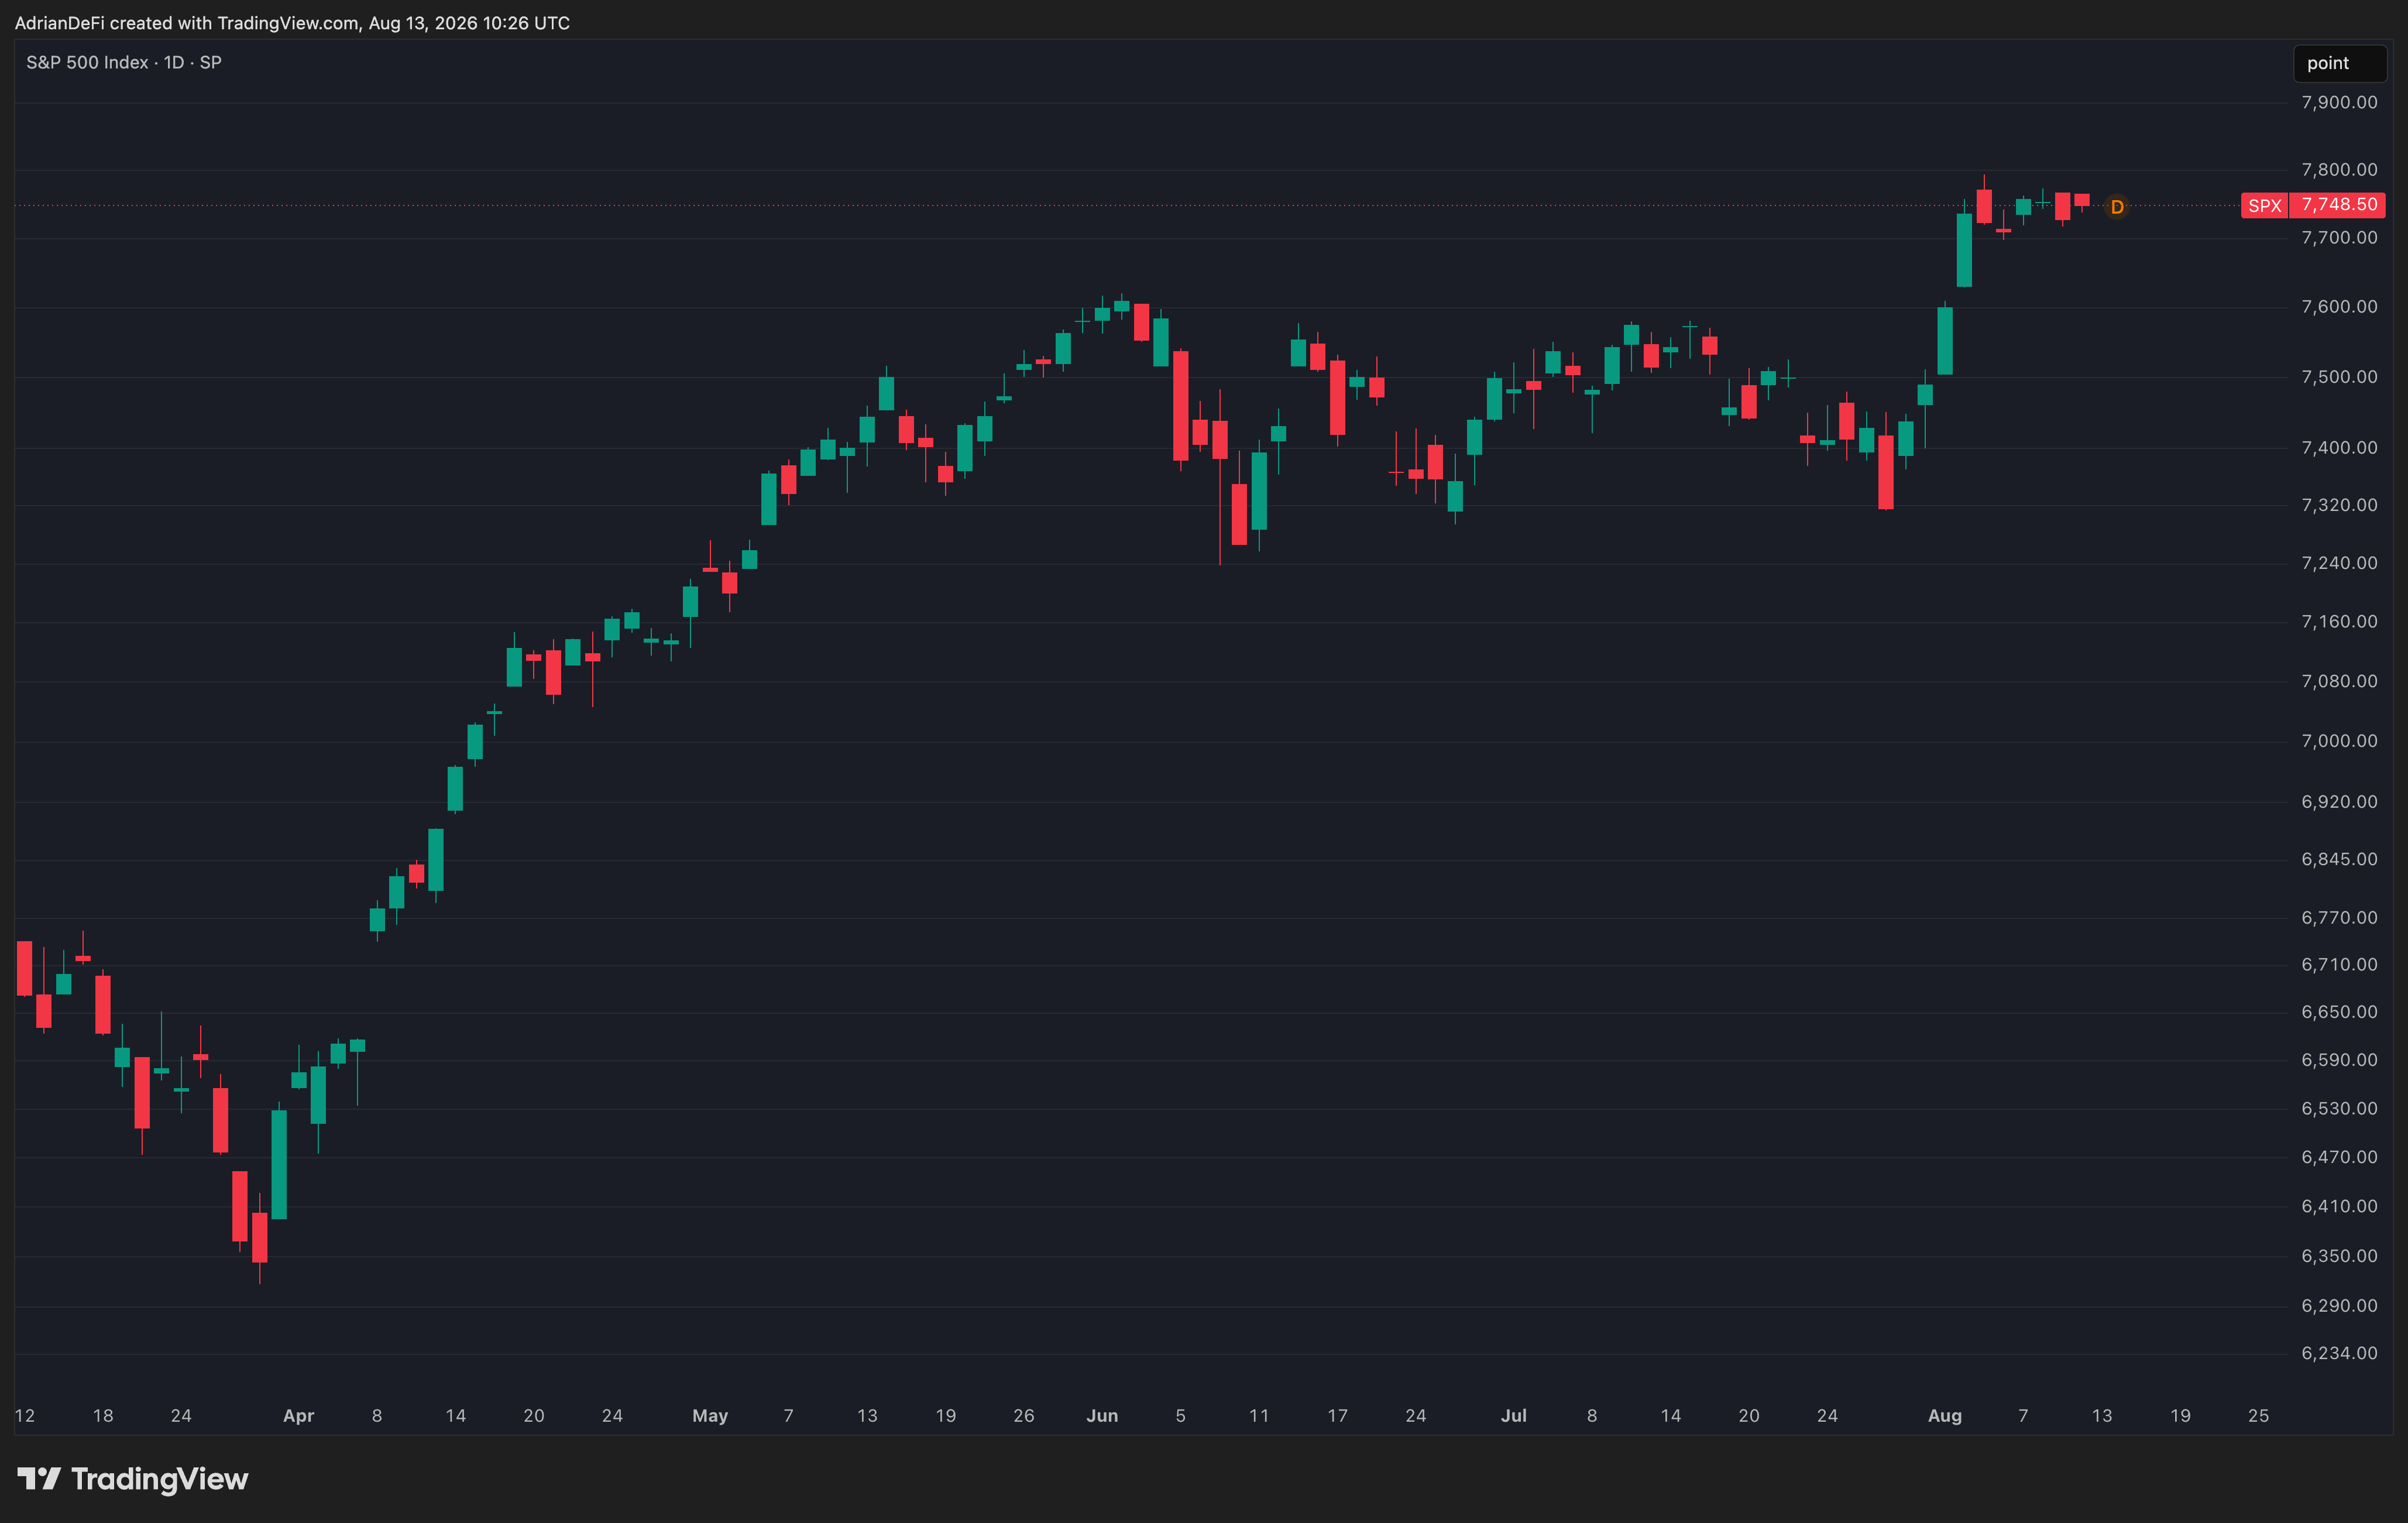
→ Two months ago this same index was pricing hikes and a shut shipping lane. Nothing structural got fixed in between. What changed is the rate path, and the whole move leans on it. The next hot inflation print does real damage, because there’s no cushion left in the positioning.
Now the other side of the coin: Bitcoin did not care. It closed Wednesday at $63,402, down 0.24%, and it has traded in roughly the same region since June.
Bitcoin usually front-runs equities in both directions, because it’s the same liquidity with more leverage in it. We watched that work perfectly on the way down. On the way up, it isn’t working at all. Bitcoin has decoupled before, so this proves nothing on its own. But if the final cycle low were in, this is exactly the environment where you’d expect it to be leading.
What’s important to track underneath the macro:
The onchain picture says something more useful than price does. The clearest version of it is the Cycle Composite, which aggregates 45 separate cycle indicators into one line, so you’re not reading fifteen charts that half-agree with each other.
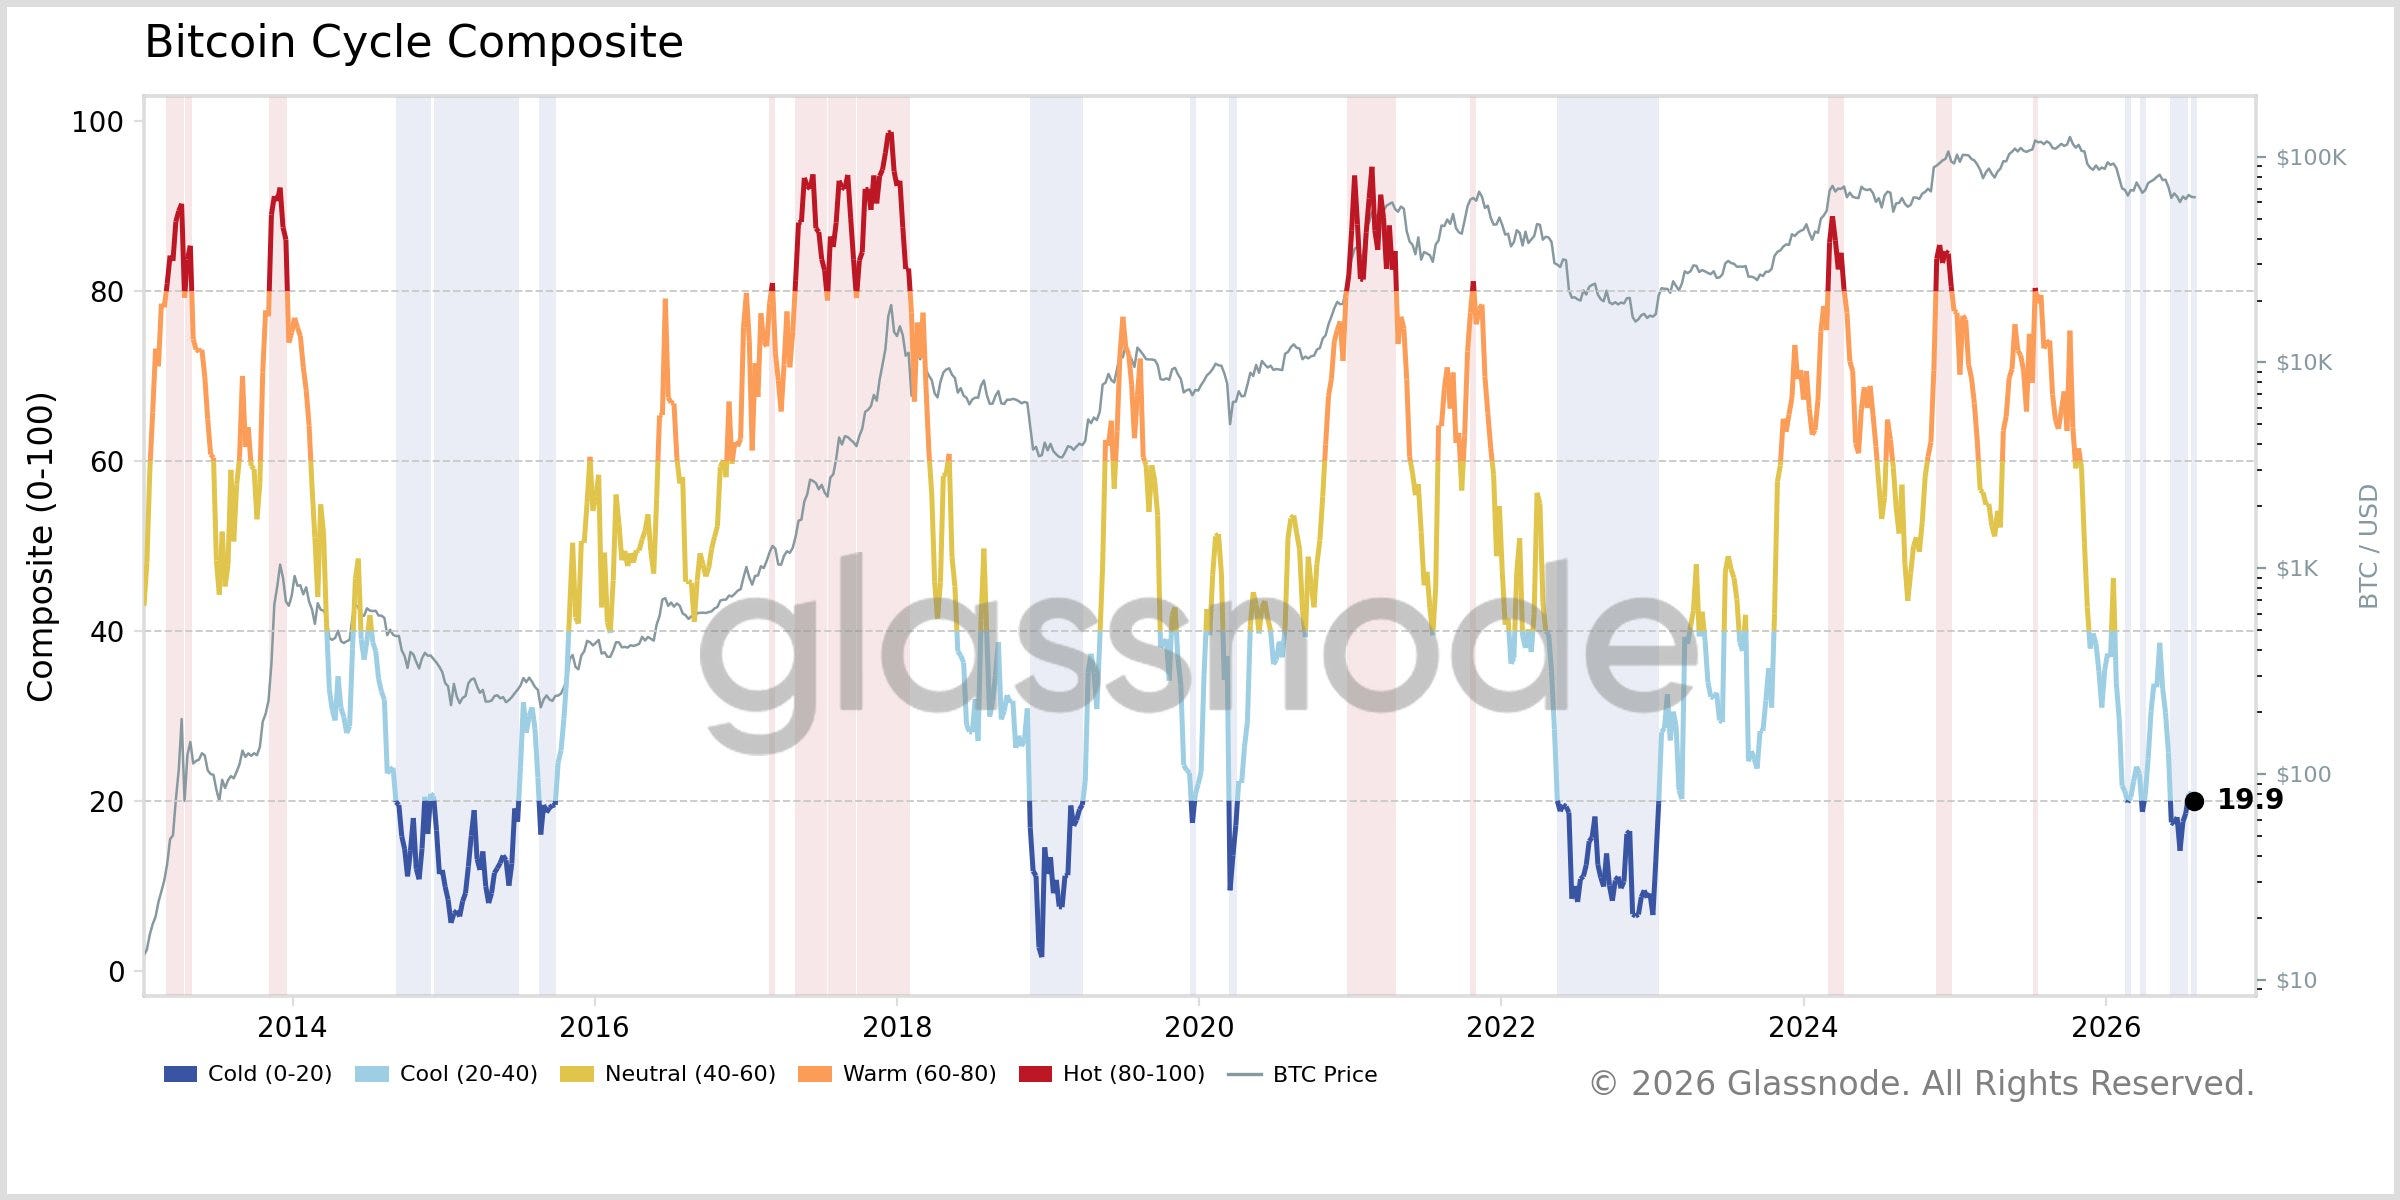
→ The composite has Bitcoin just short of the bottoming phase. Not in it, close to it. It tells you how much of this bear market is already behind us. It tells you nothing about when. Last stretch rather than middle, and the stretch could run three weeks or three months.
Seller behaviour says the same thing. Quick for your understanding: the Seller Exhaustion Constant combines how much of the supply sits in profit with how violent price has been, so low readings mean most of the people who wanted out are already out.
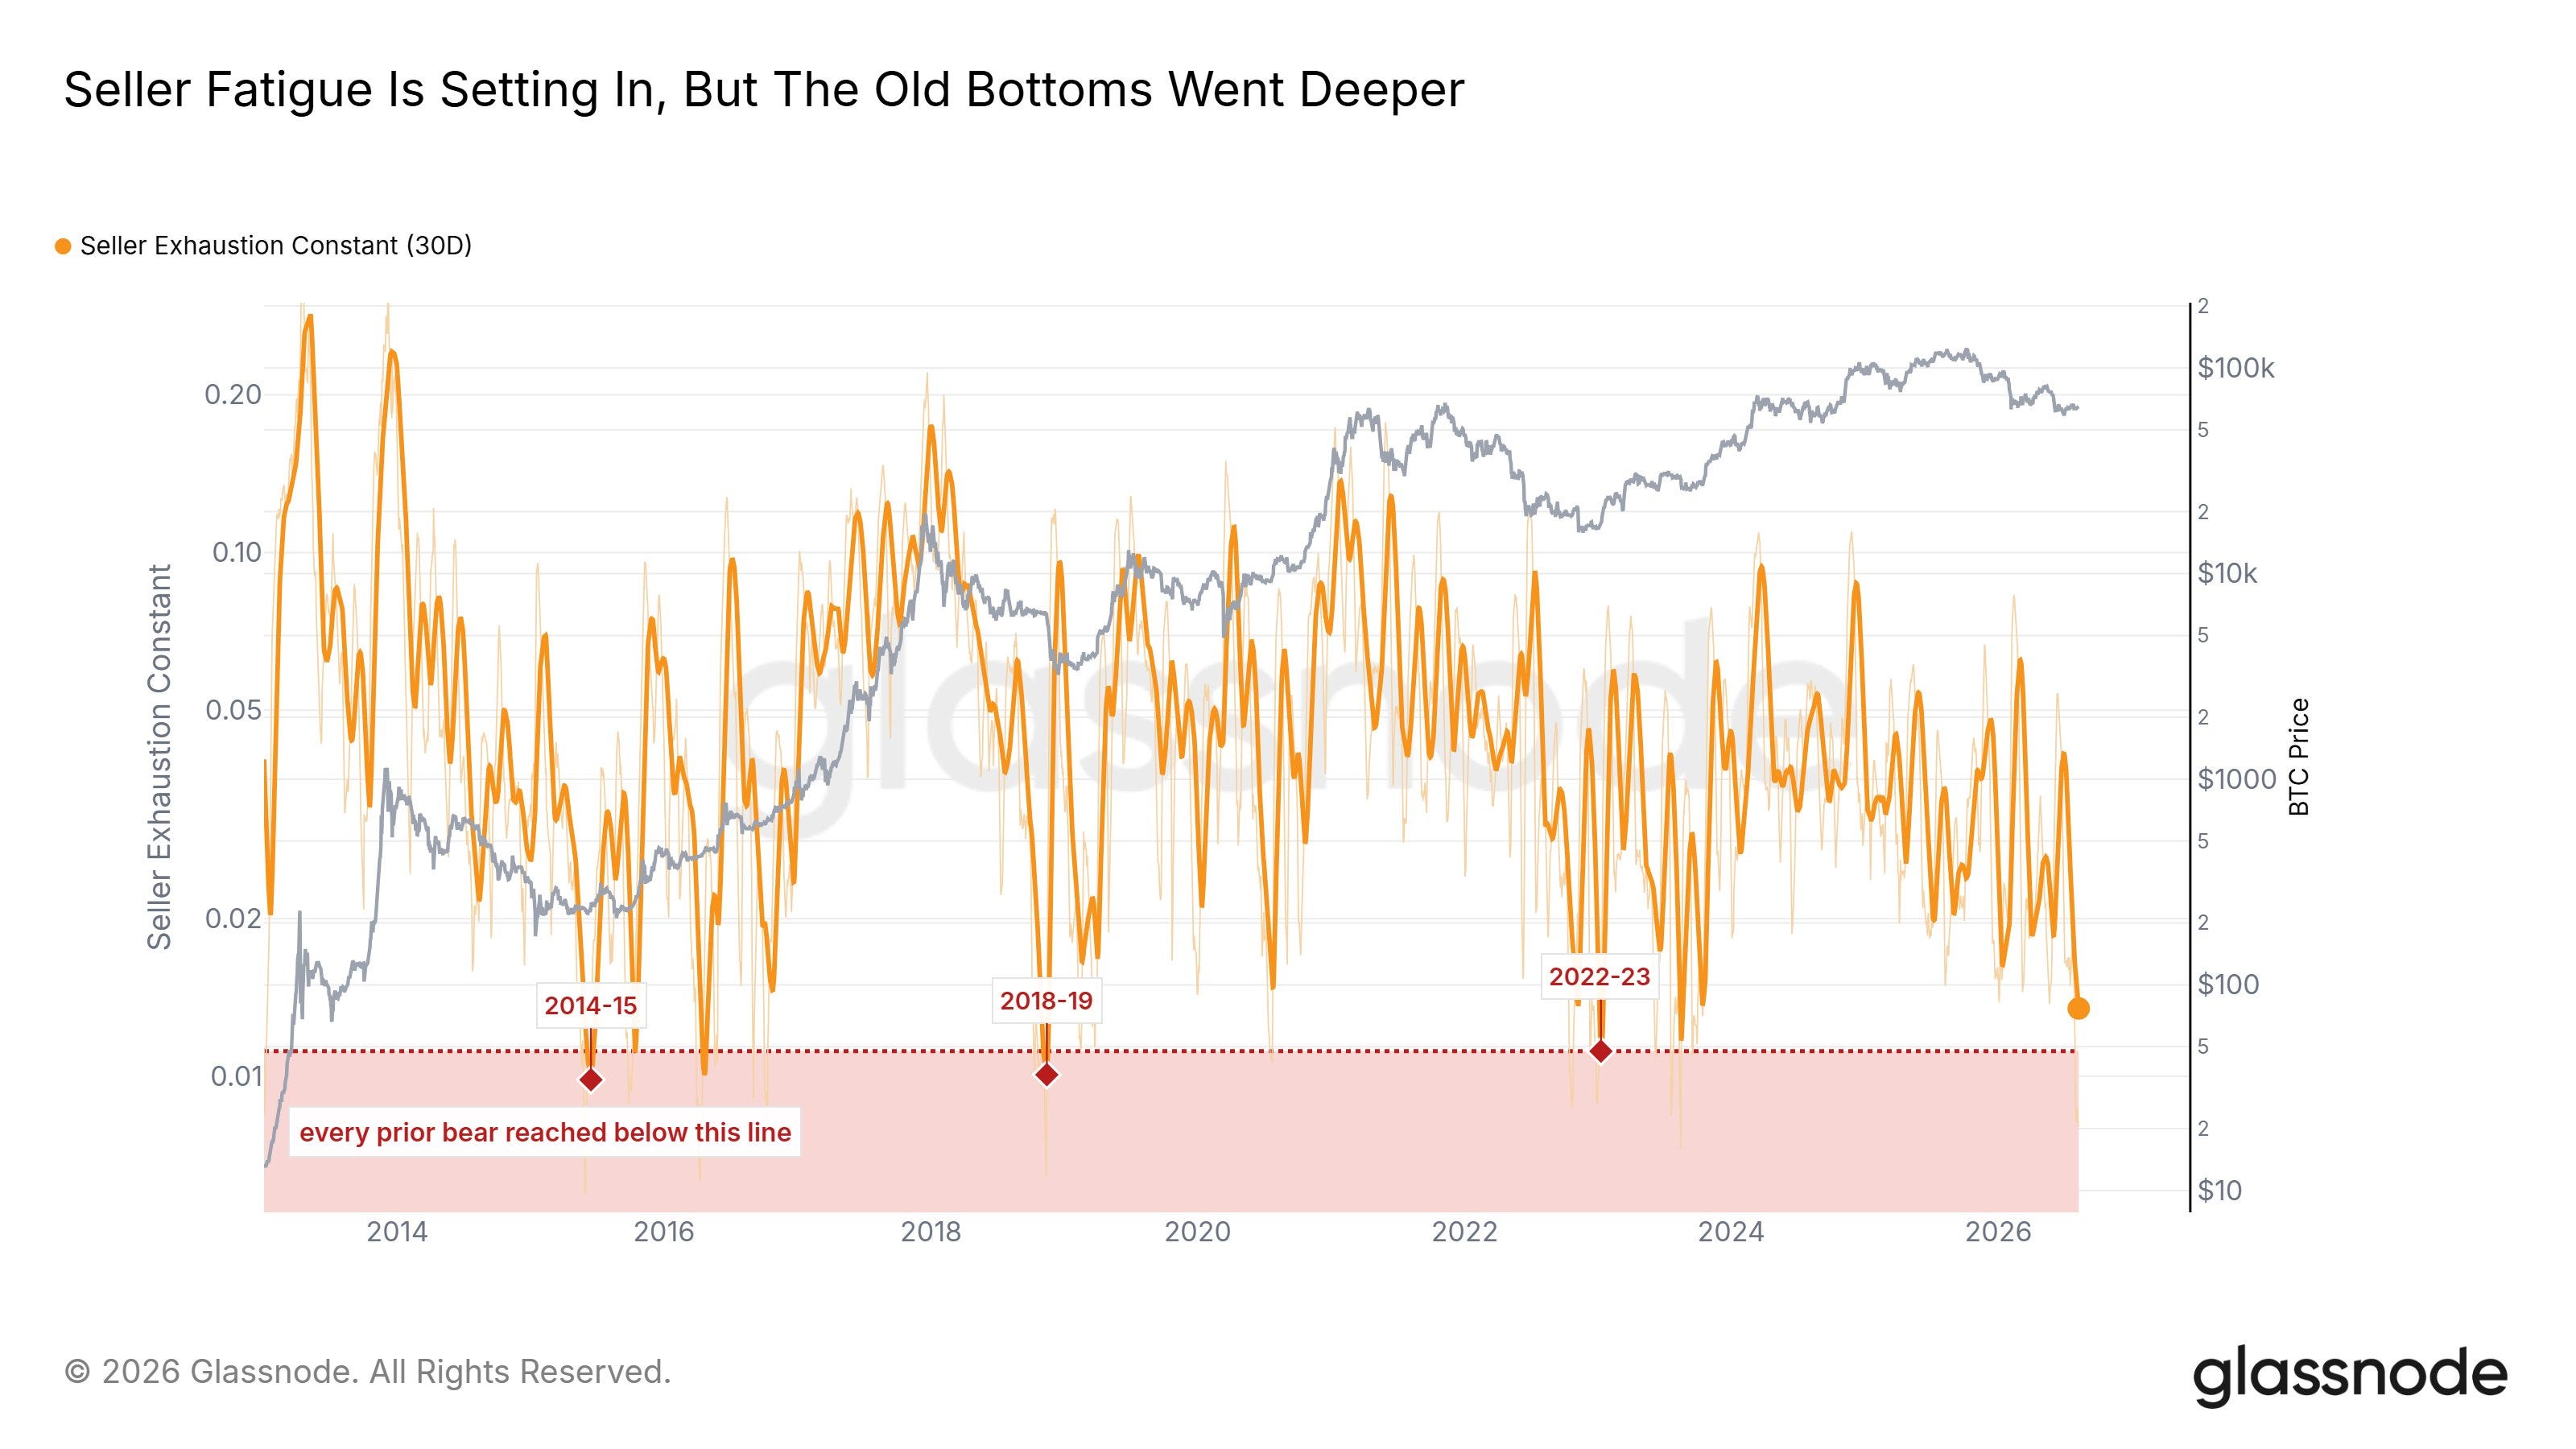
→ It has fallen below 0.02, with roughly 54.6% of BTC supply still in profit. Sellers are tired. But the reading hasn’t reached the levels that marked previous bear market bottoms, so the historical bottoming signature is not confirmed.
Which brings us to the quality of the current bid, and that’s the part I’d watch closest. Bitcoin is futures-driven right now. Open interest climbed while spot demand stayed net negative.
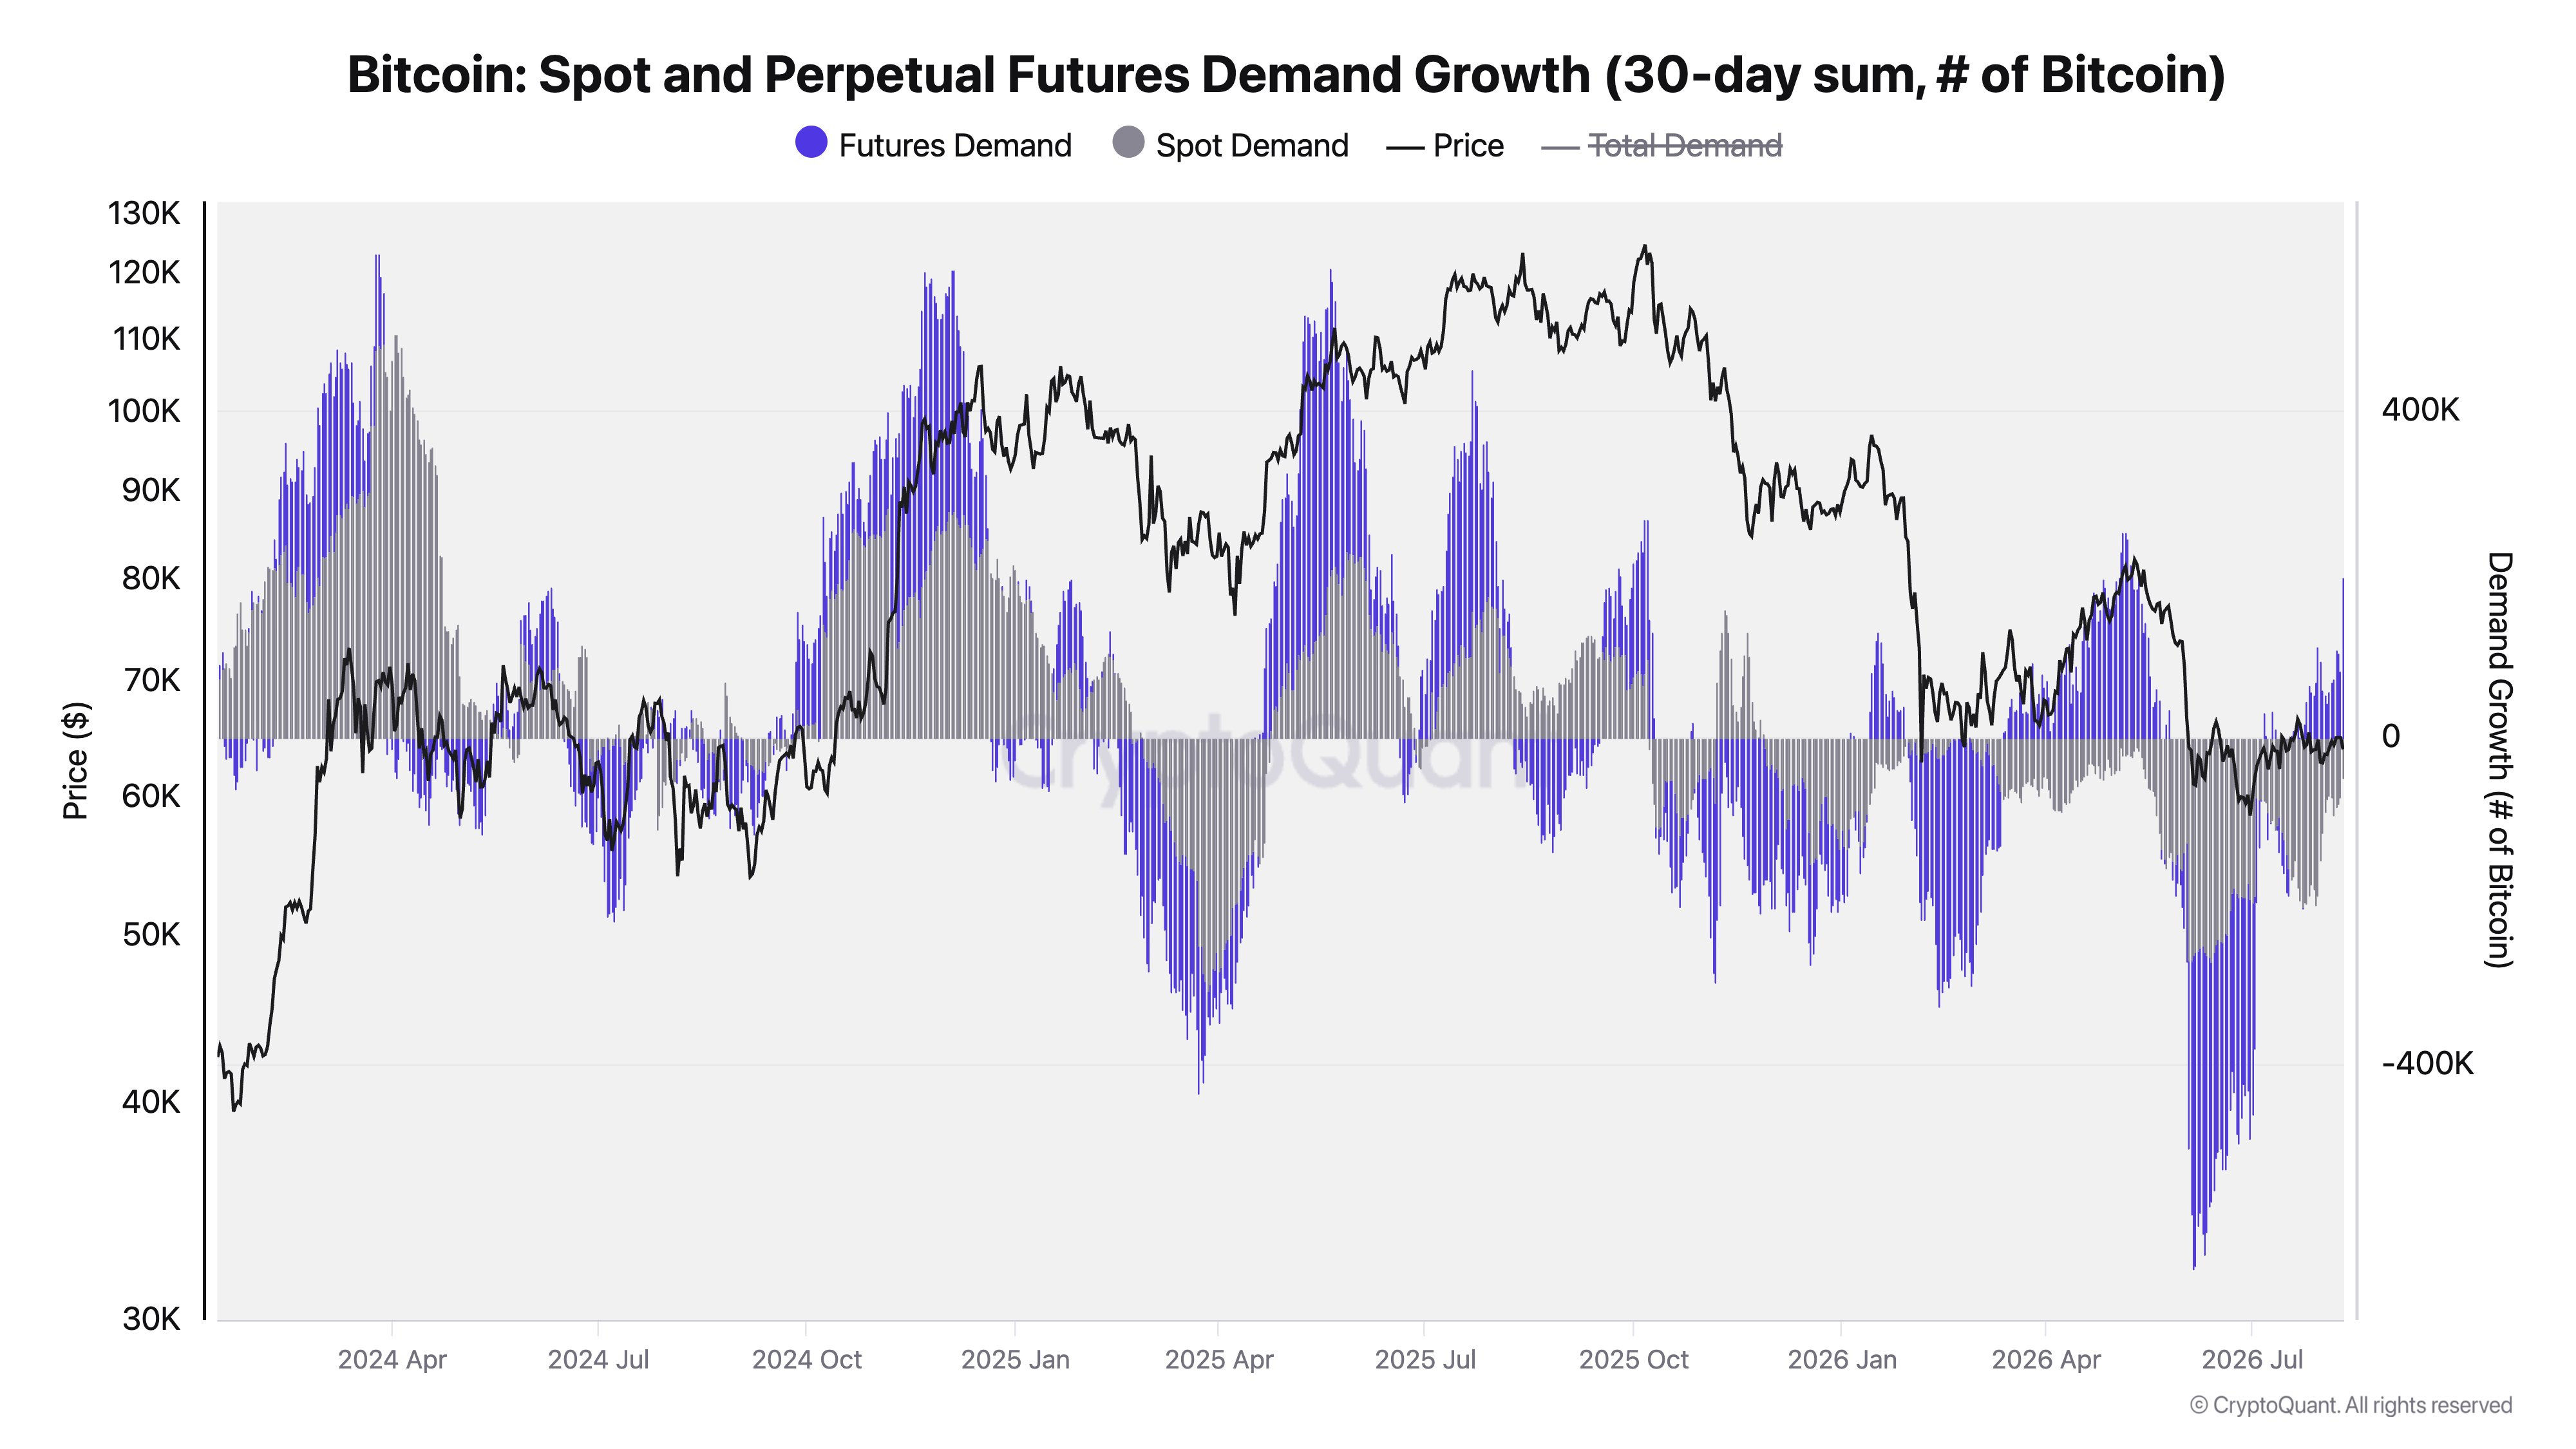
A durable rally needs both. April showed us how the futures-only version ends: Open interest builds, price grinds up, and the move fades the moment there’s nothing underneath to absorb the unwind.
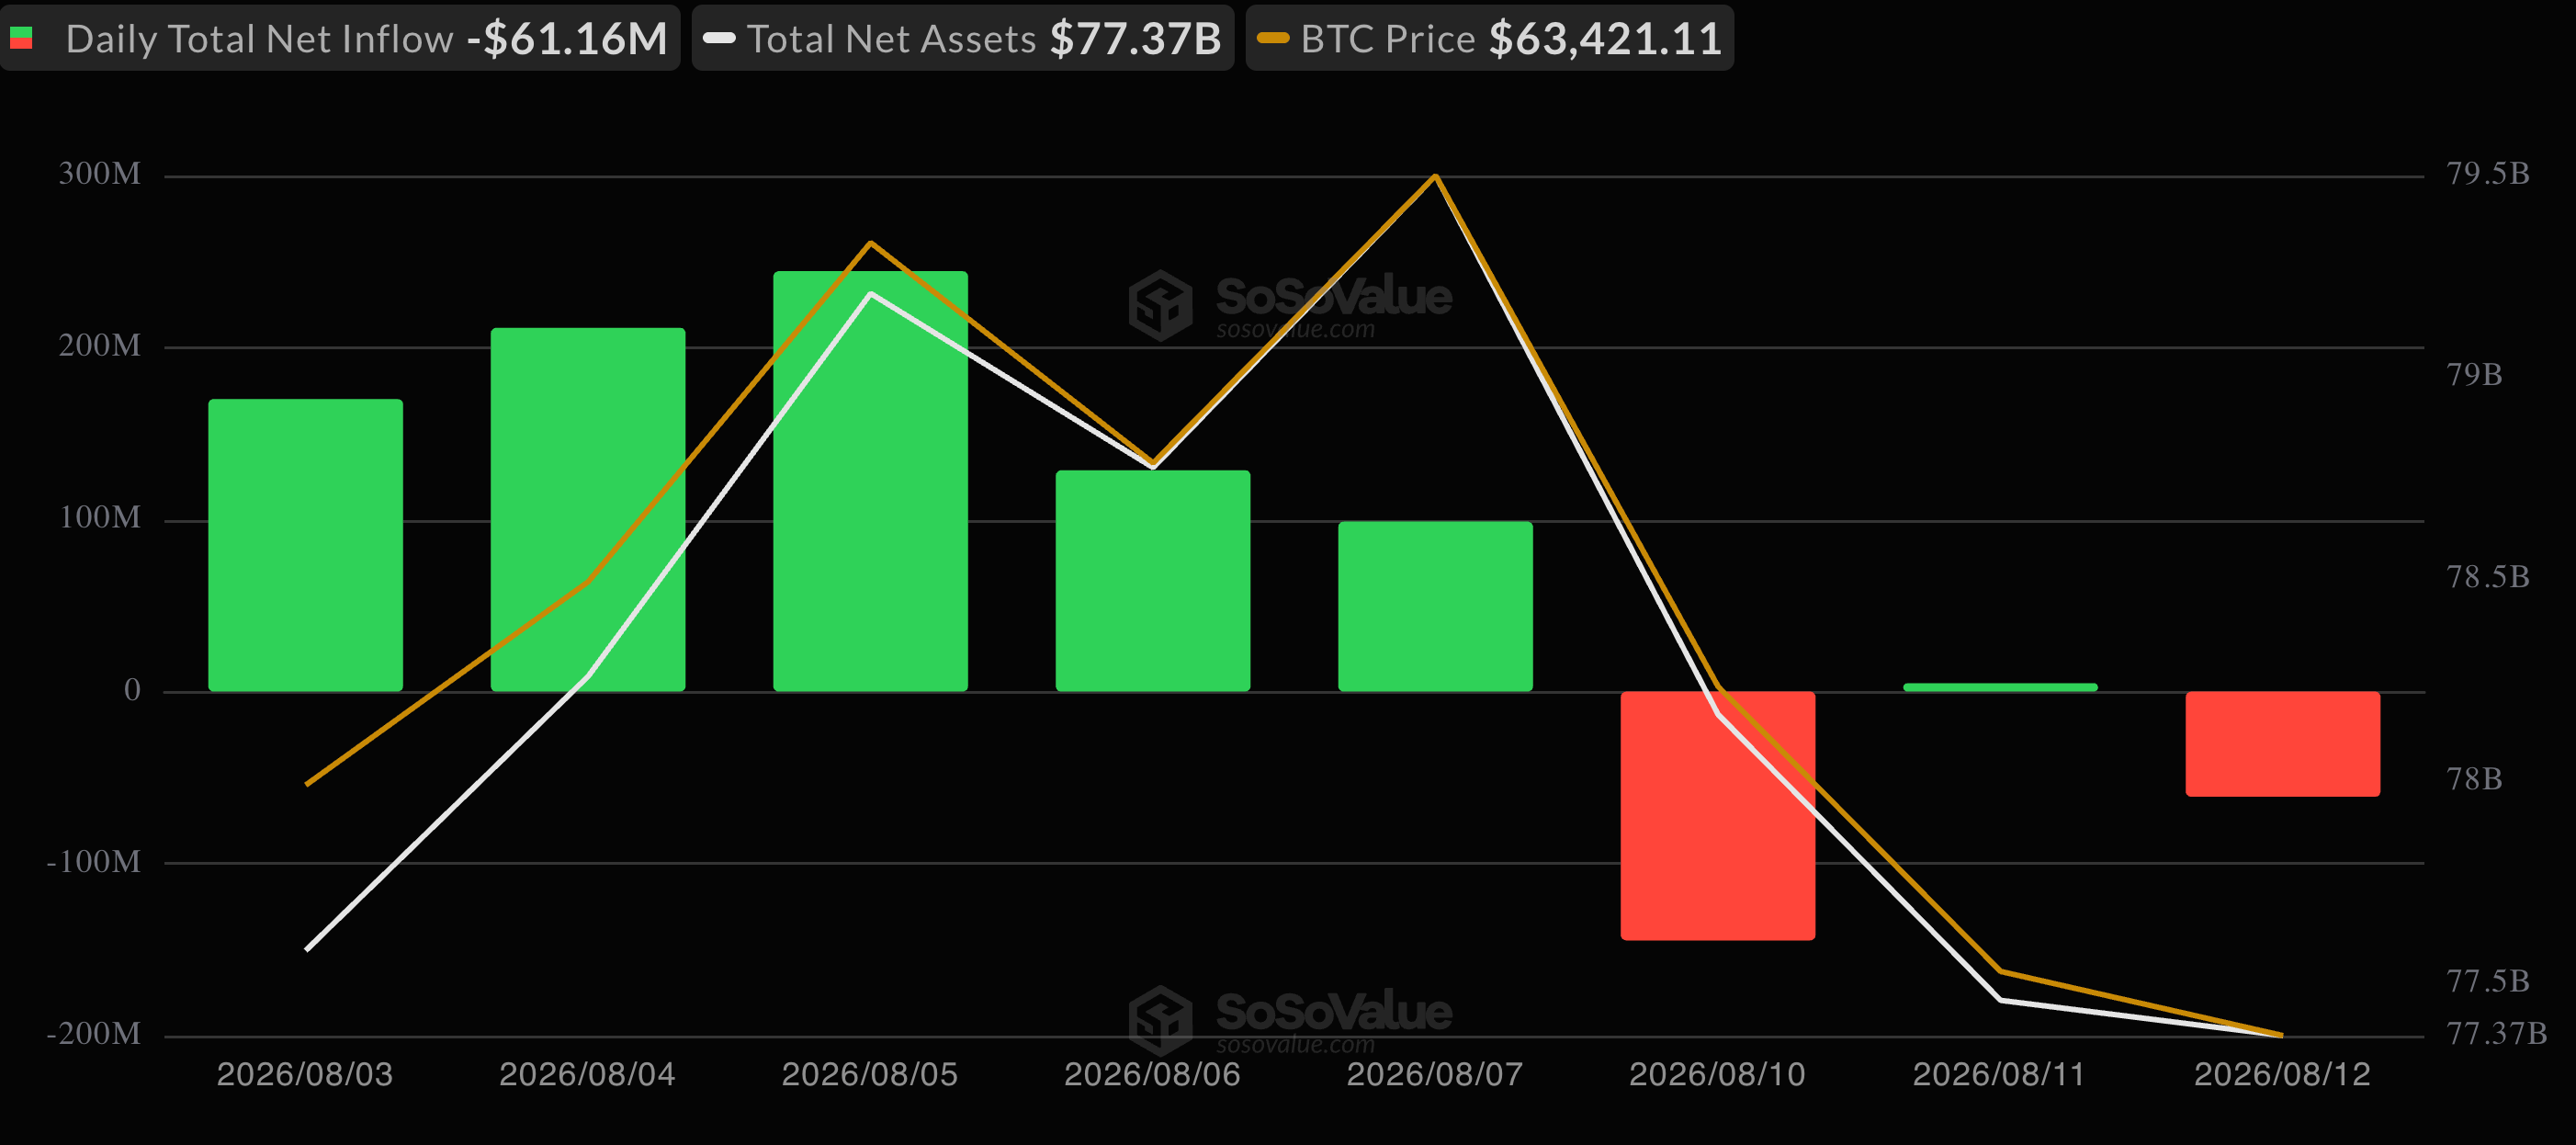
What fits into this picture. Spot Bitcoin ETFs saw outflows of $200 million since Monday this week, after we had the strongest week since April the week before.
And one structural buyer we all got used to is still selling. Strategy sold 1,690 BTC for $108.6 million between August 3 and 9, at an average of $64,262 against a $75,385 cost basis, its fourth consecutive week of selling. It also raised $653 million from new MSTR shares and pushed $650 million into its dollar reserve, now $4.65 billion.
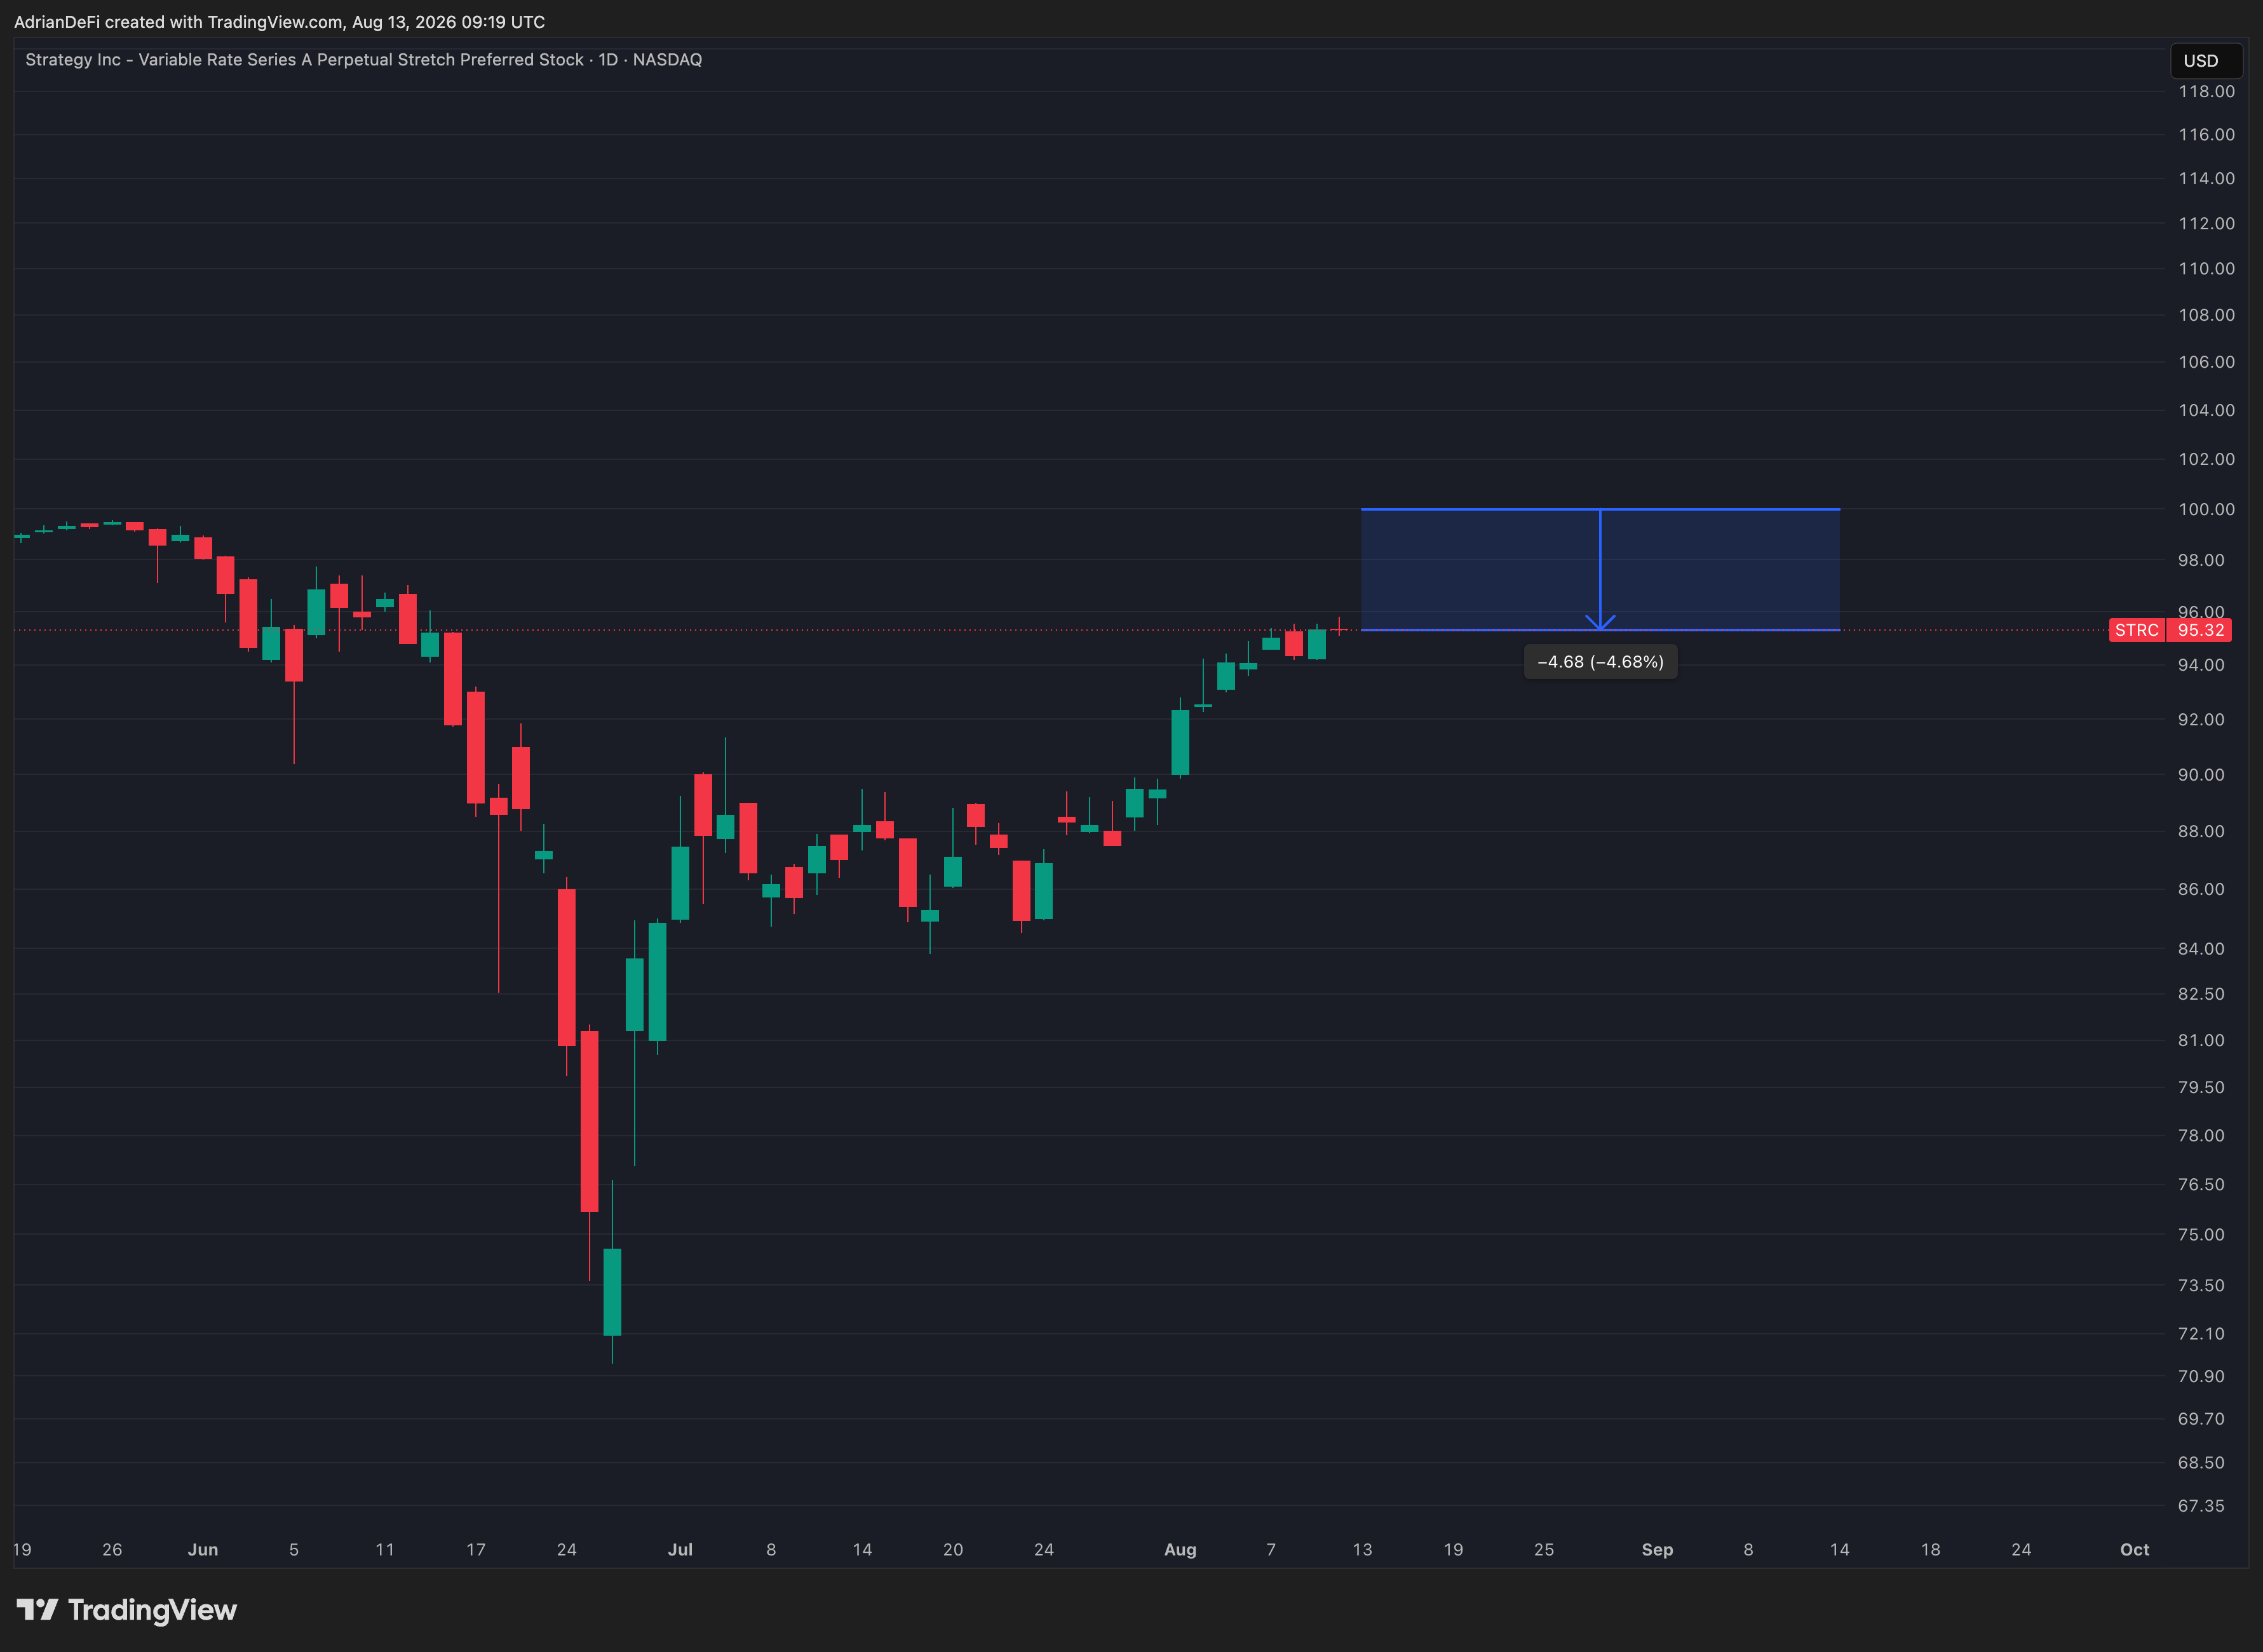
The Bitcoin proceeds went into buying back 1,152,020 STRC shares for $109 million. STRC is Strategy’s preferred share, the fixed-dividend instrument designed to trade around $100, and it broke well below that in June. So Michael Saylor’s Strategy is selling Bitcoin at a loss to defend its own preferred stock. That explains why STRC keeps creeping toward $100 while BTC and MSTR go sideways.
For four weeks now the company has been supply rather than demand. For a continuous rally we will need Strategy as a net BTC buyer again.

That covers the broader market. Now let’s move to the opportunities I discovered.
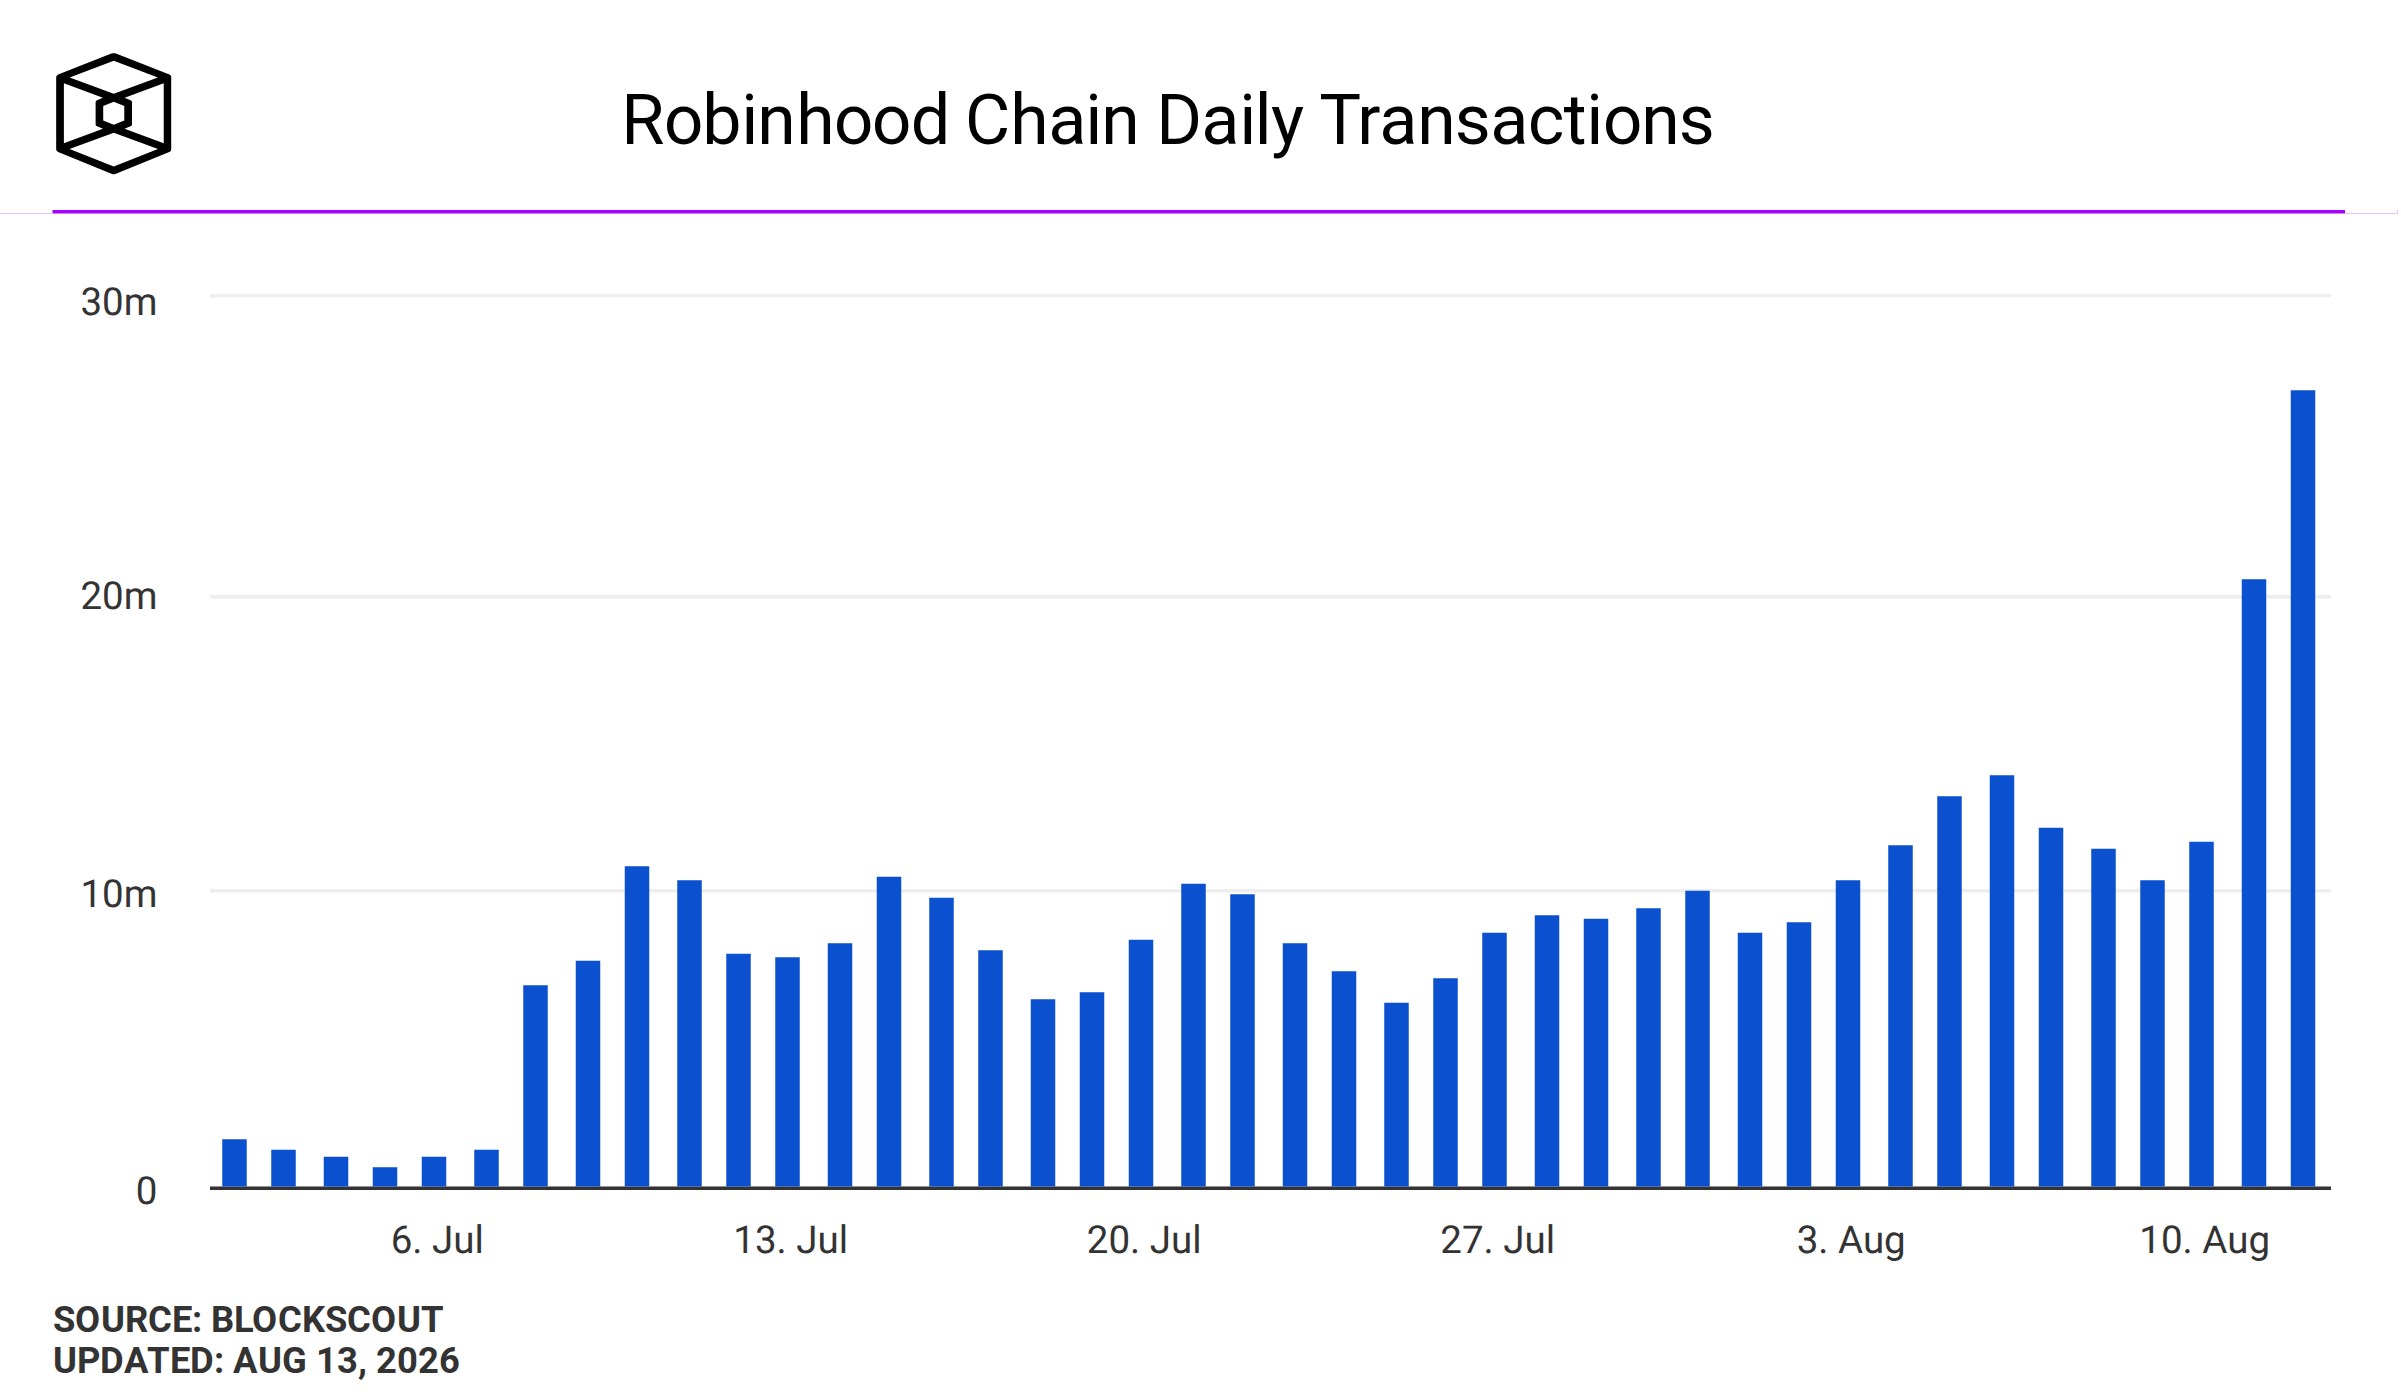
Robinhood Chain had a wild week. It averaged 11.6 million transactions per day between August 3 and 9, up about 30% week over week and the highest since launch, then on a single-day peak near 27 million on August 12.
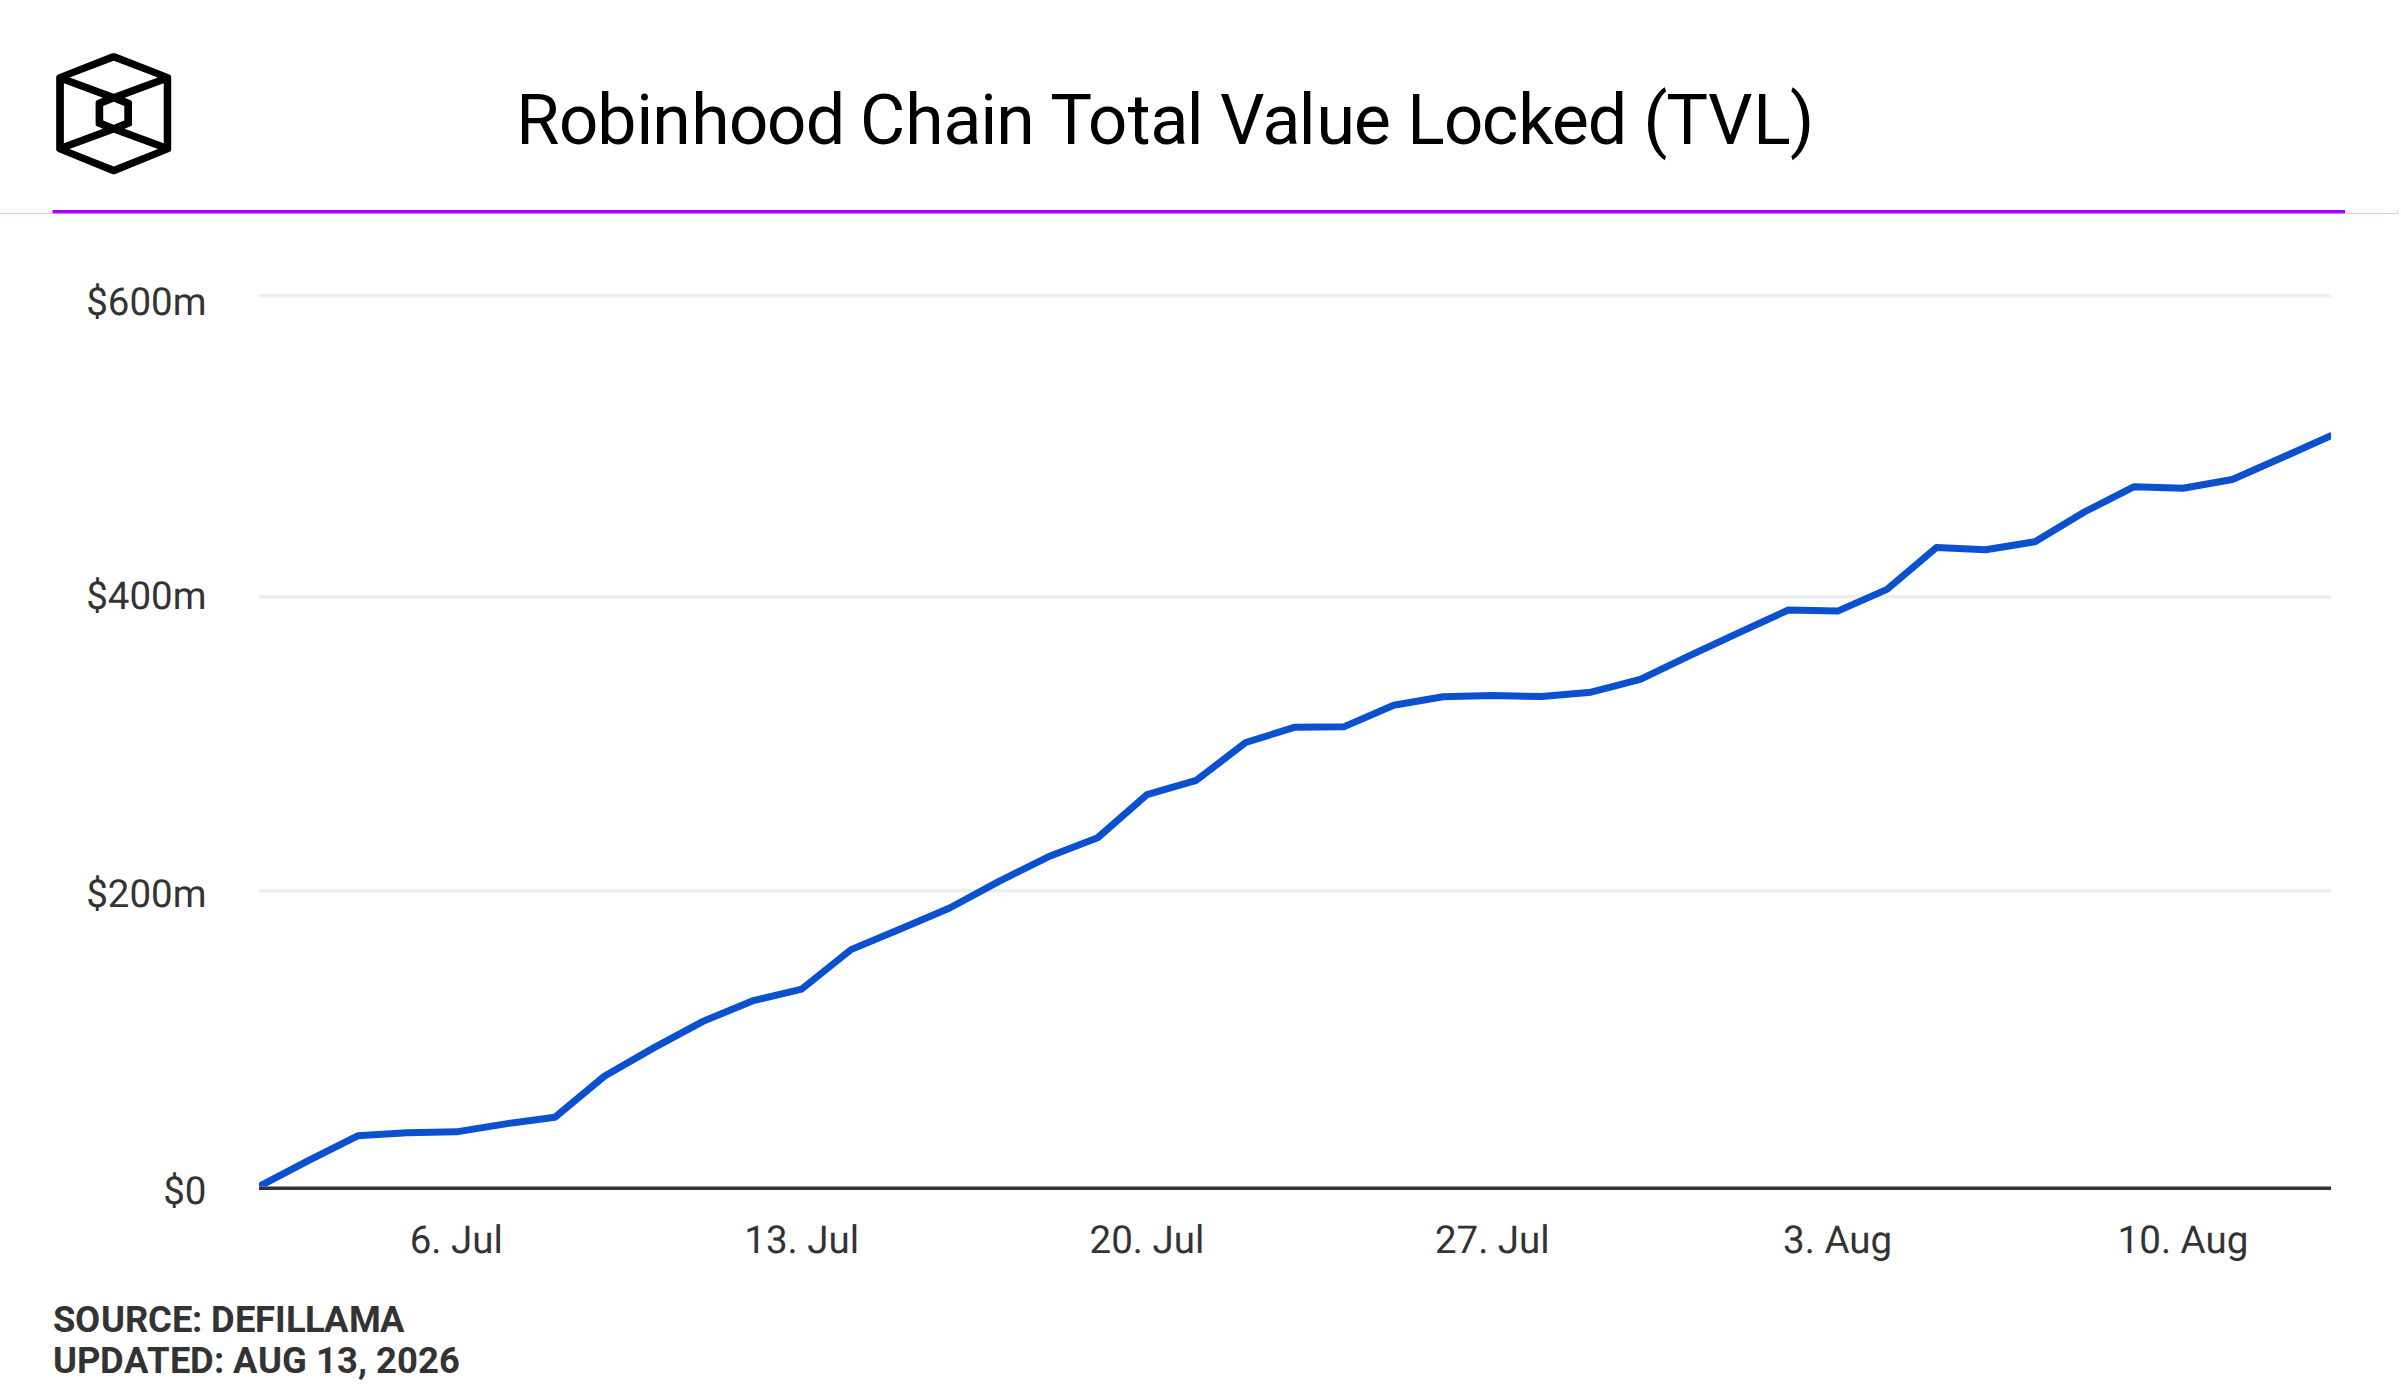
TVL sits close to $500 million and is up 20% on the week.
Most of that traffic has one explanation, and it isn’t tokenized stocks. It’s StonkPit, a browser-based proof-of-work protocol where users mine $DERP by clocking in and out, tied to StonkBrokers NFTs. Every clock-in is a transaction, so the count inflates fast. Gas spiked to roughly 70 times normal on the nights of August 10 and 11 (read more on X).
Separate the two numbers, because they carry very different weight. Transaction counts from a mining game cost almost nothing to manufacture and disappear the week the game gets boring. TVL is the harder one, and it’s grown from roughly $305 million in late July to near $500 million now, mostly on stablecoin deposits rather than game activity. So the activity headline is noise, and the deposits are the part with a chance of outliving the memecoin cycle this chain launched into. I’m watching whether TVL holds and I’ll keep you updated.

Let's talk about onchain AI, because Venice just handed us the cleanest case study of the year.
Venice raised $65 million at a $1 billion valuation led by Dragonfly.
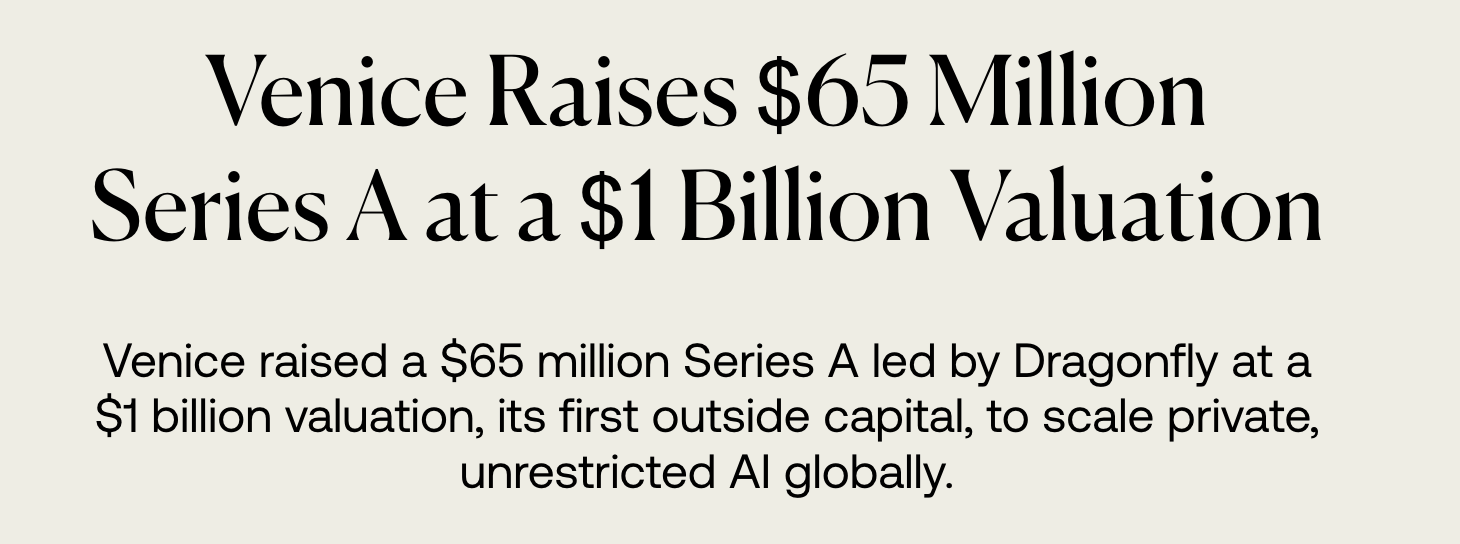
Equity round. It also runs VVV, one of the more clever token designs this cycle, and it’s profitable with annualized revenue above $70 million. So the question we should ask is: If the business is making money, who does that money belong to? The shareholders who just bought in, or the people holding the token?
That question is going to come up over and over as AI projects start earning real revenue. So here is how I answer it. Five questions, asked in this order:
Does the project make money?
If yes, where does that money land, with equity or with the token? If no, what’s the plan?
What does the token actually do? If staking pays a yield, does that yield come from revenue, or from printing more tokens?
If tokens get printed as incentives, is anything burning or locking them back up?
If the business 10x’d tomorrow, does the token mechanically come with it?
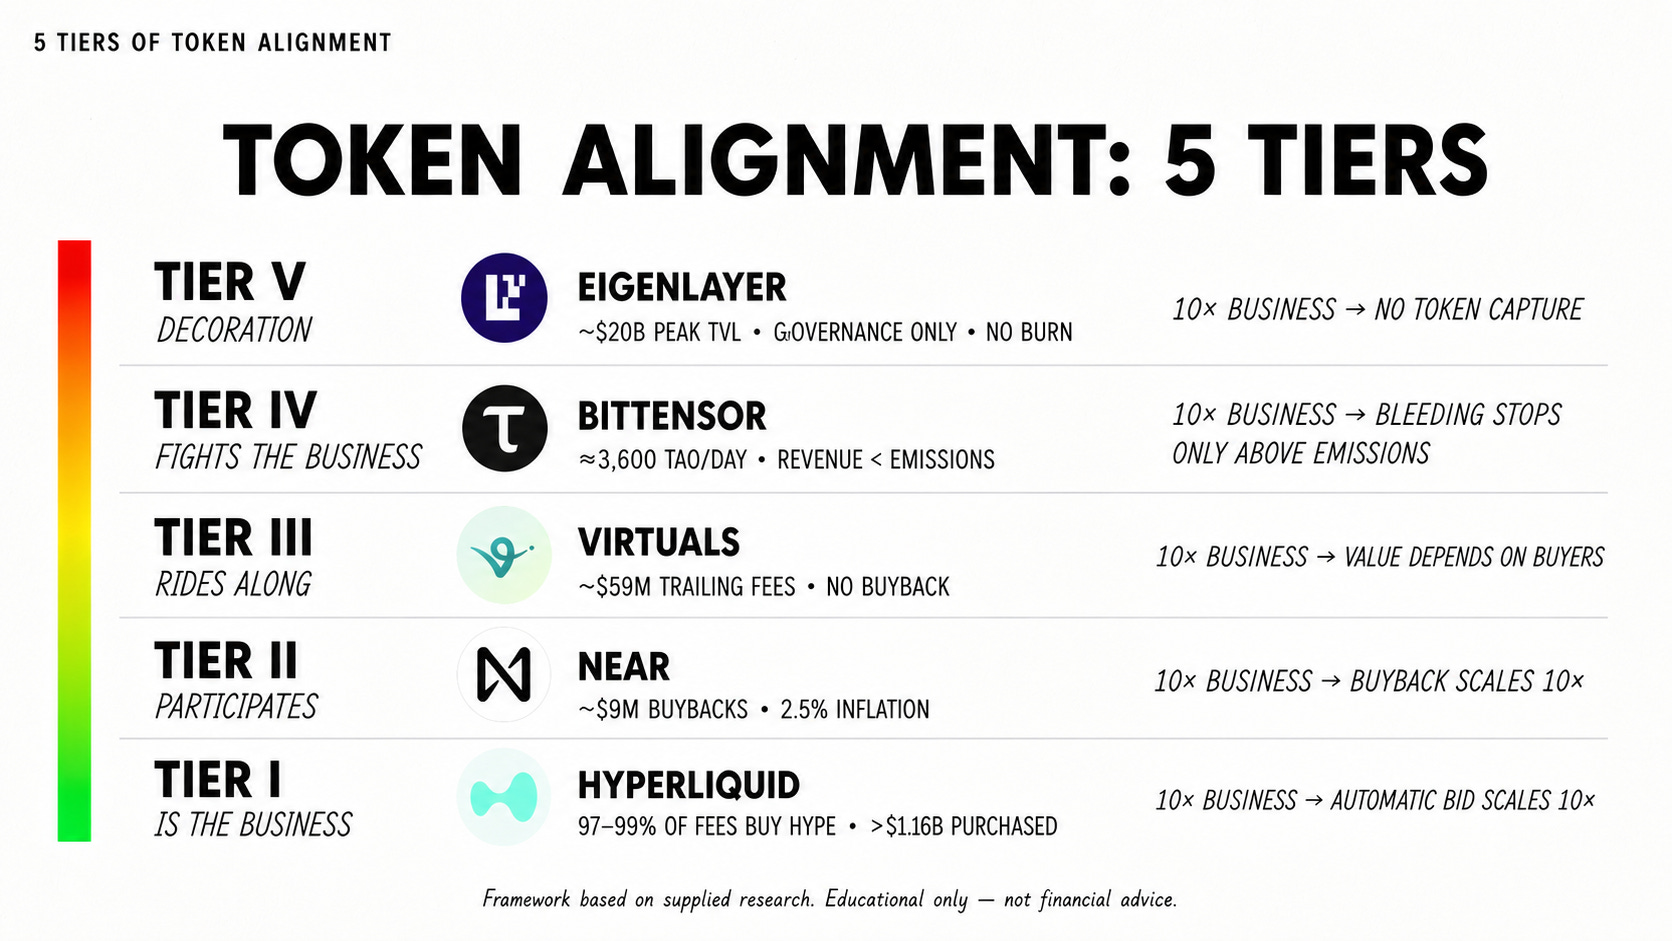
Run any project through those and it sorts itself into one of five tiers.
Tier 5, the token is decoration. EigenLayer is the clearest example, and it isn’t even an AI project, which tells you how common this is. It sells shared security for other networks. Almost nobody pays for that security, so revenue barely exists. EIGEN does nothing except vote. Tokens get printed as rewards and nothing burns them. At its peak the protocol held around $20 billion in deposits and none of that reached the token. If the business 10x’d, EIGEN captures none of it. Most of the last cycle sits in this tier and stays there, unless a team rewires the thing on purpose.
Tier 4, the token fights the business. Bittensor. Here revenue is real, and several subnets earn it. But the network prints roughly 3,600 TAO every day across 128 subnets to pay for the work, down from 7,200 after the December 2025 halving. Some subnets buy their own token back with revenue. None of them buy back more than they print. So the yield you earn is mostly new supply, the sinks are too small, and price bleeds no matter how good the technology is. If the business 10x’d, the token only stops bleeding once revenue passes emissions. One subnet breaking through flips that, the way SN3 Templar did earlier this year, so the tier can move.
Tier 3, the token rides along. Virtuals. Revenue is real, roughly $59 million in trailing fees. But it lands with the protocol, not the token. VIRTUAL is the launchpad currency and the pair in every agent’s liquidity pool, so it pumped hard when agent volume peaked. There is no buyback and no mechanical claim on the fees, just occasional community incentives. If the business 10x’d, VIRTUAL rises only if buyers decide it should. Venice sits in this tier too, which is why the equity round hit a nerve.
Tier 2, the token participates. NEAR is the cleanest one I track. Since February, revenue captured by NEAR Intents buys NEAR on the open market and hands it back to holders, and inflation was cut from 5% to 2.5% last October, so less is printed against it. Roughly $9 million of buybacks against a market cap near $2.1 billion doesn’t move price much yet. If the business 10x’d, the buyback 10x’s with it. The mechanism is right, the size isn’t there, and that’s the only thing keeping NEAR out of Tier 1.
Tier 1, the token is the business. Hyperliquid, still the only real occupant. Between 97% and 99% of trading fees go into buying HYPE on the open market, automatically, with over $1.16 billion purchased since inception. Team unlocks land every month and get absorbed anyway, because the buying scales with trading volume instead of with sentiment. If the business 10x’d, so does the bid under the token. No decision required from anyone.
Why it matters: in Tier 1 and Tier 2 the mechanism does the work whether or not the team stays honest. Everything below that is a promise. So the tier is a position-sizing input for me, not a buy signal. Tier 1 and Tier 2 can carry a core allocation. Tier 3 and Tier 4 go in the speculative part of the portfolio.
The risk: Tiers move, and my read can be early or plain wrong. Buybacks get paused, revenue that looks structural can be one narrative cycle deep, and a well-aligned token on a business that stops growing still goes nowhere.
If you want a straight to the point newsletter full of calls, new projects, airdrop farms, memecoin and DeFi moonshots, then Hix0n’s Confidential is the place for you. I can really recommend his take (if you’re comfortable with high risk).
For education and discussion only, not financial advice.
That’s it for today’s episode, thank you for being here!
Till next time, stay safe!
No posts
Comments
Nothing yet. Say the first thing.
Sign in to join the conversation.