
Hey Friend!
Open interest fell 8.7% during a 30% rally. More on what that tells us later in this letter.
Last week I wrote that equities printed a record high, Bitcoin wasn’t affected by it, and that argued against the cycle low being behind us.
This week Bitcoin went first.
Bitcoin rose above $79k, now up +30% in 4 days. Crypto markets have now added +$450 billion in market cap since Monday.
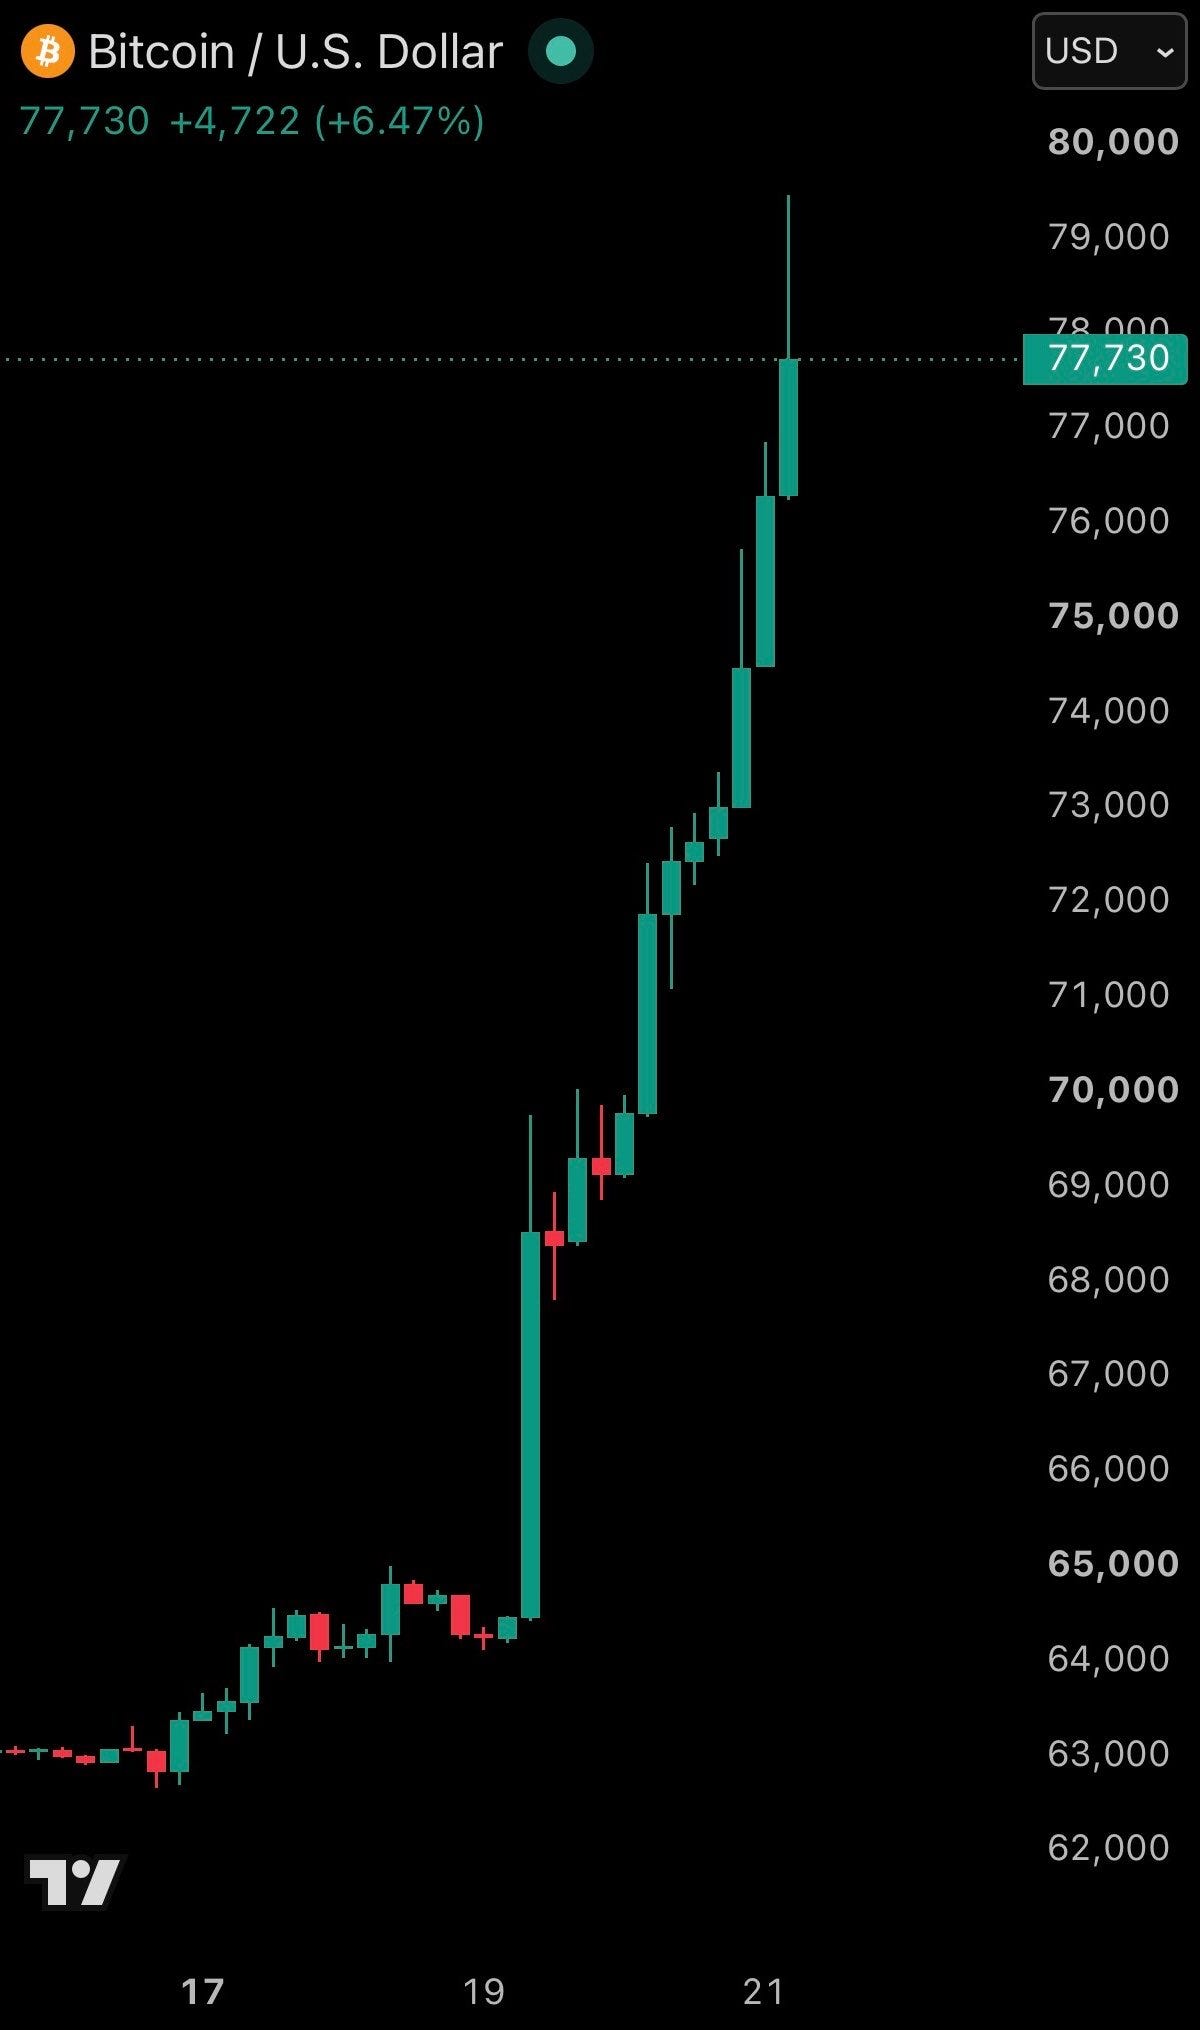
By the way it also produced the largest single-day short liquidation in its history. None of that started with a crypto headline. It started with the US Treasury in Washington.
Gold moved. Silver moved. Equities moved. Bitcoin just the fastest.
So the question isn’t whether the rally is happening. It’s whether the fundamentals underneath it are real, or whether $1.9 billion of leverage got flushed and we just decide to call it a bottom.
Let’s get into the broader picture and how to set up for the coming week:
📈 Market Update – Bitcoin surged above $79K as Treasury buybacks pushed long-end yields lower. ETF inflows and whale accumulation improved, but Coinbase premium stayed negative and BTC-denominated open interest fell 8.7%, leaving the bottom unconfirmed.
🐂 Alpha Insights – I’m not chasing here. My resting BTC order is $68,961, with a $67,500 stop and $79,584 target if price retraces into the confluence zone.

The current state of the market.
Start with the bond market, because everything else this week hangs off it.
On Tuesday the 30-year Treasury yield hit 5.337%, the highest since 2007. Japanese 10 and 30 year yields hit multi-decade highs in the same period. The pressure was global.
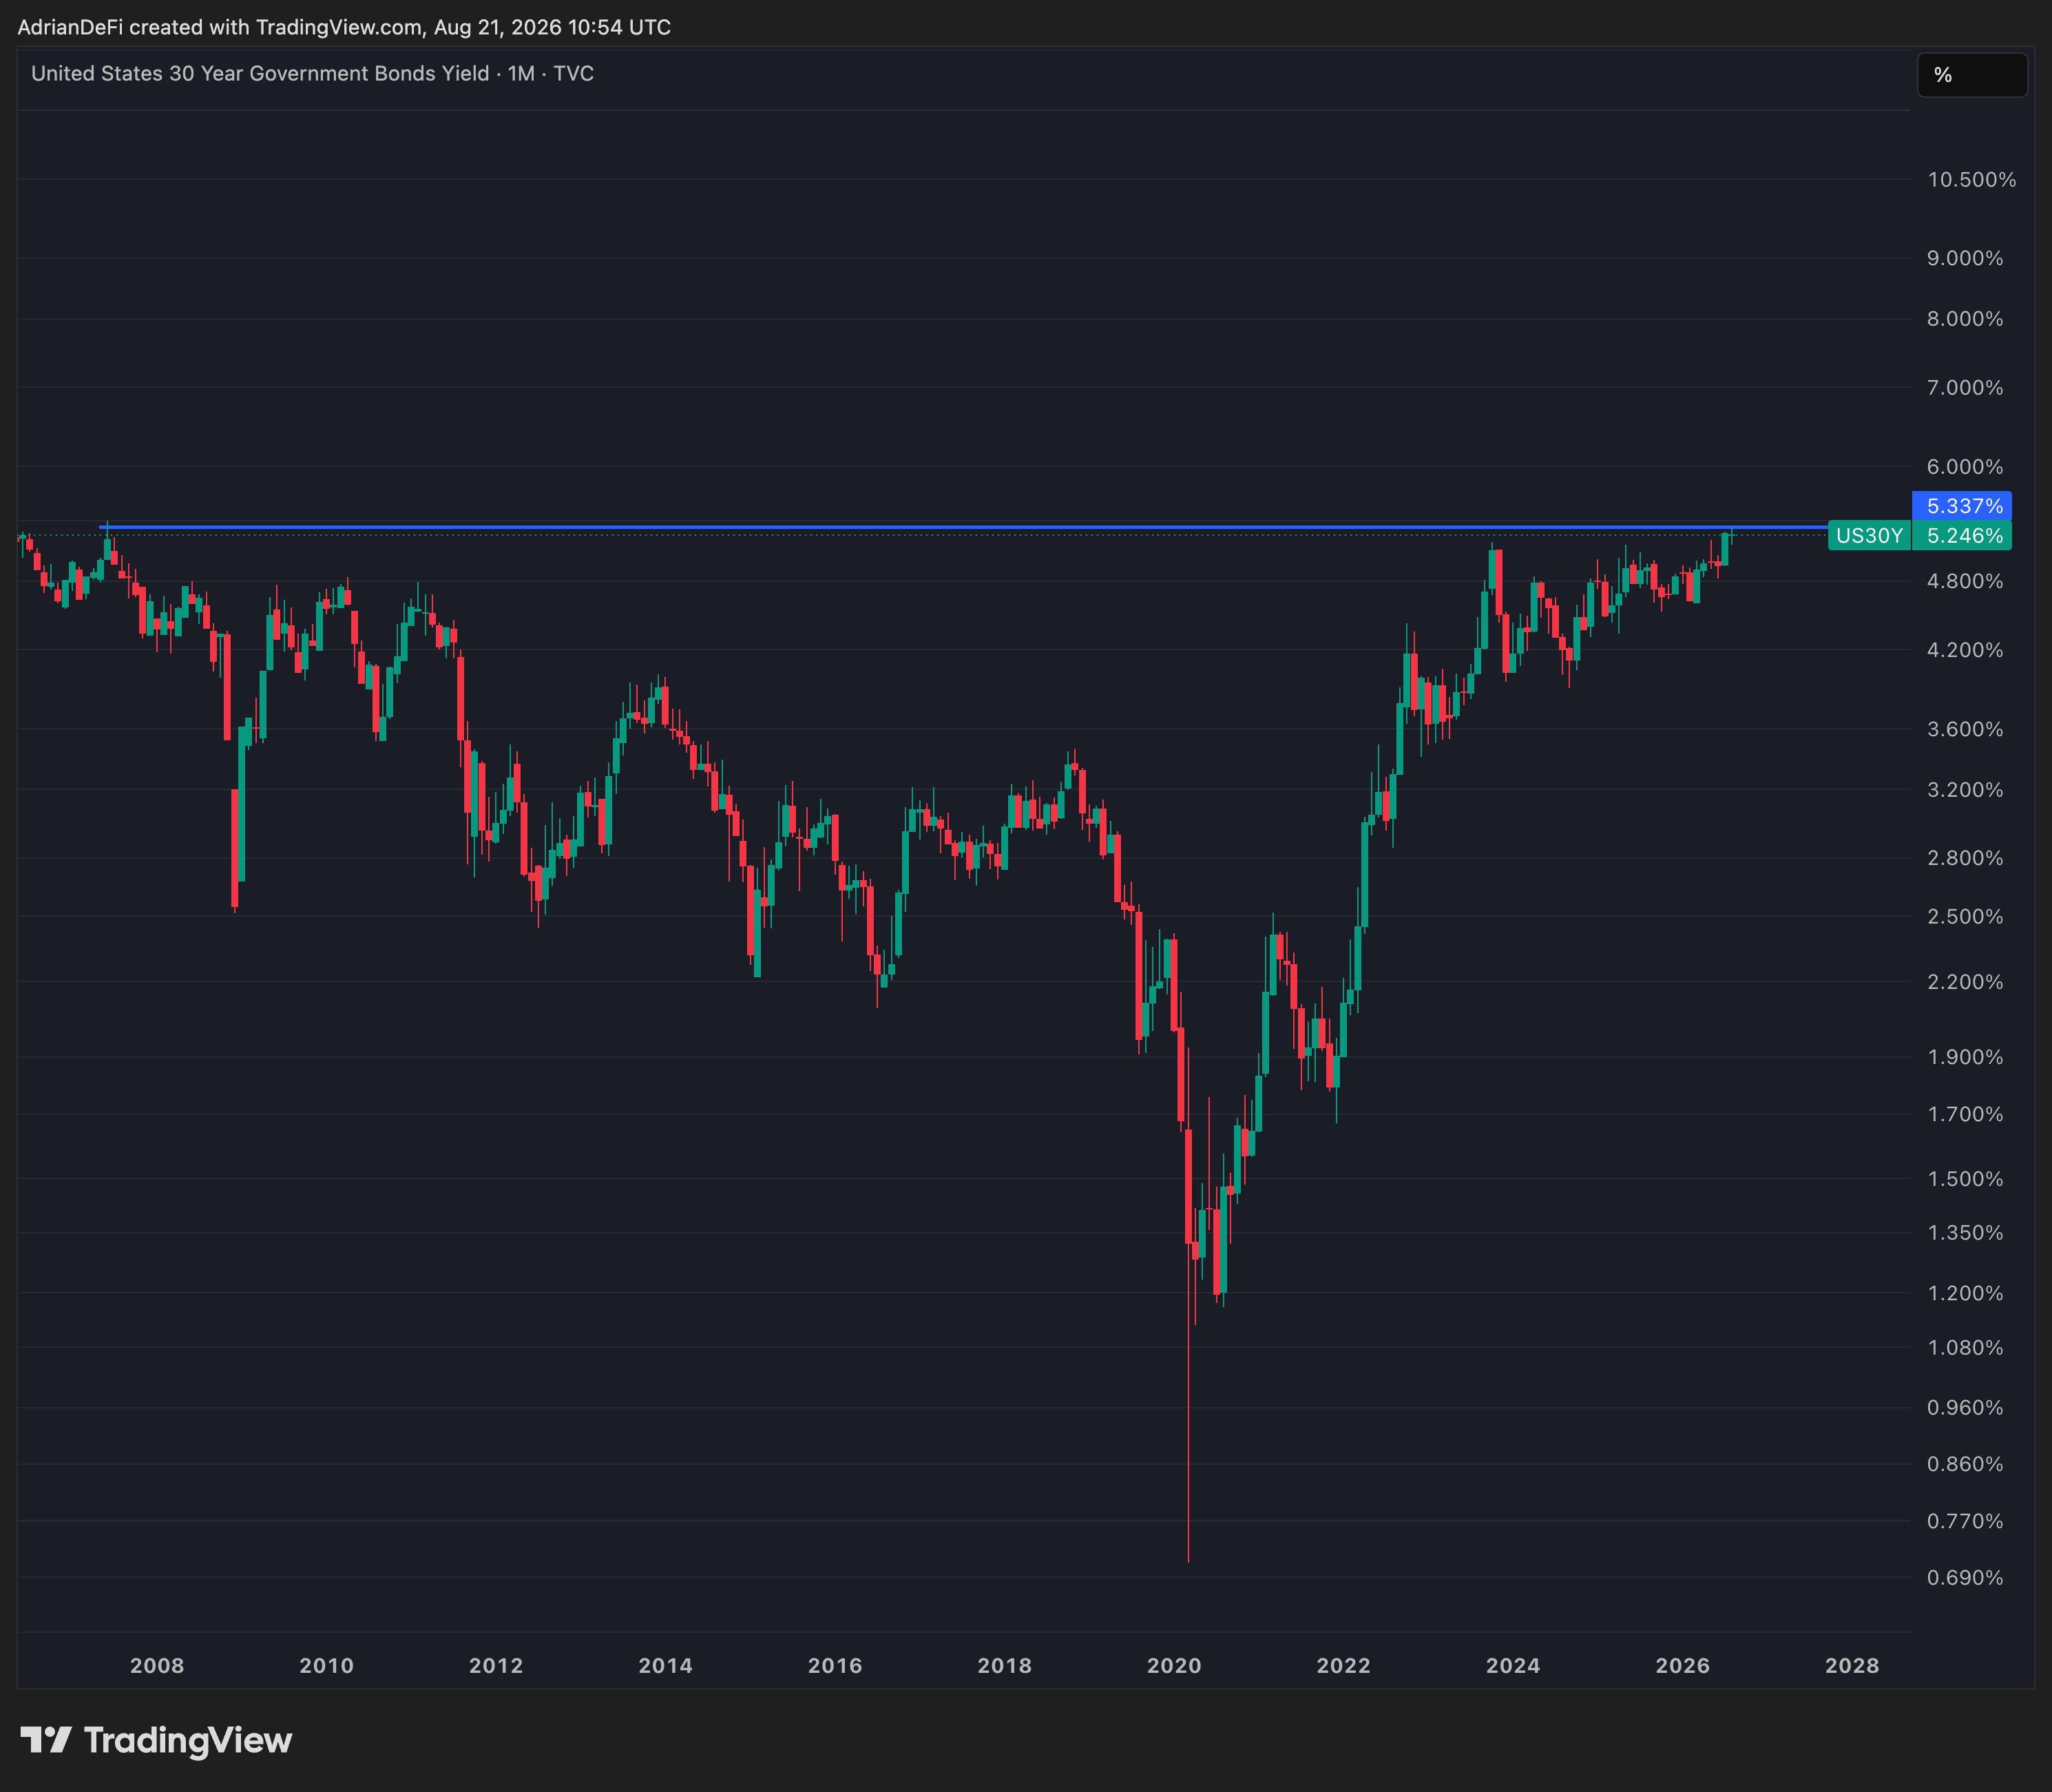
The long end is the price of money for everything else, and the US government refinancing $40 trillion of debt at those levels has a real problem. Interest payments over the past twelve months touched roughly $1.4 trillion, about three times what they were in 2020.
Then Wednesday.
The Treasury announced it is at least doubling its long-end buyback operations, from $2 billion to $4 billion per operation and from two operations a quarter to four. That’s up to $16 billion a quarter, targeting securities that mature in 10 to 30 years. They start September 9 and run through November 4.
Quick for your understanding: a buyback is the Treasury going into the open market and repurchasing its own outstanding bonds. The government shows up as a buyer of its own debt.
Within hours the 30-year fell about 15 basis points to roughly 5.19%. The 10-year eased to around 4.65%.
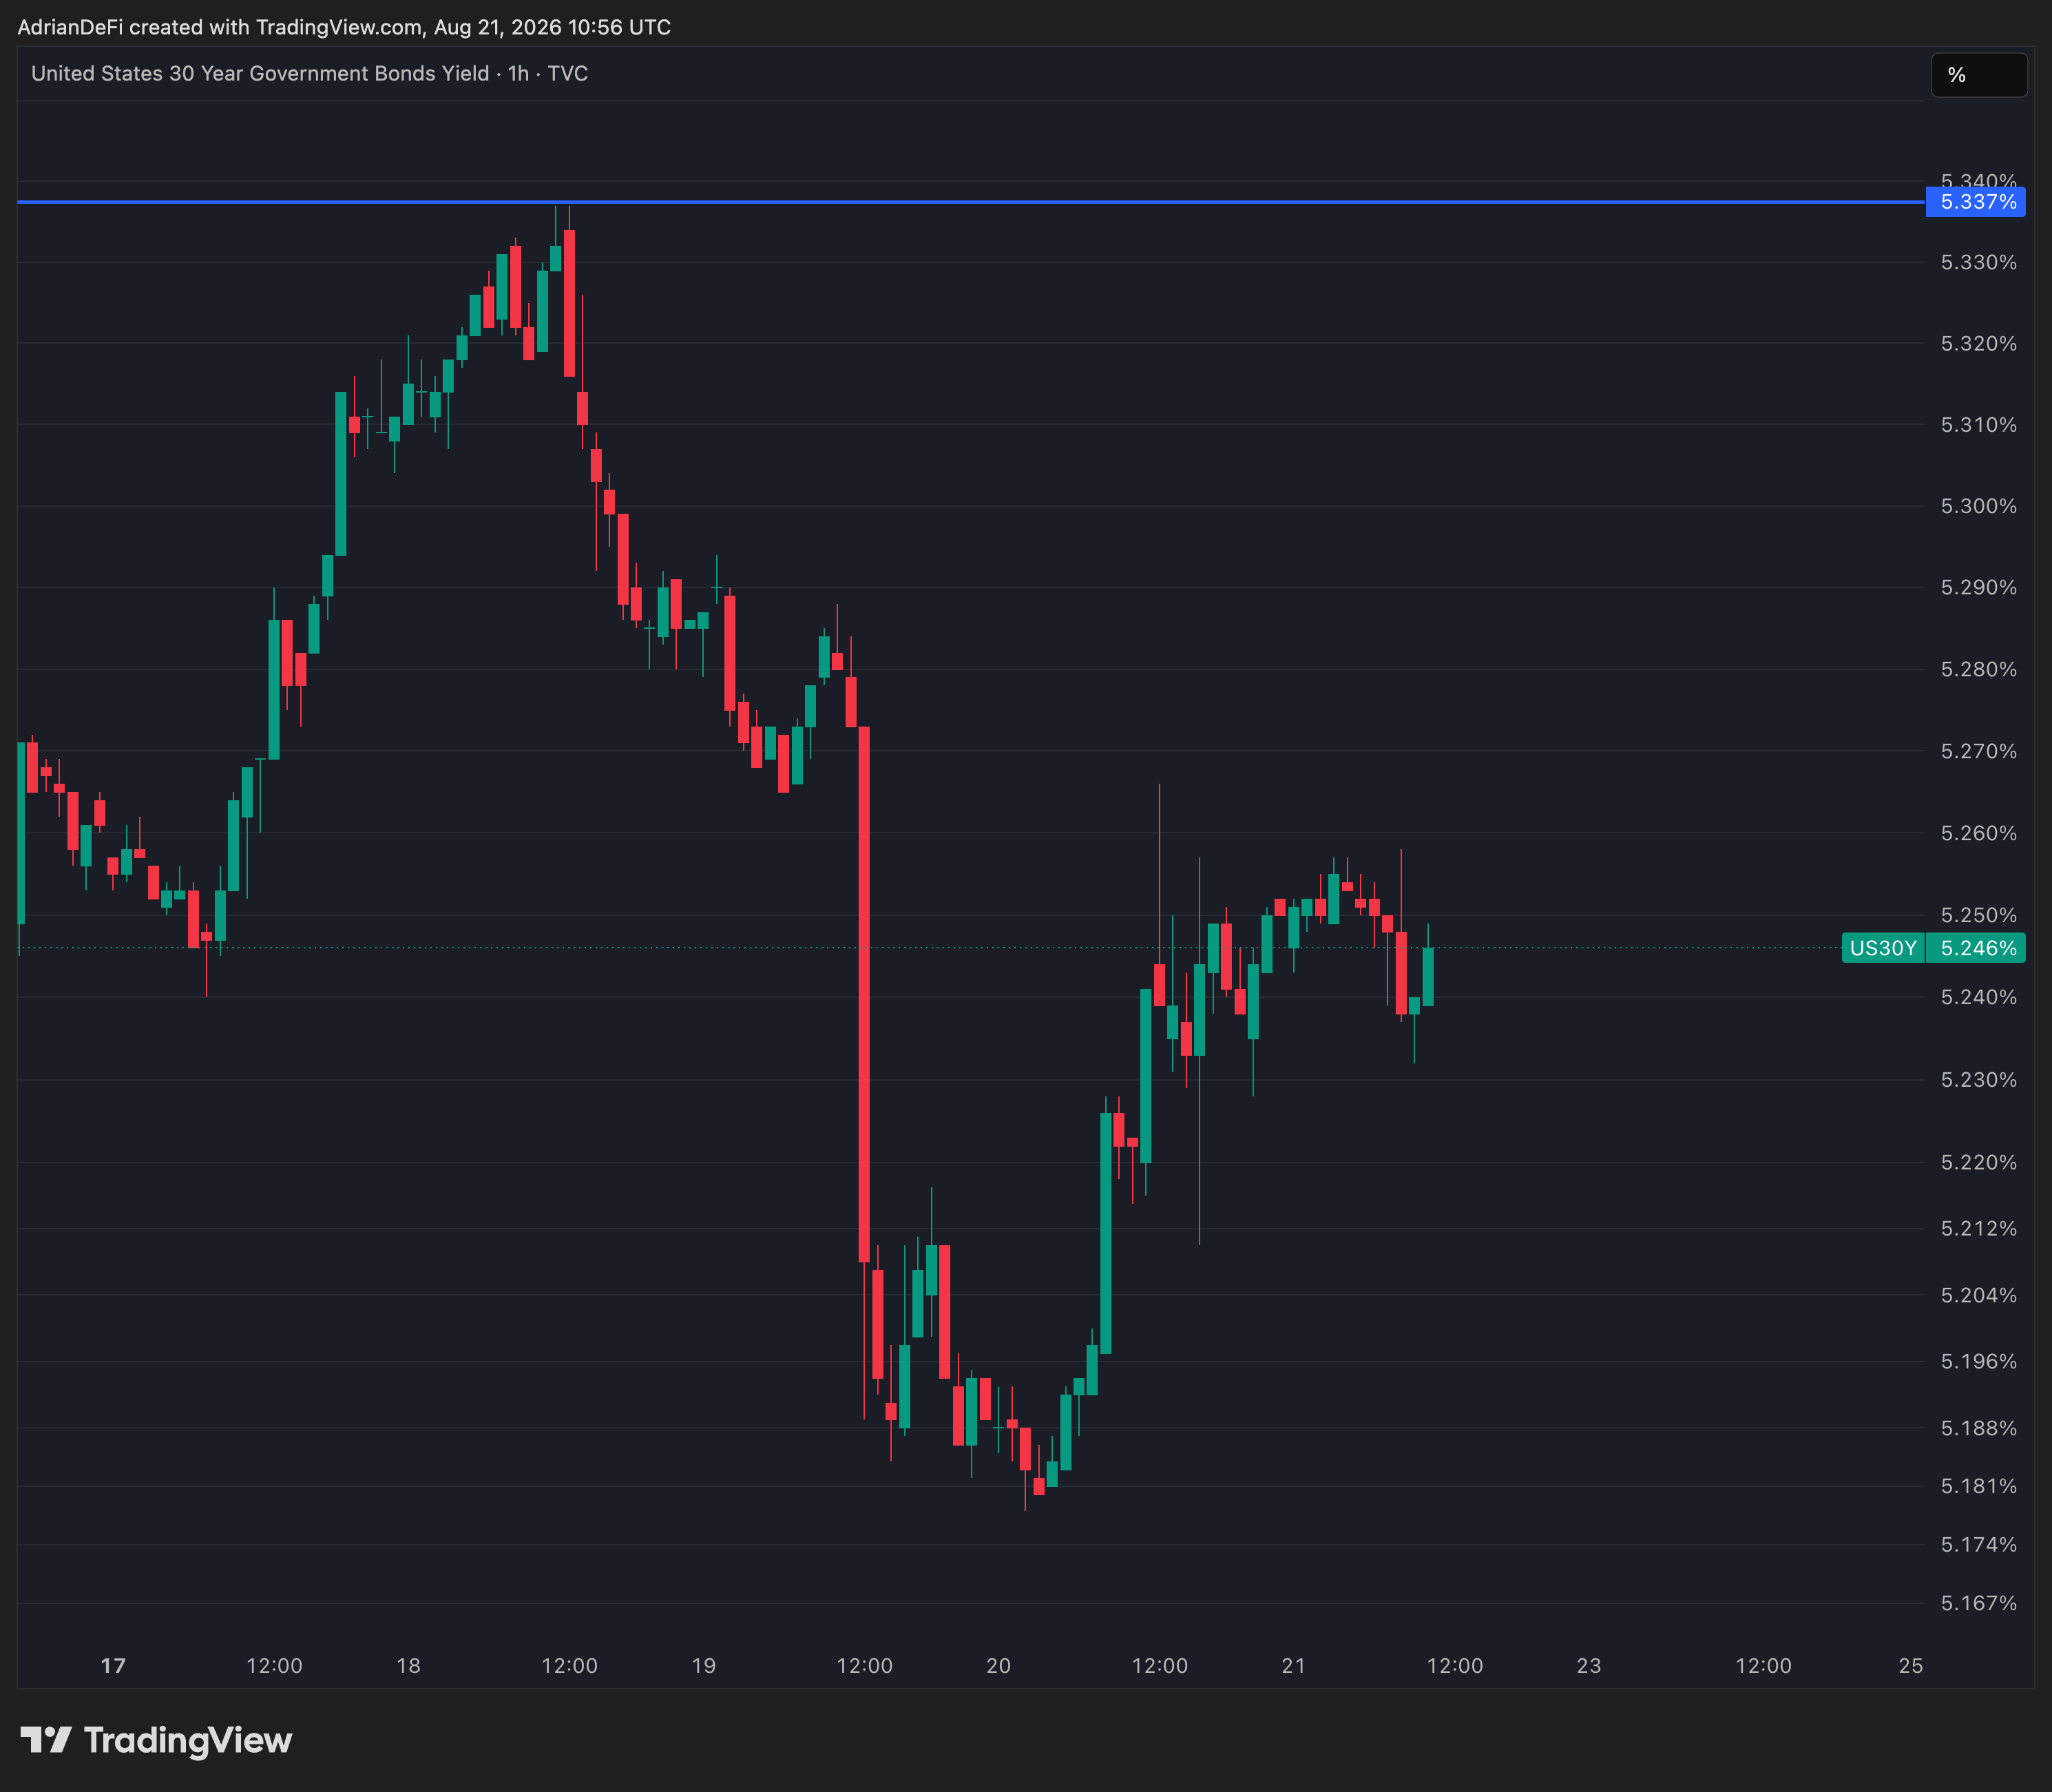
→ More than $7 trillion of Treasury paper is outstanding at 10 years or longer, so a compression that size is worth tens of billions in mark-to-market value to whoever holds it. That’s why every other asset moved with it.
Most of the commentary called this money printing. It isn’t, and it isn’t formal yield curve control either. The Treasury doesn’t create dollars, and the buybacks get funded by issuing more short-dated debt.
What’s happening is a duration swap: shortening the maturity of the national debt to stop the long end from breaking. Narrower than QE, and in one way bigger, because the Treasury did it without the Fed. Support for the bond market just moved to the fiscal side, where there is no meeting calendar and no vote.
Markets priced it as a currency event. Gold and silver outperformed equities and Bitcoin repriced.
What’s important to track underneath the macro:
Not a single new Bitcoin buyer was required for any of that. Falling yields did the work. So how much of the move is real?
Start with the part that isn’t. Shorts got wiped out, with total crypto liquidations near $3.5 billion in 24 hours.
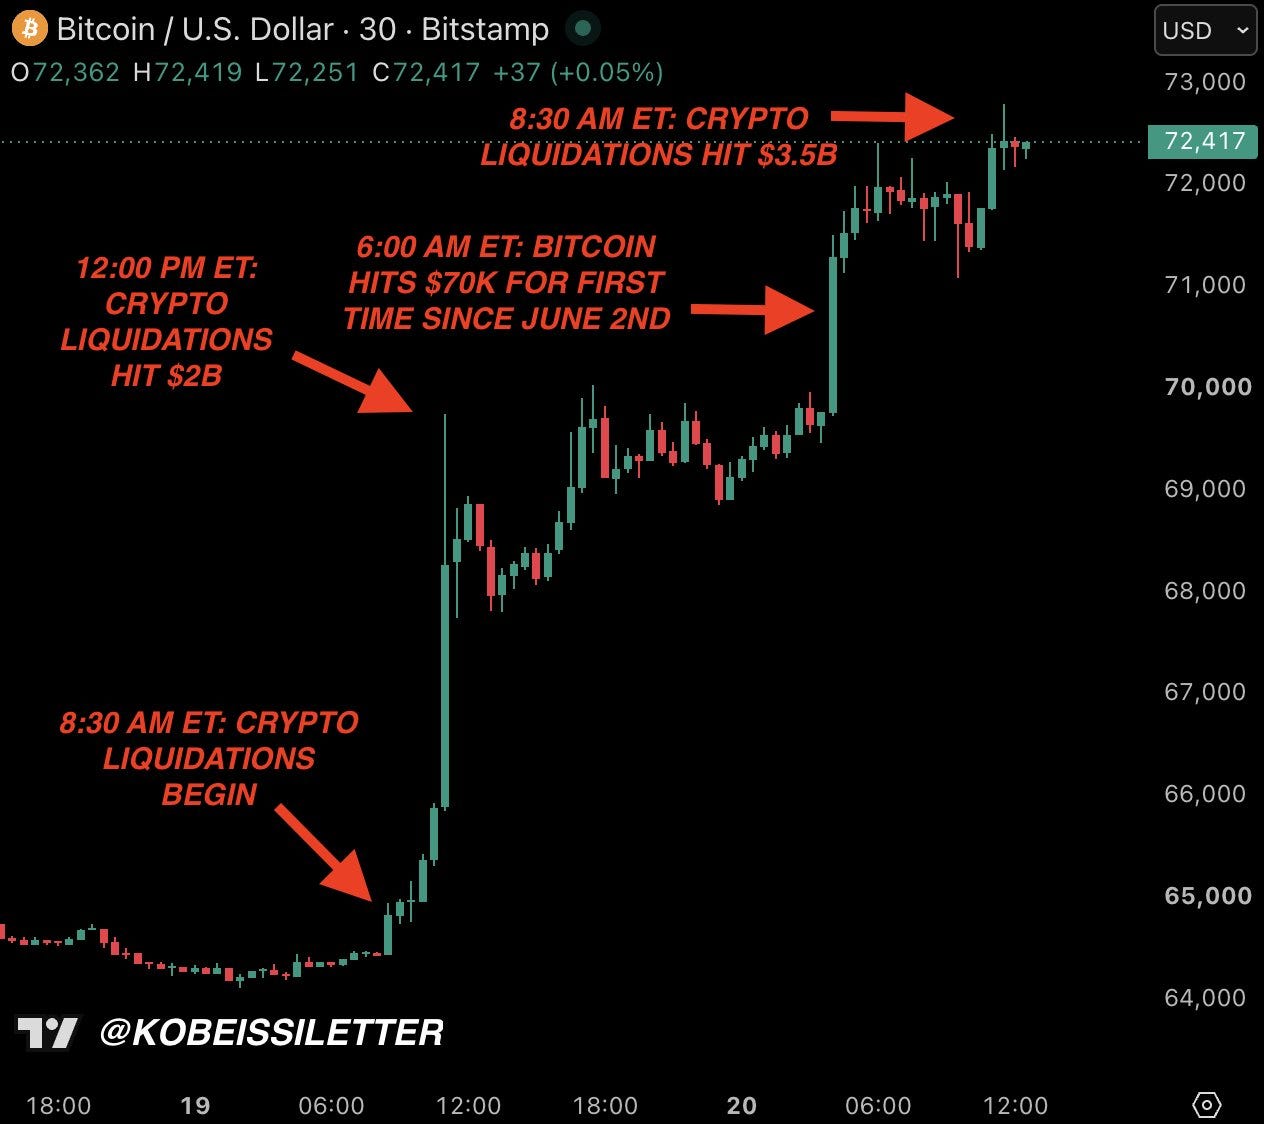
Quick for your understanding: when a market is heavily positioned for a decline and price does the opposite, short sellers have to buy back to survive. That buying pushes price higher, which forces more of them to buy back. I
A squeeze can produce a sharp move. It cannot sustain one. Once the leverage clears, the rally lives or dies on spot demand, which brings us to the thing I’ve been complaining about in this letter for weeks.
The bid has been futures-led. Leverage building, spot buying falling away, nothing underneath to absorb an unwind. This week that flipped. CryptoQuant’s demand measure, a 30-day sum of demand growth in spot and perpetual futures, turned positive in both for the first time since the October 2025 all-time high.
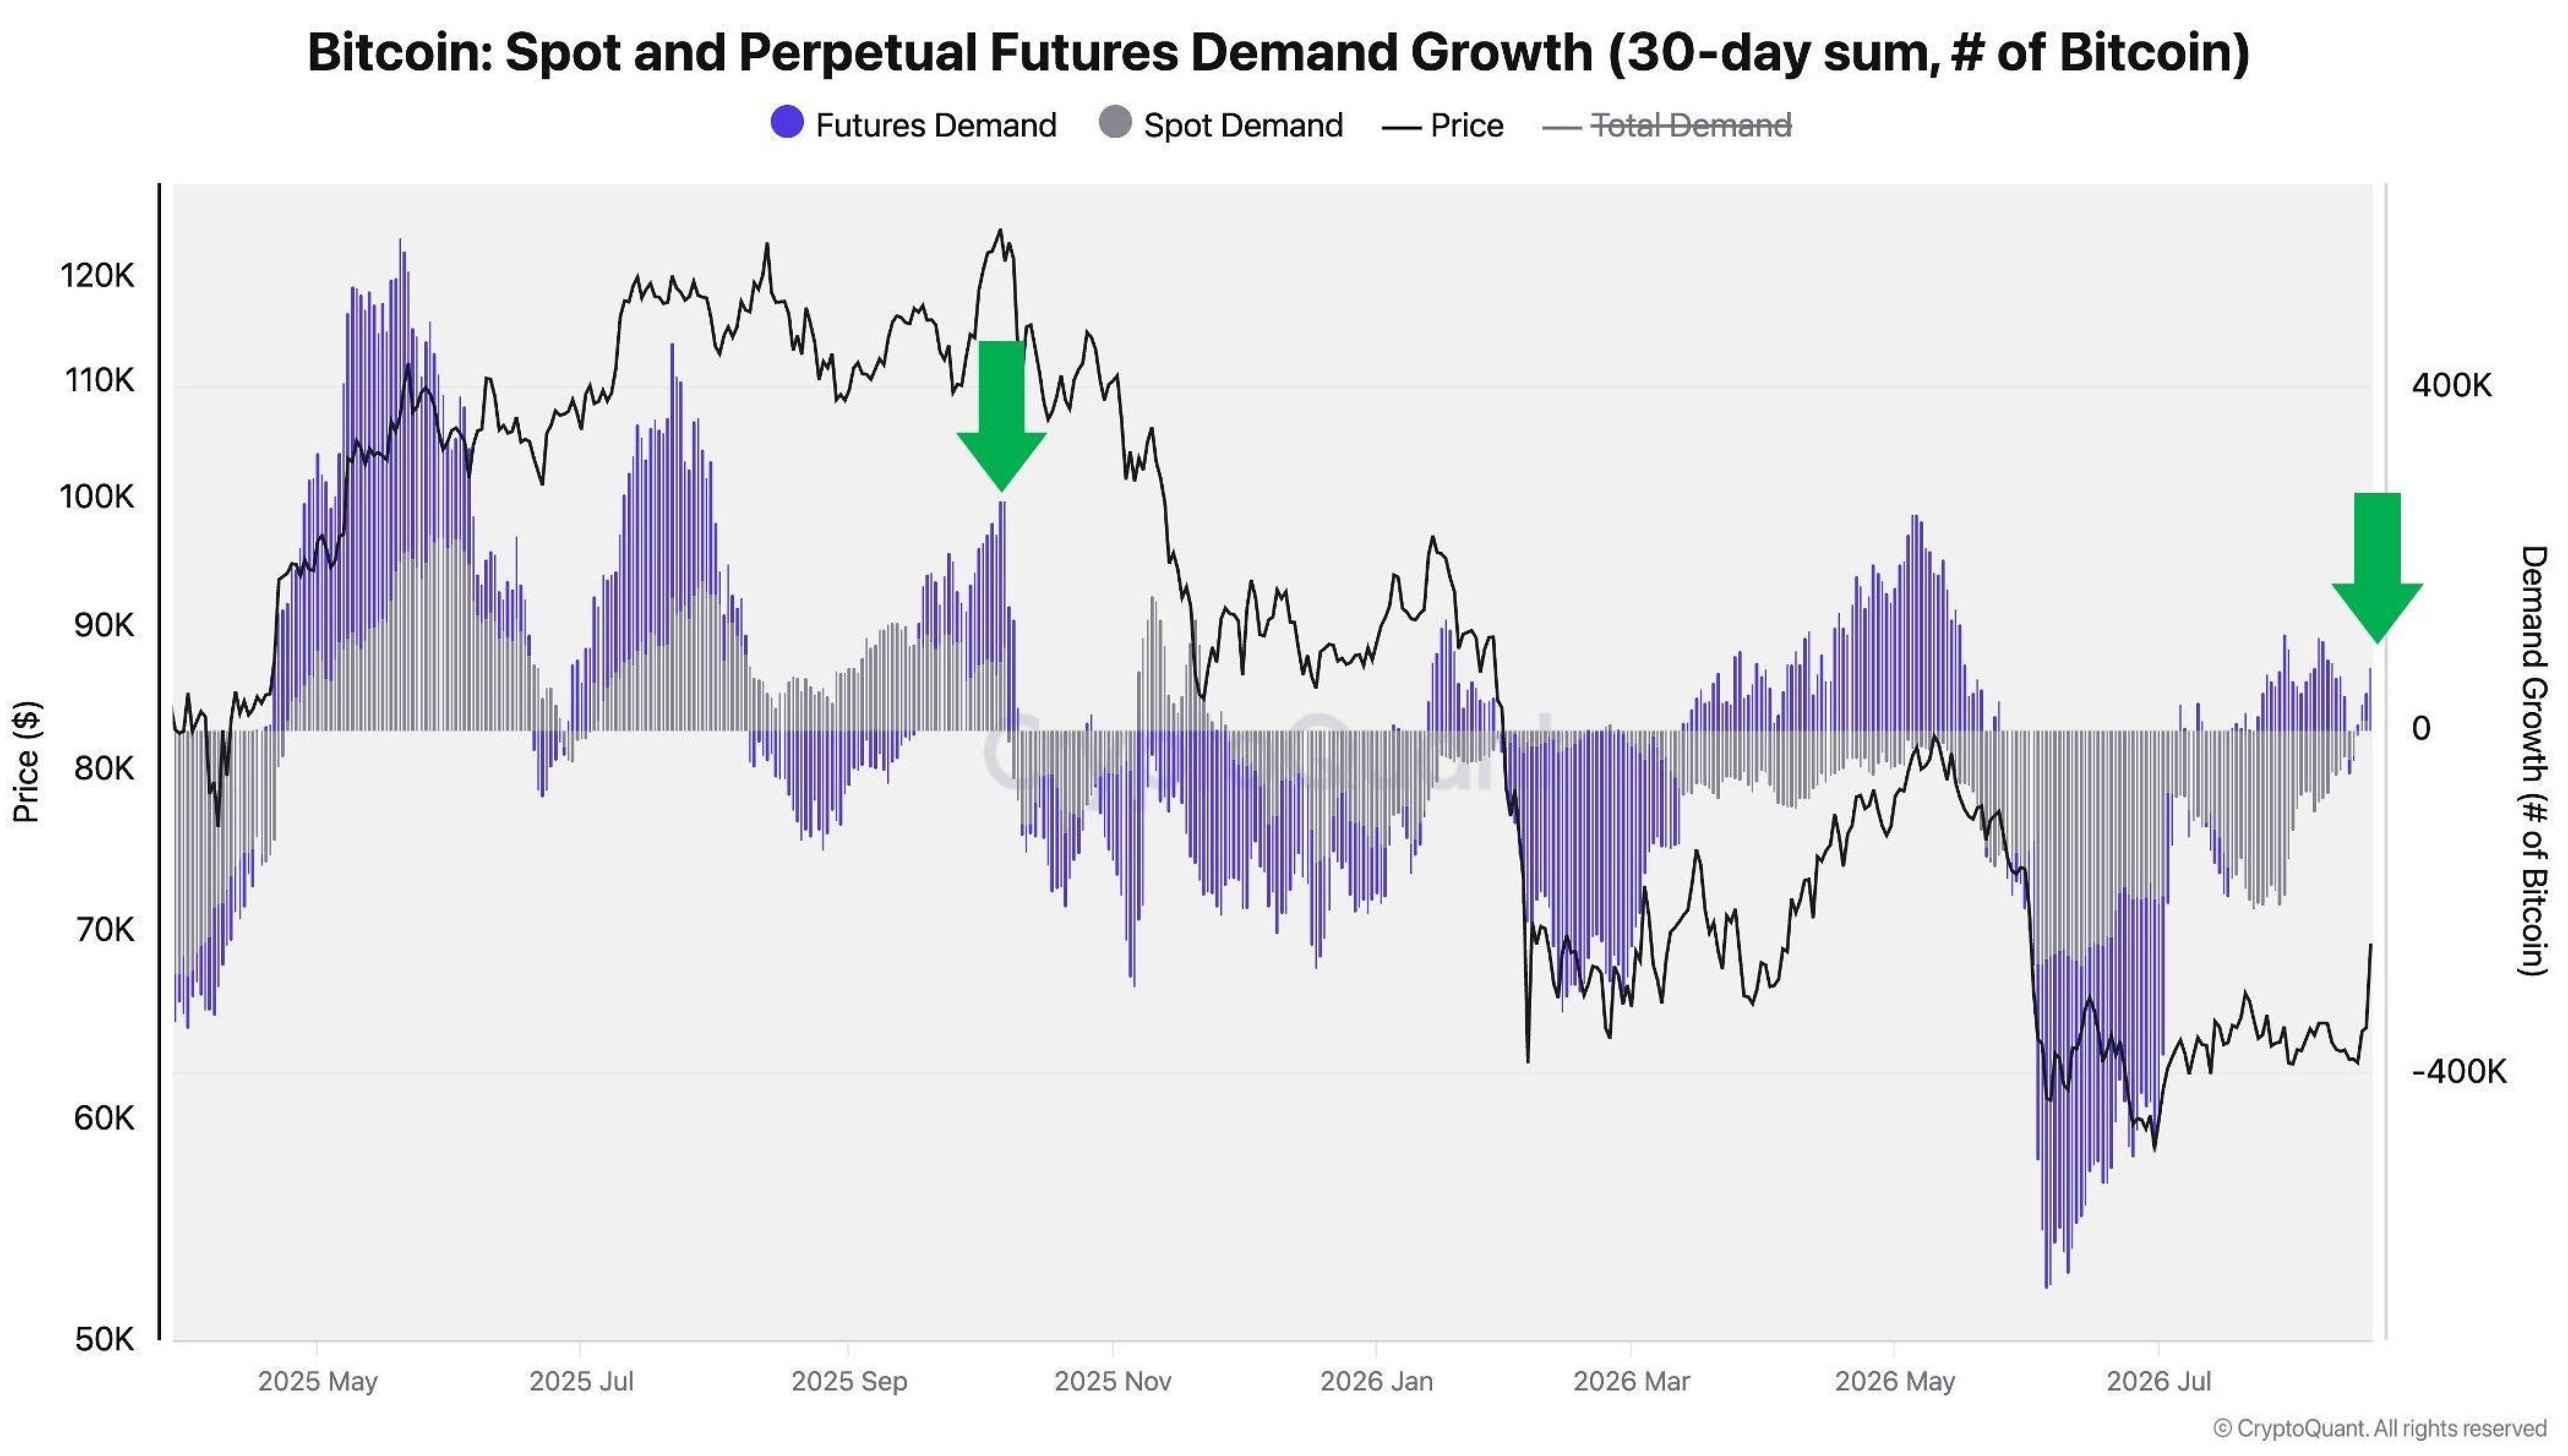
→ The scale is modest, and one positive week straight after a squeeze is what you’d expect either way. Hold it for another month and the case that this bear market is over gets harder to argue against.
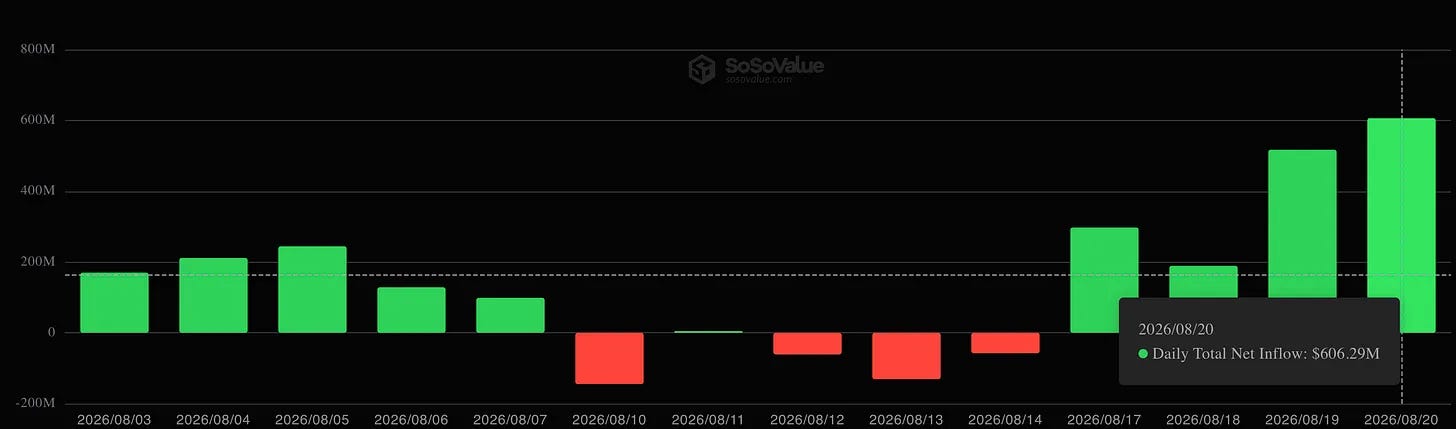
ETF flows are the second leg, and they aren’t mechanical. US spot Bitcoin ETFs took $517 million on Wednesday and $606 million on Thursday, the largest days since May 4, and about $1.6 billion since Monday. That’s the strongest week since mid-January, and it puts August net inflows at $2.07 billion.
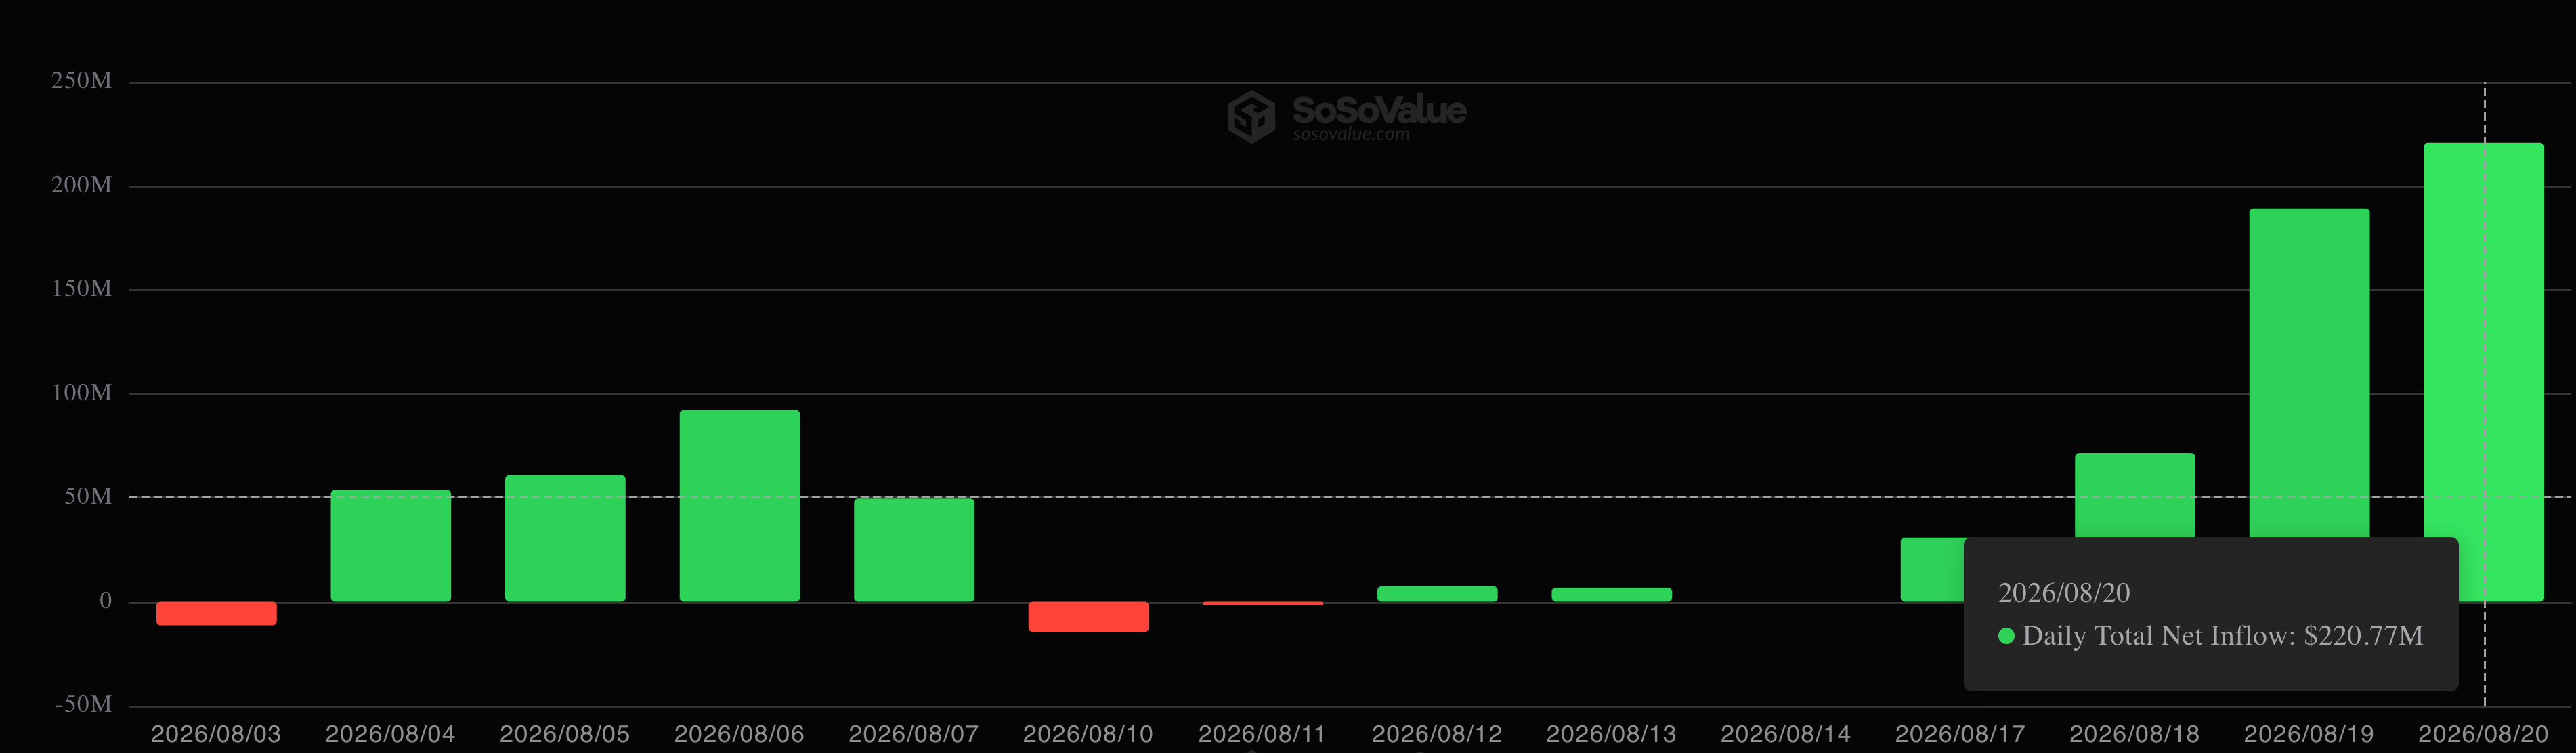
Spot Ether ETFs took $189 million Wednesday and $220 million, roughly $512 million for the week, with ETH up 28% to about $2,390.
Third leg: whale wallets added roughly 43,000 BTC over the past 60 days, accumulating through the stretch where sentiment was at its worst.
So far so constructive. Bitcoin is up roughly 30% off the lows, and two indicators still refuse to confirm that US demand is what’s driving it. This is the part that keeps me on the ground.
The first is the Coinbase Premium Index. Quick for your understanding: it measures the gap between Bitcoin’s price on Coinbase in dollars and on Binance in USDT. Positive means American buyers are paying up for coins. Negative means they aren’t.
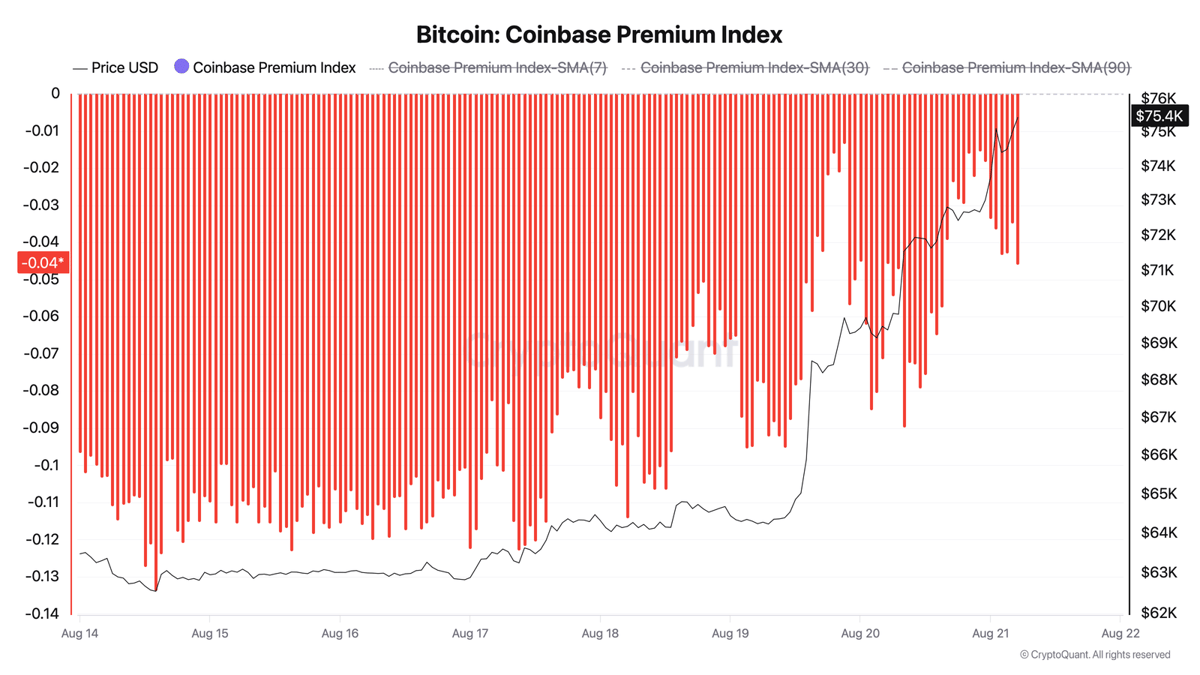
→ The index stayed negative through the entire rally and never crossed zero once. The discount did narrow, from -0.11 to -0.046, so US spot demand strengthened. It just never took the lead. Until that reading holds above zero, the move doesn’t have American spot buying behind it, whatever the ETF numbers say.
The second is open interest, the total value of futures positions sitting open across exchanges. In dollars it rose 11.7% to $25 billion, which looks like fresh leverage until you notice most of that is Bitcoin simply being worth more. Priced in BTC, open interest fell from 366,000 to 334,000 coins, down 8.7%.
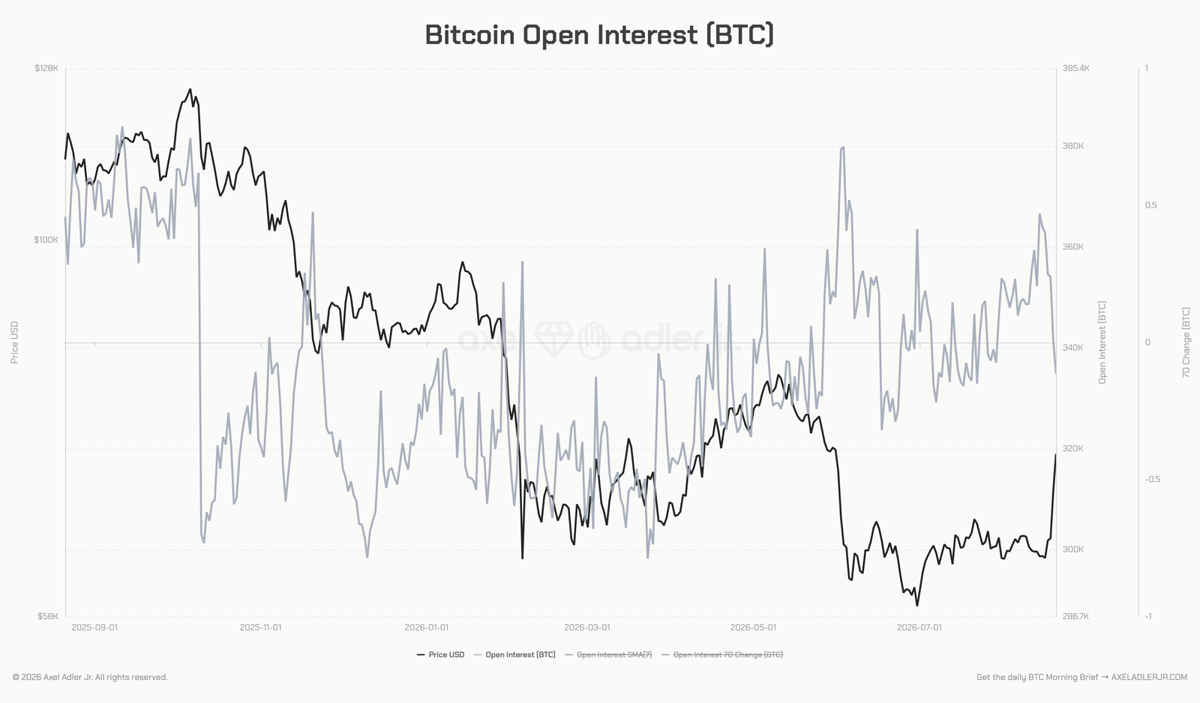
→ Positions got closed during this rally, not opened. That cuts both ways. Less accumulated leverage means a smaller risk of a liquidation cascade on the way back down, which is the healthier structure but it also means less fuel for the next leg up.
So the honest scorecard: the squeeze was mechanical, ETF flows and whale accumulation are real, and the US spot demand is not here yet. Better structure than April, weaker confirmation than a bottom needs. Sharp rallies out of heavy selling have historically reversed about as fast as they were built, so the levels do the deciding from here. More of this in the alpha sections.
And two readings that matter more than price. The Coinbase premium crossing zero and holding there. Open interest in BTC terms starting to rebuild rather than shrink. Get both and this stops being a squeeze.

That covers what the market is doing. Here’s the one setup I’m working, and the short version is that I’m not buying Bitcoin here.
It’s up roughly 25% in a week and the 4h RSI is at 94.5. Quick for your understanding: RSI measures how far and how fast price has moved on a scale of 0 to 100, and anything above 70 gets called overbought. 94.5 is not a normal reading. So I’ve left a resting buy order lower down and I’m letting the market come to me.
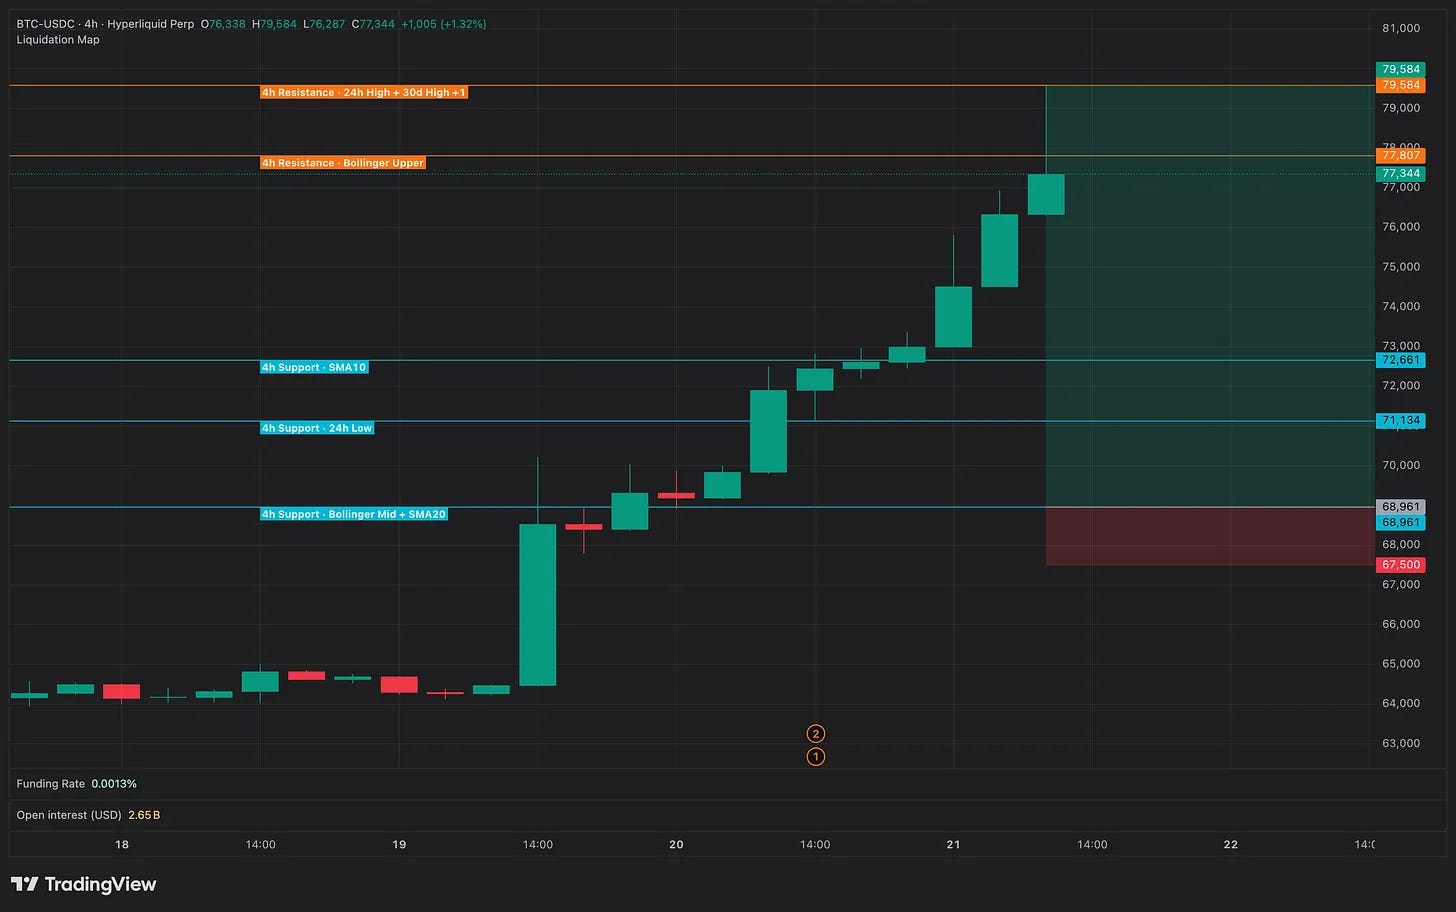
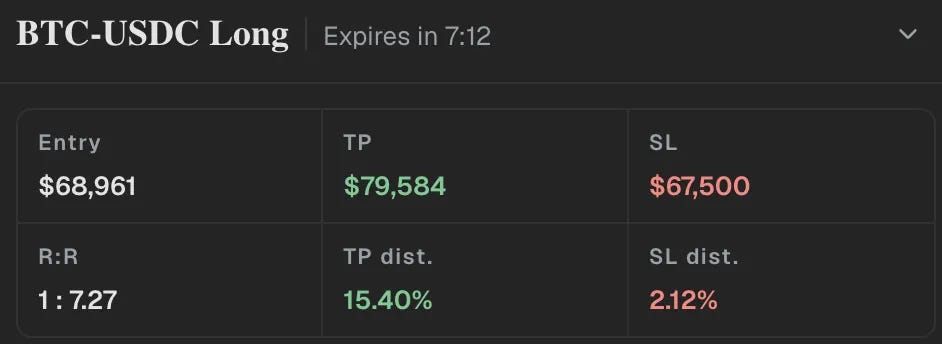
Entry $68,961
Stop $67,500
Target $79,584
Risk to reward, roughly 7 to 1
→ The entry sits in the golden pocket. Quick for your understanding: after a big rally, traders measure how much of it price hands back, and the slice between the 0.618 and 0.65 retracement is where pullbacks in strong trends tend to stop. On this move that’s $68,560 to $69,097. Two other things sit in the same band. The 20-period moving average meets the middle of the Bollinger band there on the 4h chart, and a cluster of leveraged long positions sits between $68,597 and $69,988. Three reasons to expect buyers at one price.
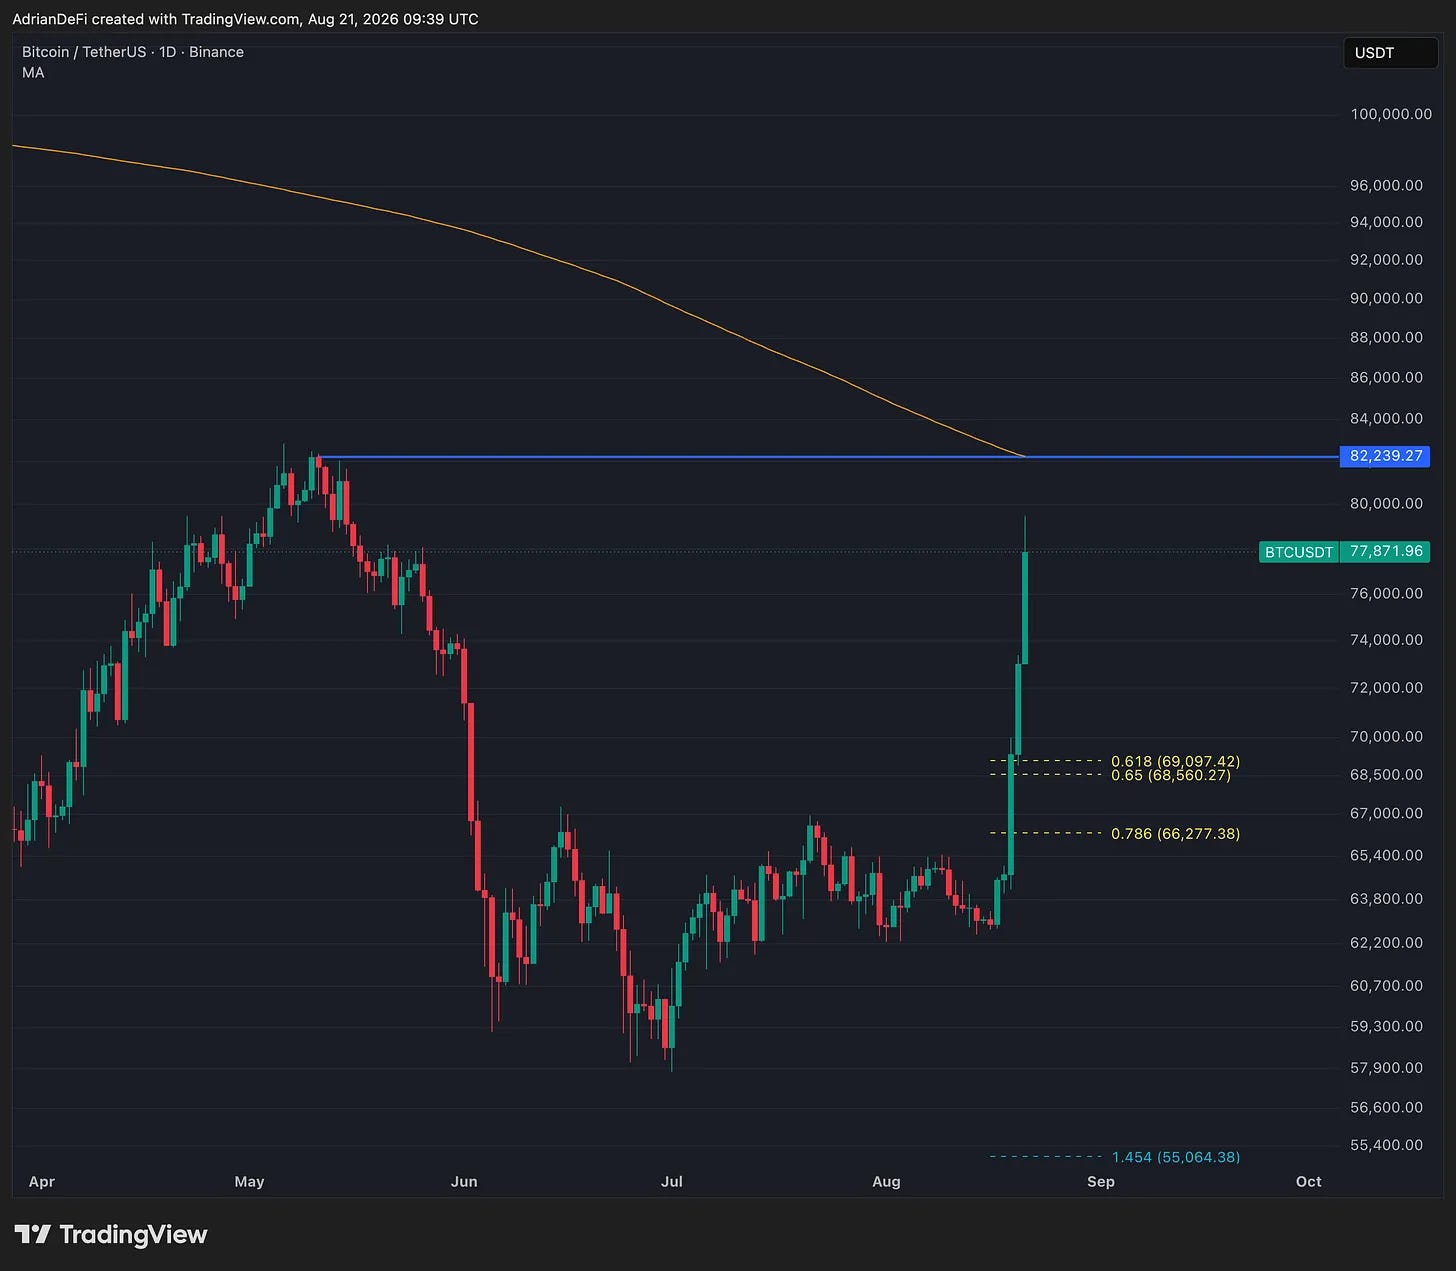
Overhead there are two levels. $79,584 is this week’s high and my target, with a cluster of short positions just beneath it that has to buy back if we get there. Above it sits $82,239, the May high, and the 200-day moving average is falling onto that exact price over the coming weeks. Two resistances on one number is usually where a move ends, so I take profit at the first and assume nothing about the second.
The risk: if $68,961 goes, that long cluster underneath gets force-sold, and forced selling feeds on itself. Not a slow drift lower, a fast flush straight through the level, so we need to manage risk.
This setup also works in confluence with the short-term holder cost basis which sits at $67.6k which has very well worked before as a zone for a retest and then the real start of a bull market.
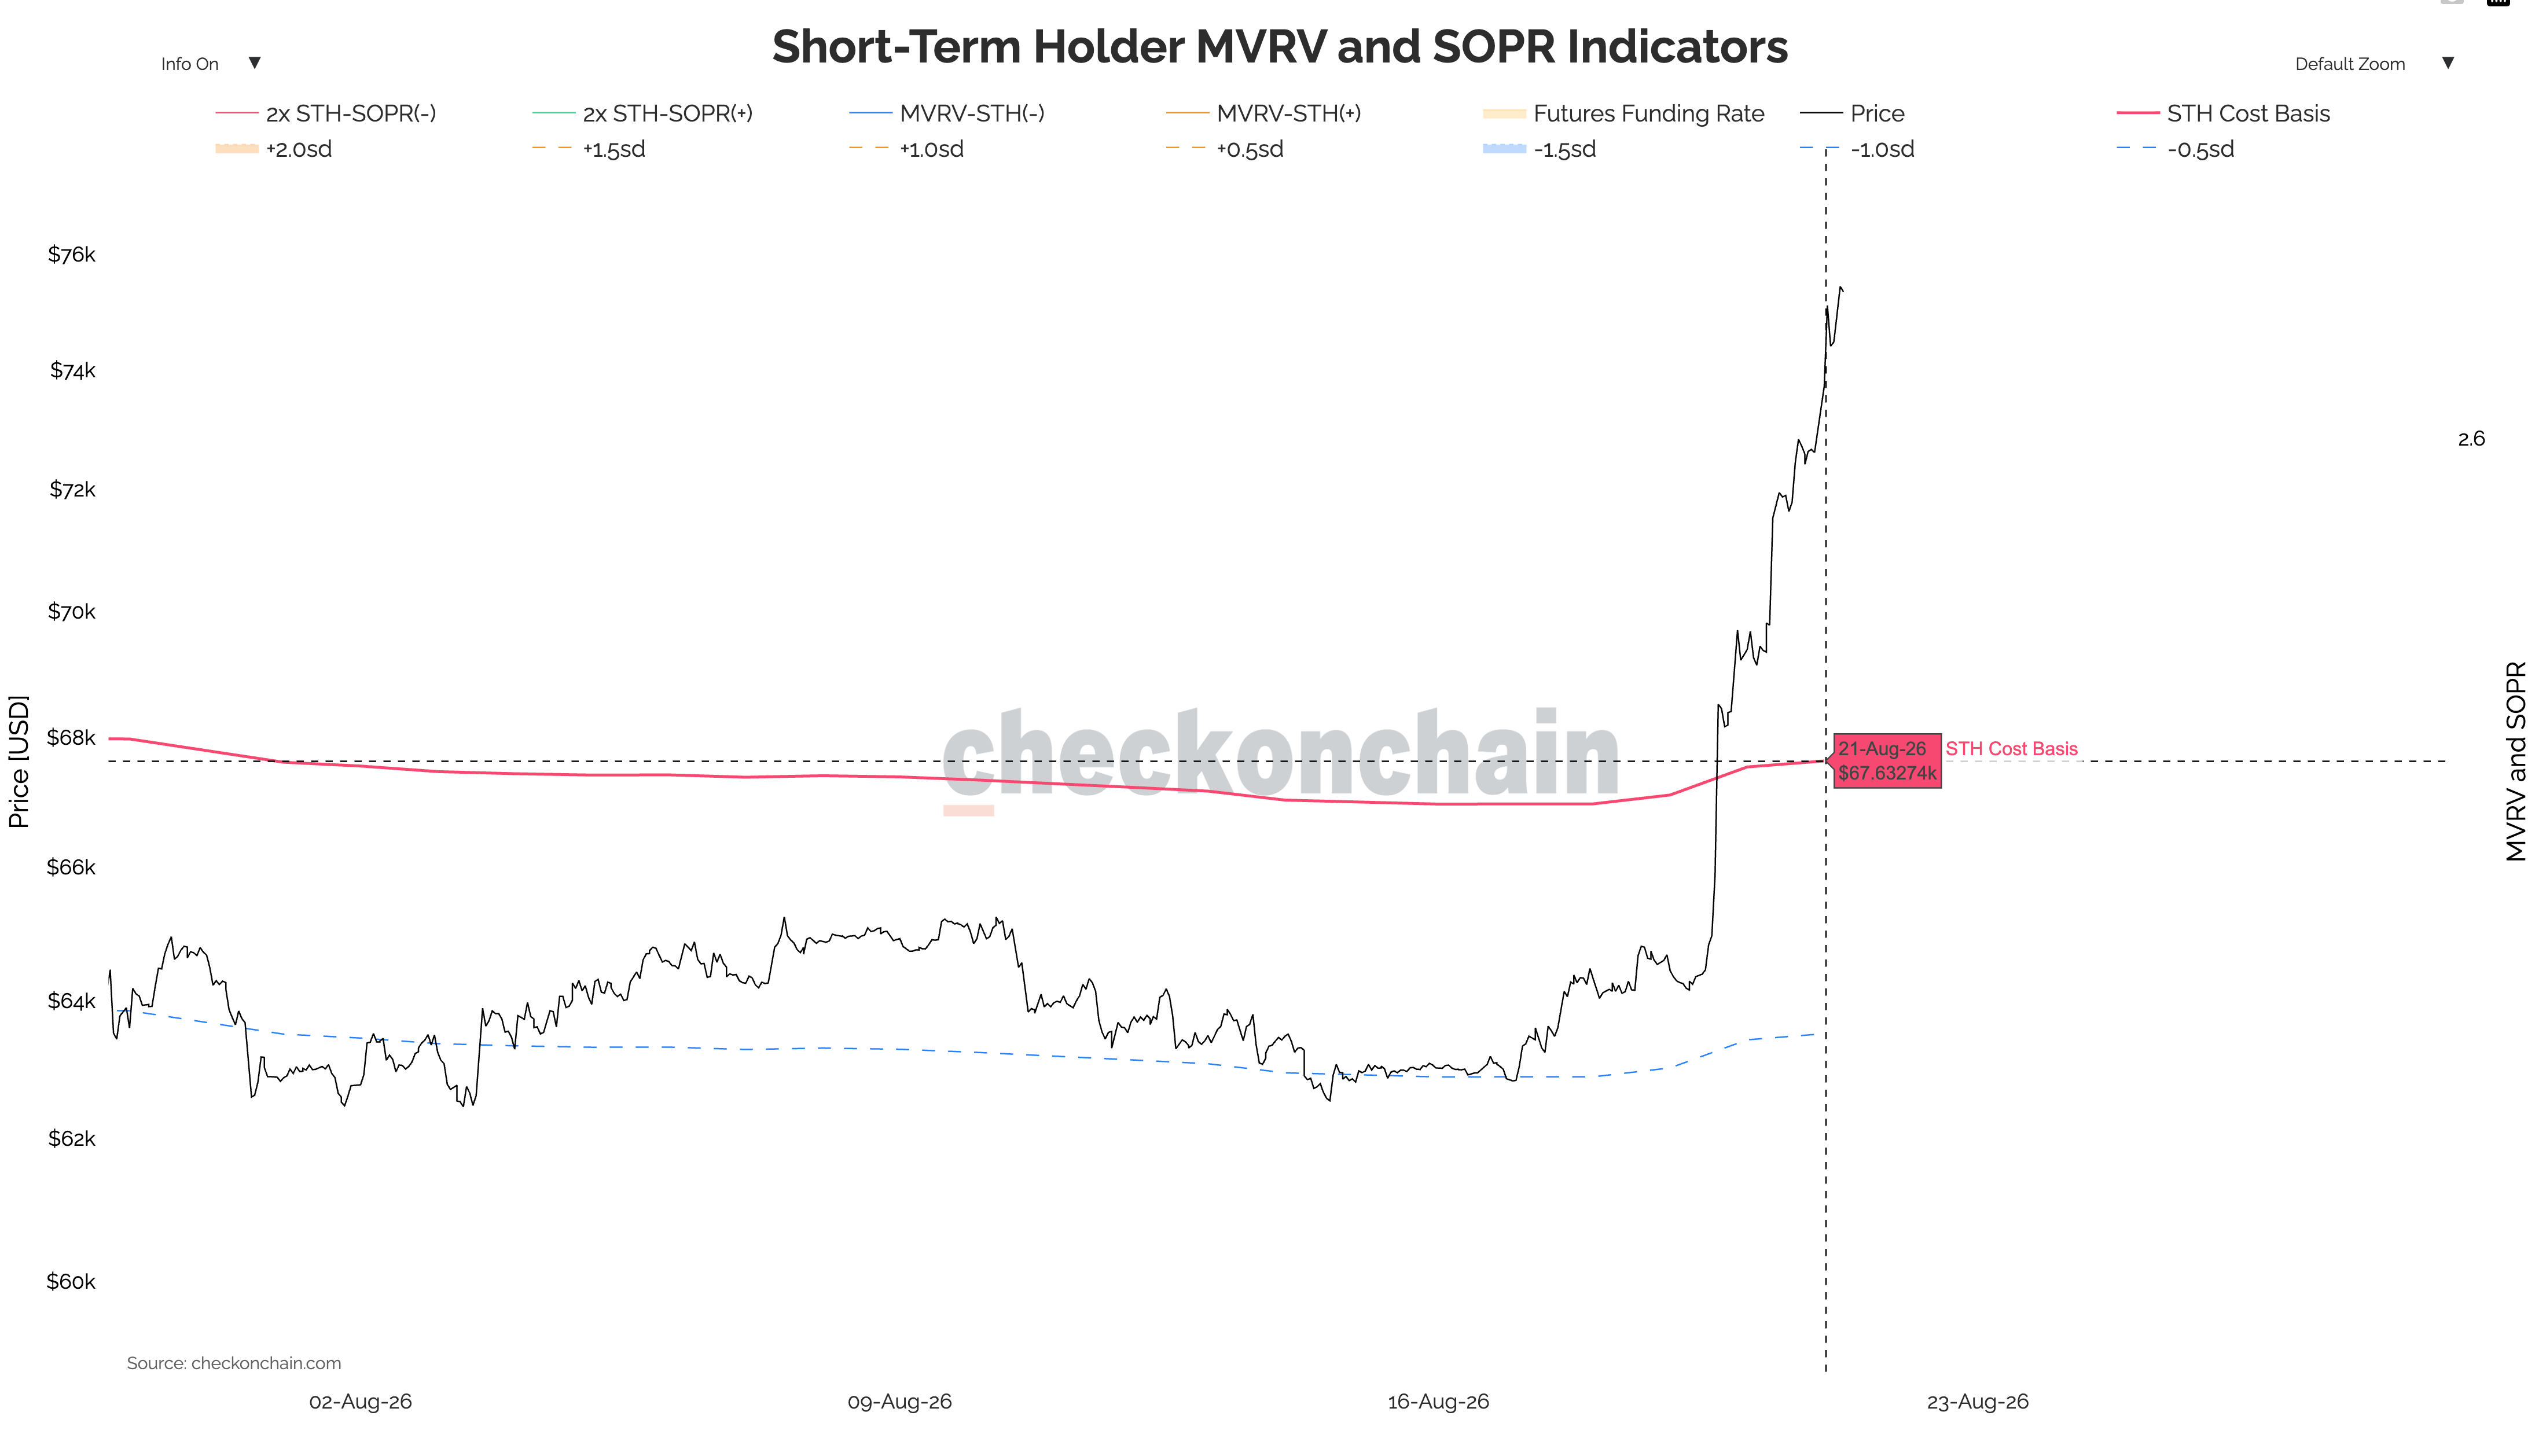
The order sits 11% below spot and does nothing unless Bitcoin comes down to it. I’d rather miss it than chase for now.
If you want a straight to the point newsletter full of calls, new projects, airdrop farms, memecoin and DeFi moonshots, then Hix0n’s Confidential is the place for you. I can really recommend his take (if you’re comfortable with high risk).
For education and discussion only, not financial advice.
That’s it for today’s episode, thank you for being here!
Till next time, stay safe!
No posts
Comments
Nothing yet. Say the first thing.
Sign in to join the conversation.