
Melbourne’s bus routes are infamously indirect. Winding down side-streets, taking you away from where you want to go, then an hour too late, you arrive at your destination. You wonder: would it have been quicker to just walk? Yet not all bus routes in Melbourne are equally windy, some are actually pretty straight, but then there is the 432. And that’s not even the worst.
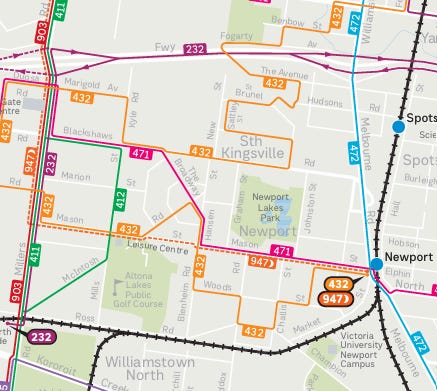
So, I wondered, what if there was a way to measure how windy and indirect bus routes in Melbourne are? What if we could make some kind of index of routes in order? Turns out we can, and I’ve done just that.
The windiness index (WI) which I have created is a score that lies between 0 and 1. The closer to 0, the windier, the closer to 1, the more direct. A good way to think about it is, what proportion of your on-board travel moves you closer to your destination (see below for methodology). So, without further ado, what is the windiest route in all of Melbourne.
The most indirect route: 490 with a windiness index of 0.307
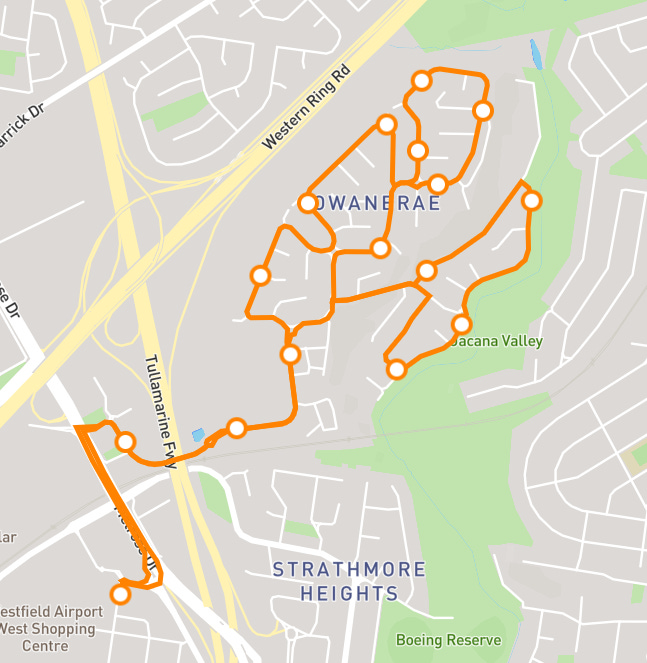
Looking at this map, I’m sure you are wondering: “how is THAT a bus route?” Well, the 490 is more of a semi-flexiride style route than a fixed route. Users need to book 20 minutes in advance via phone to make sure the bus shows up at their stop. So, it’s possible that their trip to the shopping centre may not be that windy. So, I think it might be fair to say that this is not exactly a fair contender for most windy route. The second windiest route, however, is a bit more typical.
The (second) most indirect route: 699 with a windiness index of 0.372
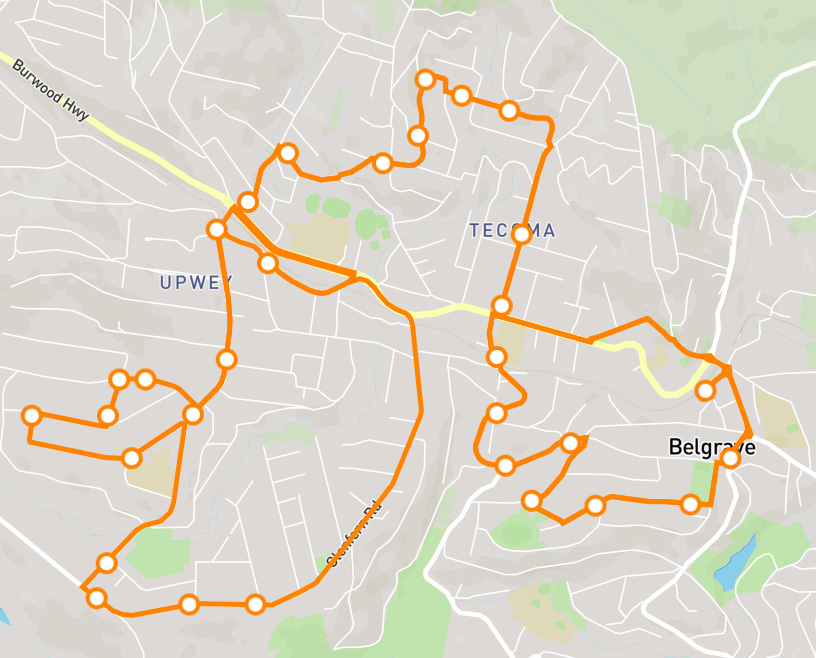
This is the 699, second windiest bus route in Melbourne. It holds a special place in my heart, as I grew up in a house right in front of a bus stop along this route, but sentiment aside, DAMN, this is a windy route. It intersects 3 consecutive train stations on the same line which I think is kind of impressive.
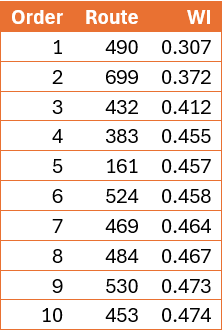
The top ten most indirect routes:
The most direct route: 706 with a windiness index of 1.011
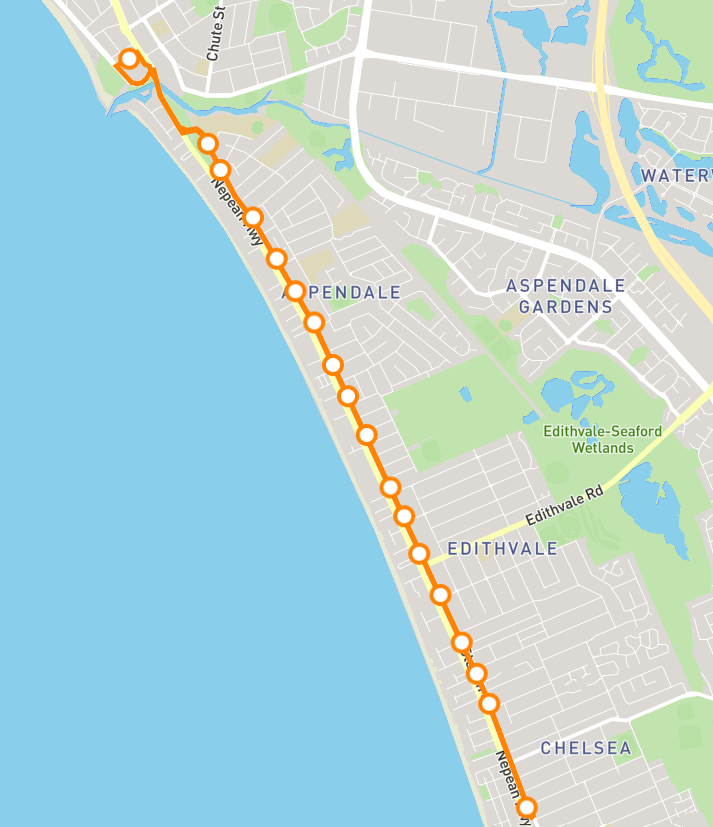
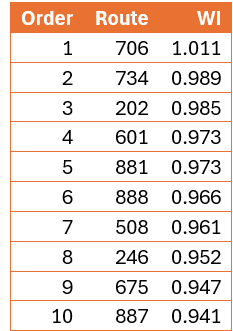
This route is so unbelievably direct that it breaks my method (see below for explanation) with a score of above 1. Like the 490, this is a bit of a black sheep route, with the unusual characteristic that it is only run during the off peak. It is essentially totally duplicative of the Frankston railway line and has a very low ridership. However, it probably has come in useful for local trips during the many (many) Frankston line shutdowns. So, what is the most direct route that runs all day and doesn’t break my method?
The (second) most direct route: 734 with a windiness index of 0.989
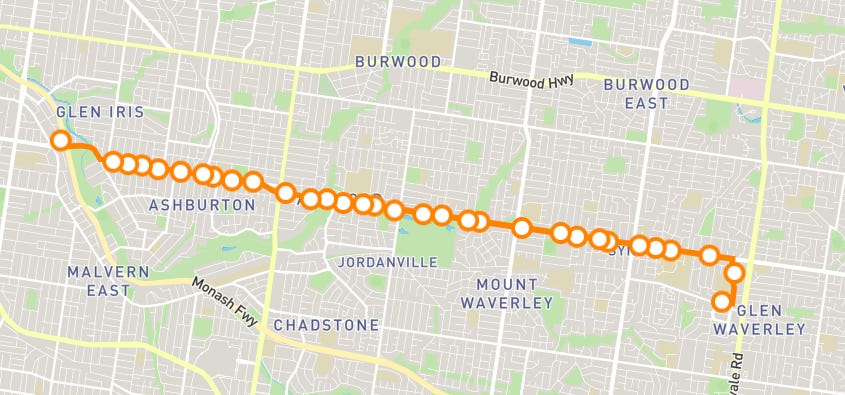
Straight down High Street Road, the 734 could not be a straighter route between Glen Iris, and Glen Waverley, via Ashburton. Not particularly well used either, due to being quite duplicative of the train line, but it does fill a few coverage gaps.
The top ten most direct routes:
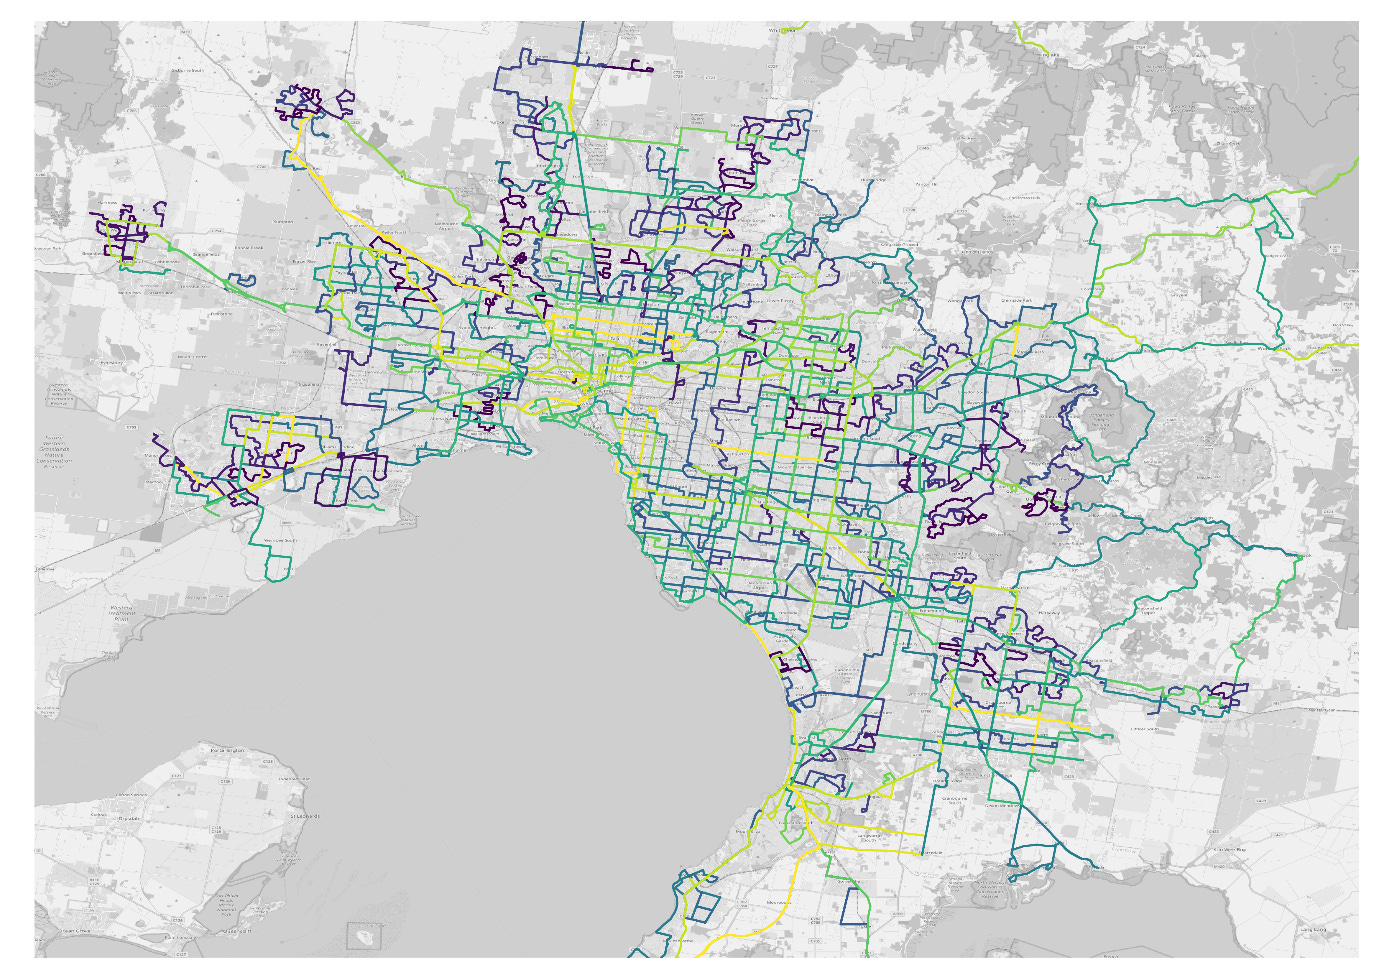
And now for a map of all the routes across Melbourne
My initial thought when designing an index for windiness was to compare the total length of a route with the distance between its endpoints. Mathematically, the formula would be:
\(WI = L/T\)
where L = length via the bus route and D = the direct length.
Here is a map to help explain:
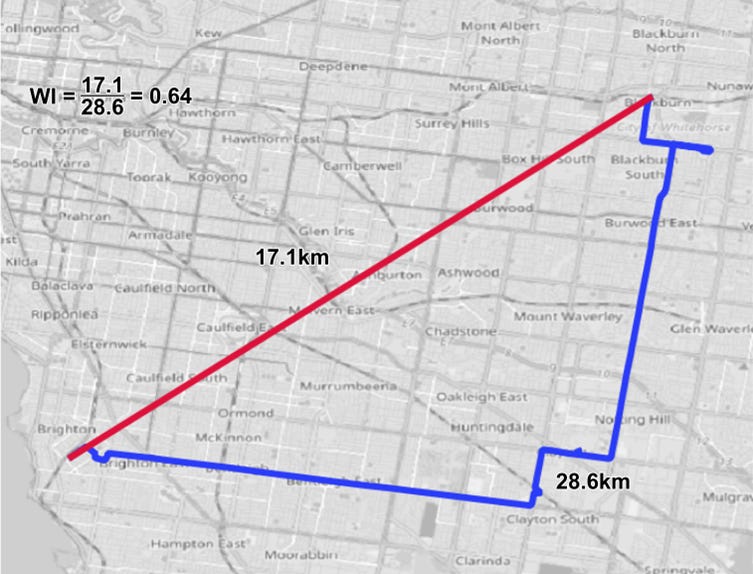
Using the 703, I found a value of 0.64. I’m sure now it’s clear why this method is not exactly – ideal. Most people who use the 703 are not travelling end to end, from Blackburn to Middle Brighton, even though I may have done this myself once. Instead, they will go part way, and for those trips, the 703 is typically a very direct route, say Burwood East to Monash University, and Bentleigh to Clayton. So, I decided that I needed to change my method.
To start, I placed a marker every 200 meters along the bus route, to simulate an approximate bus route spacing. The reason why I didn’t use the actual bus stop locations is because it would be far more computationally demanding, and require too much manual input and data cleaning to replicate across hundreds of Melbourne bus routes
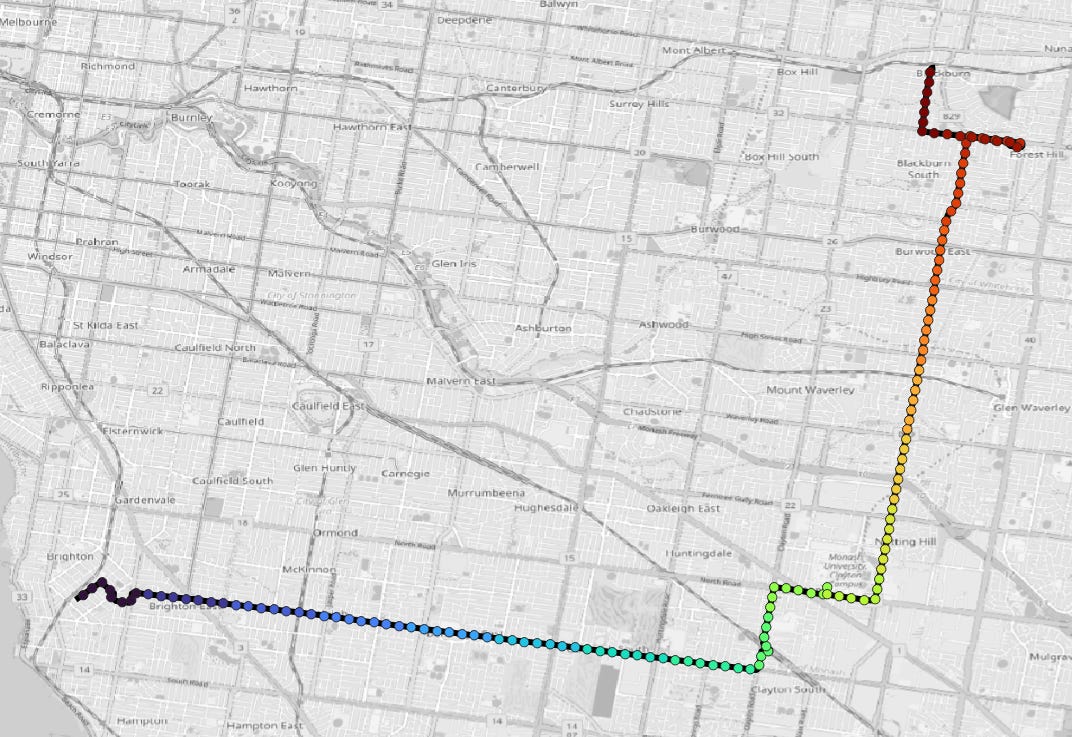
Then, I drew a line between each of these points
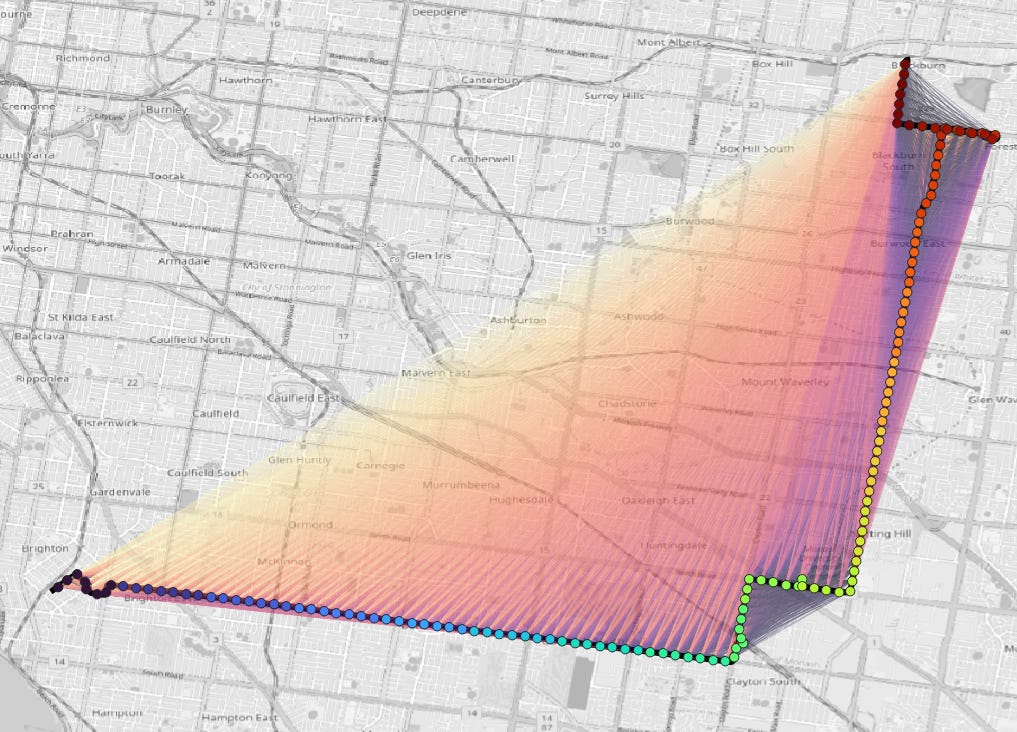
Pretty, I know. I made it so that the longer lines are lighter coloured than the shorter lines. My plan was to apply the logic I used for the endpoint to endpoint distance, for each line and take the mean. But then I realized a problem was that some of these lines were a bit too short to be important and including them might produce odd results. Even worse would be including the longer lines (think how this might disproportionately impact the orbitals).
So, to address this I decided to have an upper bound for theoretical trips I was going to look at and chose 15km, as a reasonable upper limit. For the lower limit I picked 800 meters, because that is roughly walking distance. So, removing those too-long and too-short trips, the map looks like this:
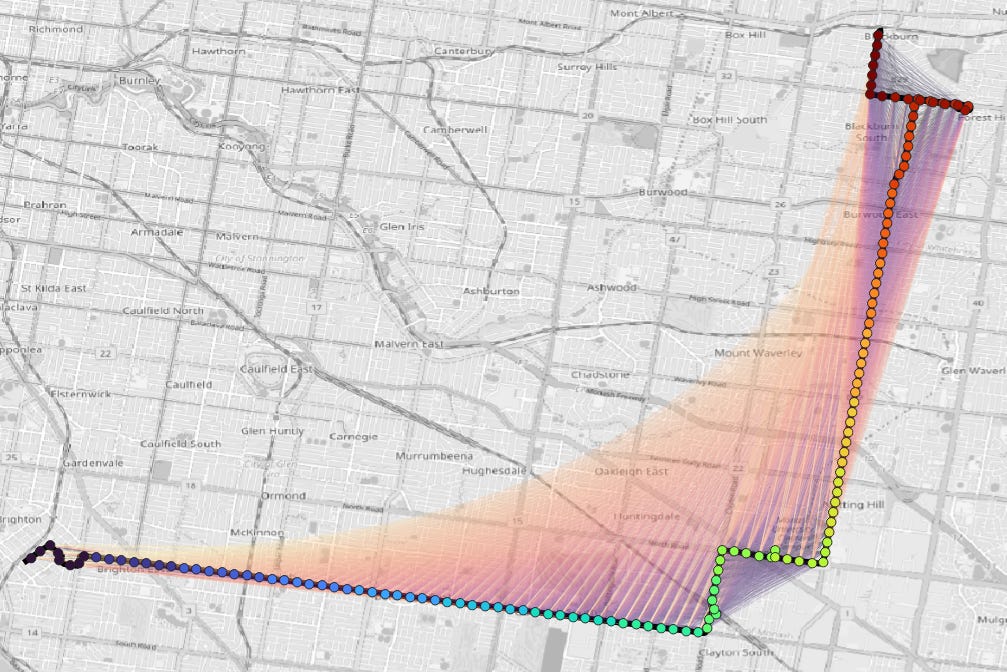
Taking the average of the direct distance divided by route distances of these lines, I got a windiness index of 0.84, which I think pretty fairly describes the route 703.
In a mathematical sense, I think this new method can be described as:
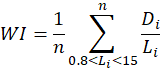
To the more mathsy people that I, is this right?
I proceeded to scale up this method using r-code to create windiness indexes for each Melbourne bus route, to generate the index used throughout this piece. The arbitrary values used are the stop spacing of 200m, and the lower and upper bounds of 800m and 15km respectively.
To take this a bit further, let’s ask which LGA has the most direct bus routes on average, and which has the least direct bus routes on average.
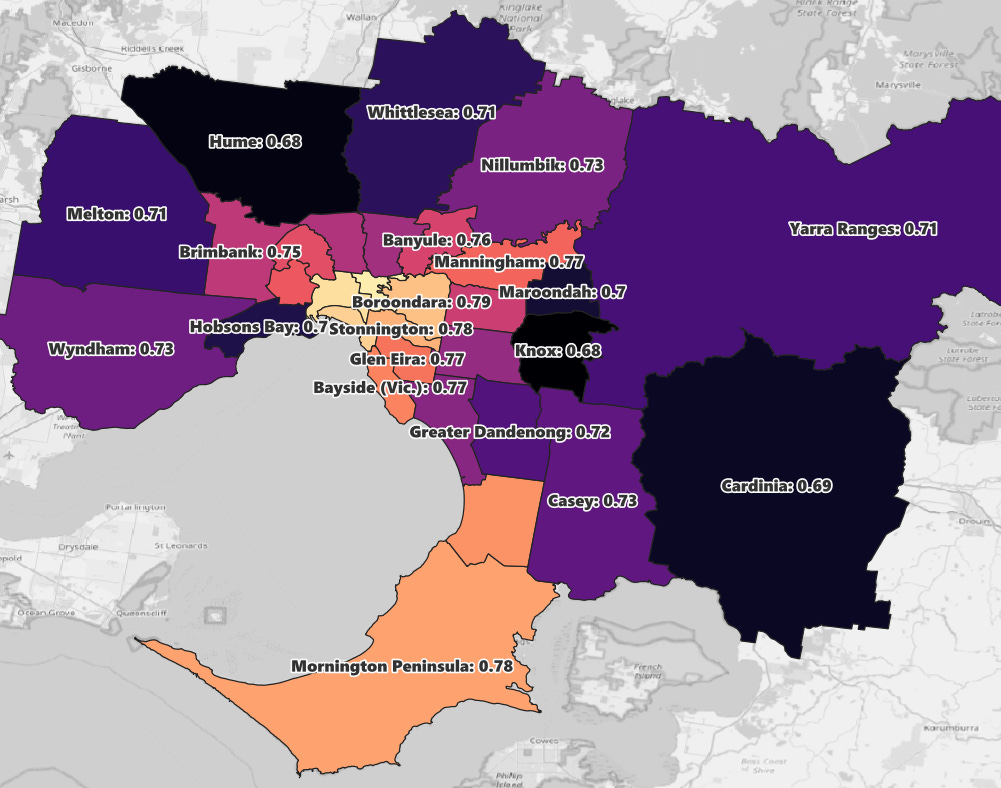
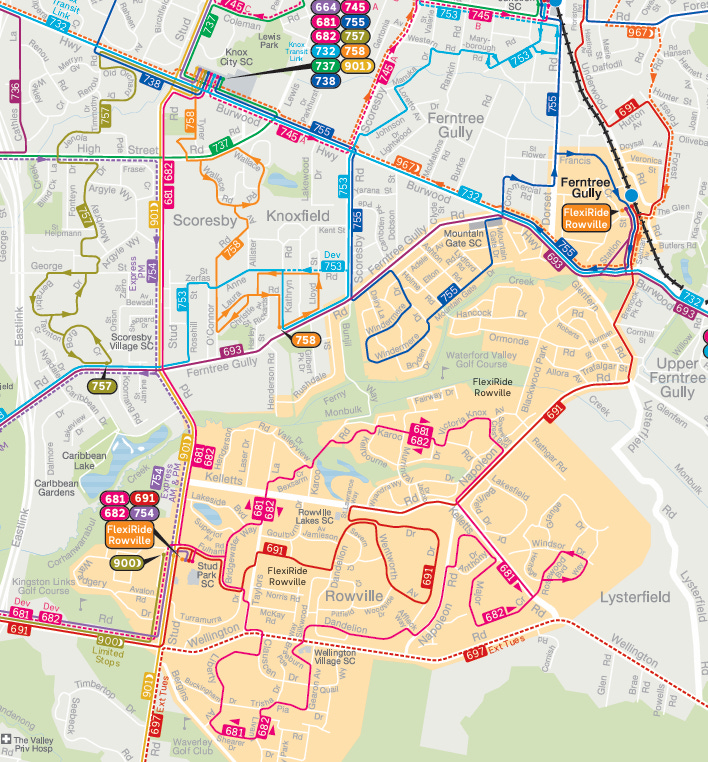
This map shows the average windiness index for each LGA area. Knox is the lowest scoring LGA, which makes sense. Just look at the 758. The highest scoring LFA is the City of Yarra, which contains 202, 246 among other mostly straight routes.
The next question I thought we should ask, is the score linked to distance from the CBD? Here is a scatter plot of the centres of each route distributed by distance from the CBD
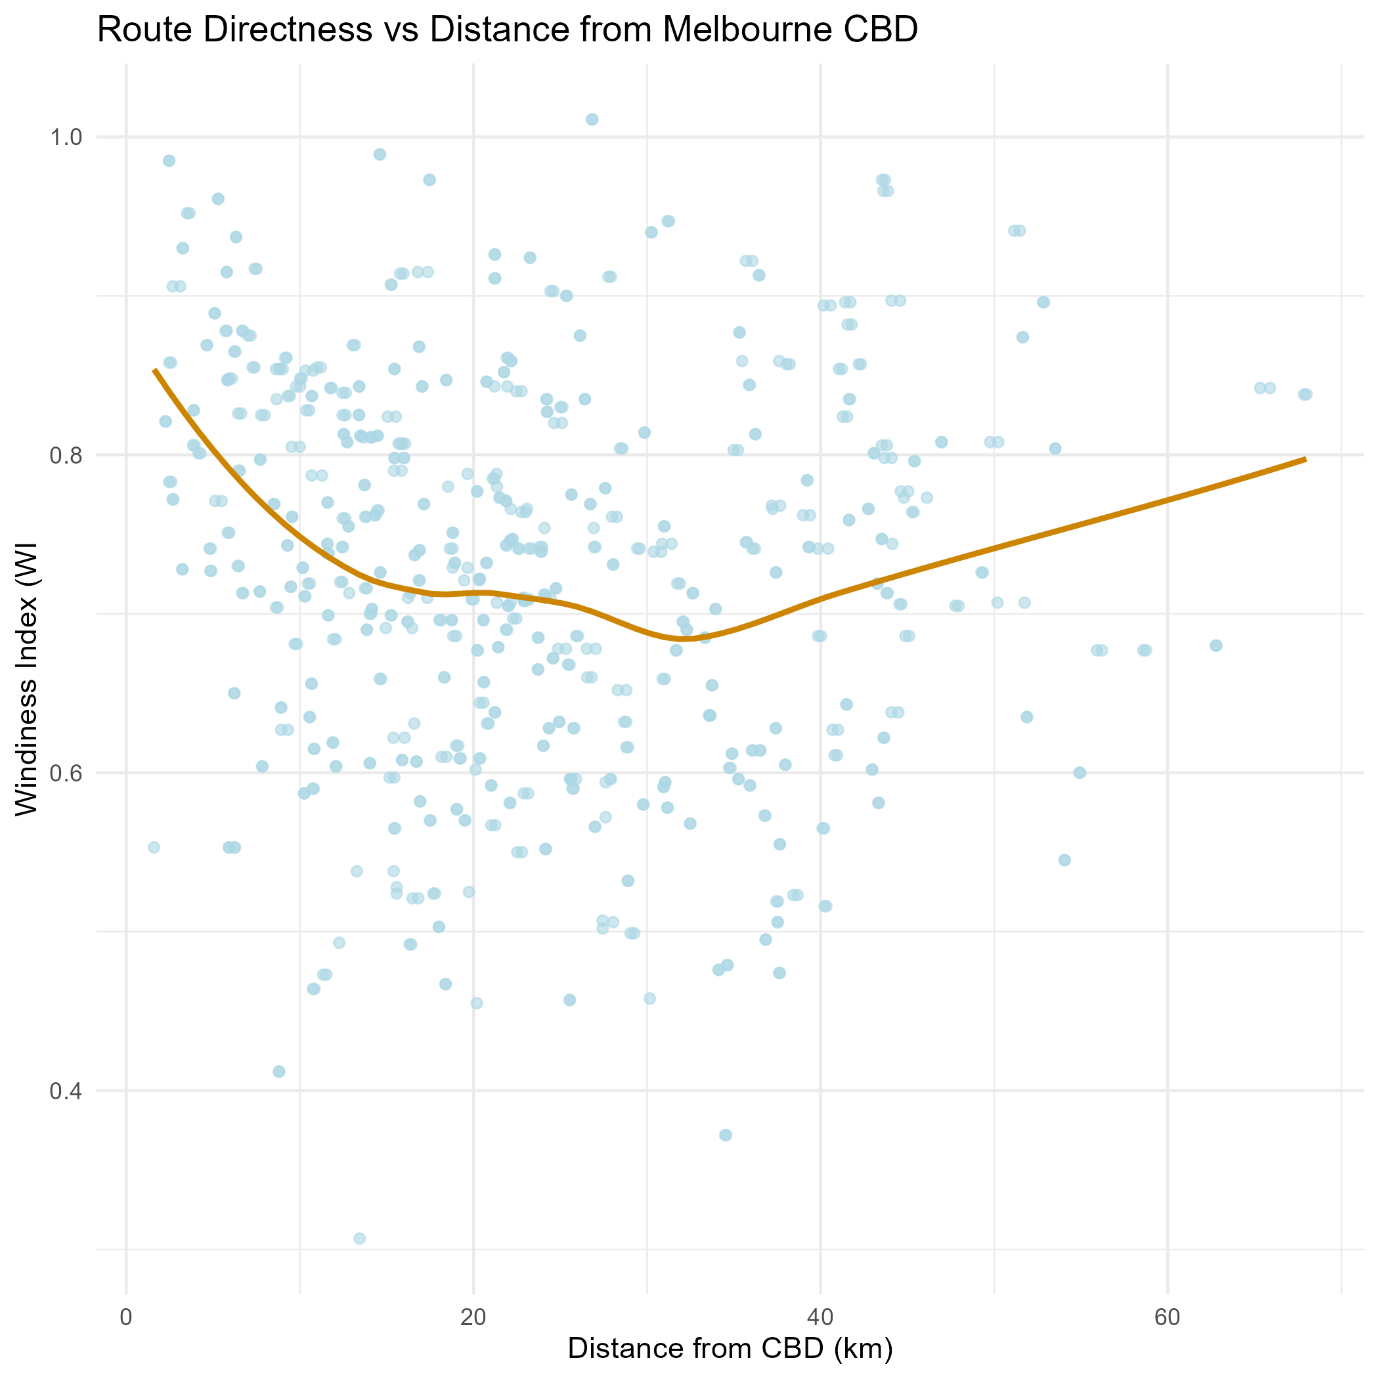
So, it does go down as you get further from the CBD. This is probably due to newer estates having more complicated road patterns, and more likely to bus routes that evolved piecemeal bit by bit as suburbia expanded.
So that finishes my exploration into how windy our bus routes are. We all know routes that are overly windy are inefficient and less useful than simple, straightforward lines which follow main roads. Let’s hope that we get some proper route reform – especially in the outer suburbs, and LGAs like Knox. For a bonus, here is a full table of all routes, with their scores.
No posts
Comments
Nothing yet. Say the first thing.
Sign in to join the conversation.