
In Part Two, I investigated which SA2s had the most internal linguistic diversity. As I skimmed through the data tables, I started to notice areas with many speakers of a language from India, such as Hindi, would often also have many speakers of other languages from India, such as Telugu.
That got me wondering: which languages tend to be the most likely to be clustered together?
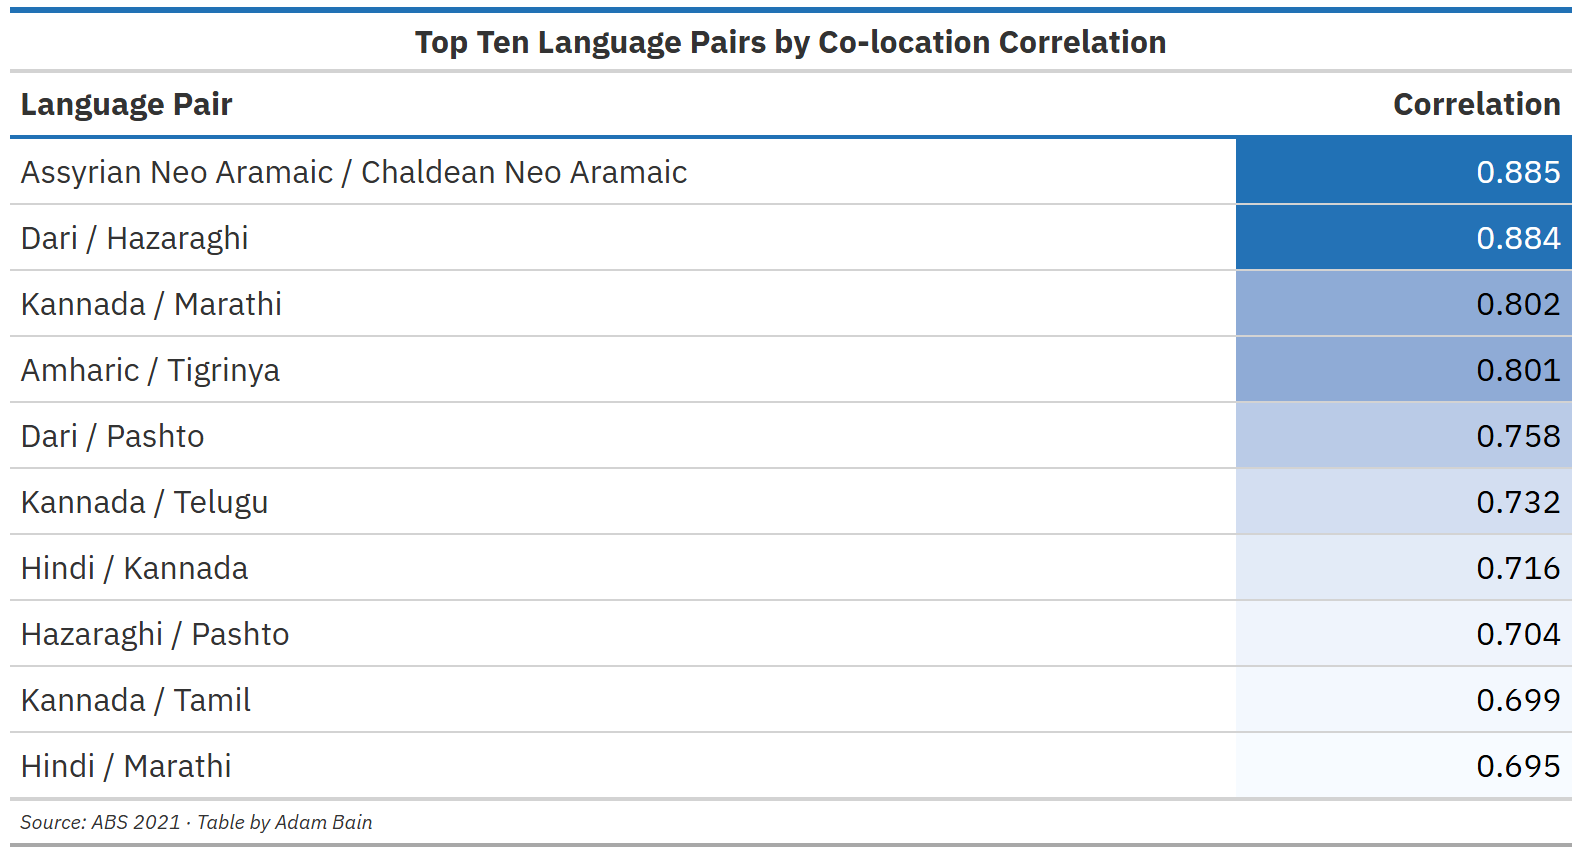
The most likely languages to be paired together are Assyrian Neo Aramaic, and Chaldean Neo Aramaic, spoken mainly by Assyrians in Western Sydney. These languages are essentially entirely intelligible, usually considered dialects - the distinction being more ethnic and religious rather than linguistic.
The same can be said about the distinction between Dari and Hazaraghi, being variants of Persian, particularly from Afghanistan. Not so much for Kannada and Marathi, both from India. Kannada is spoken in the southern state of Karnataka, and Marathi is the principal language of neighbouring Maharashtra, best known for its largest city: Mumbai.
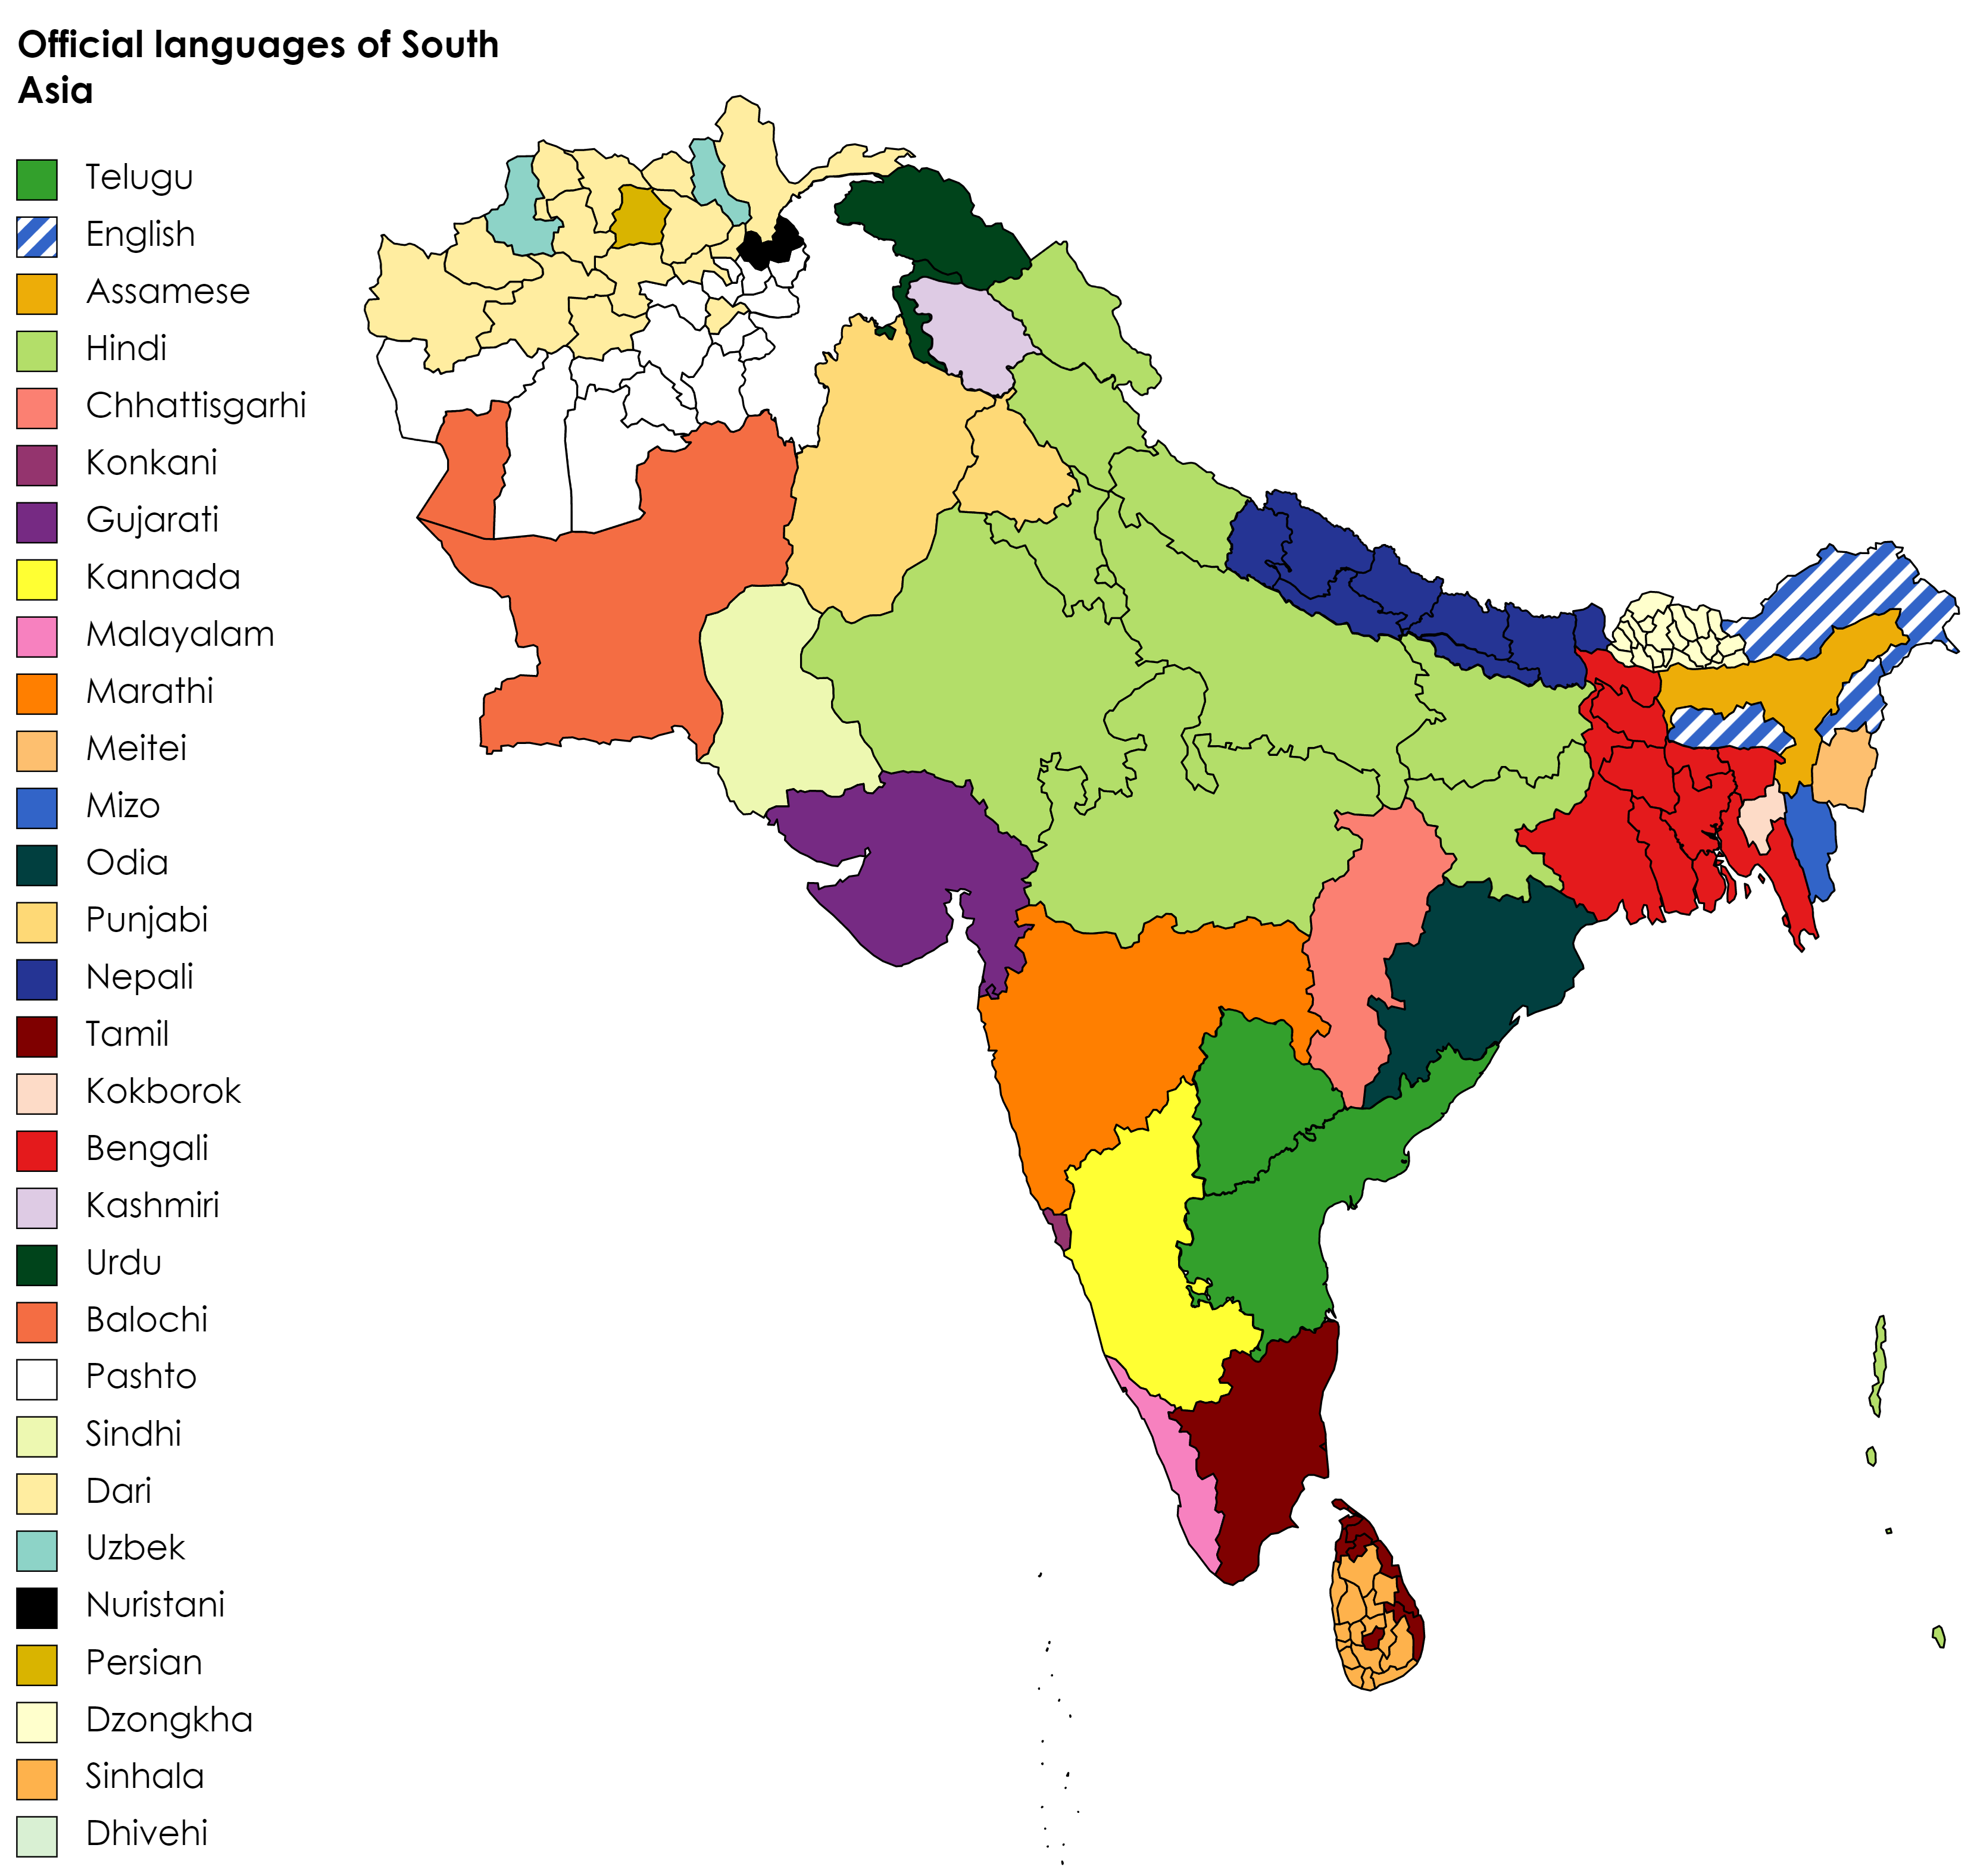
However, even though these languages have proximate origins, they are very different languages coming from different language families. Kannada is a Dravidian language whilst Marathi is an Indo-European Language. Although there is some common vocabulary from centuries of contact, these languages are non-intelligible.
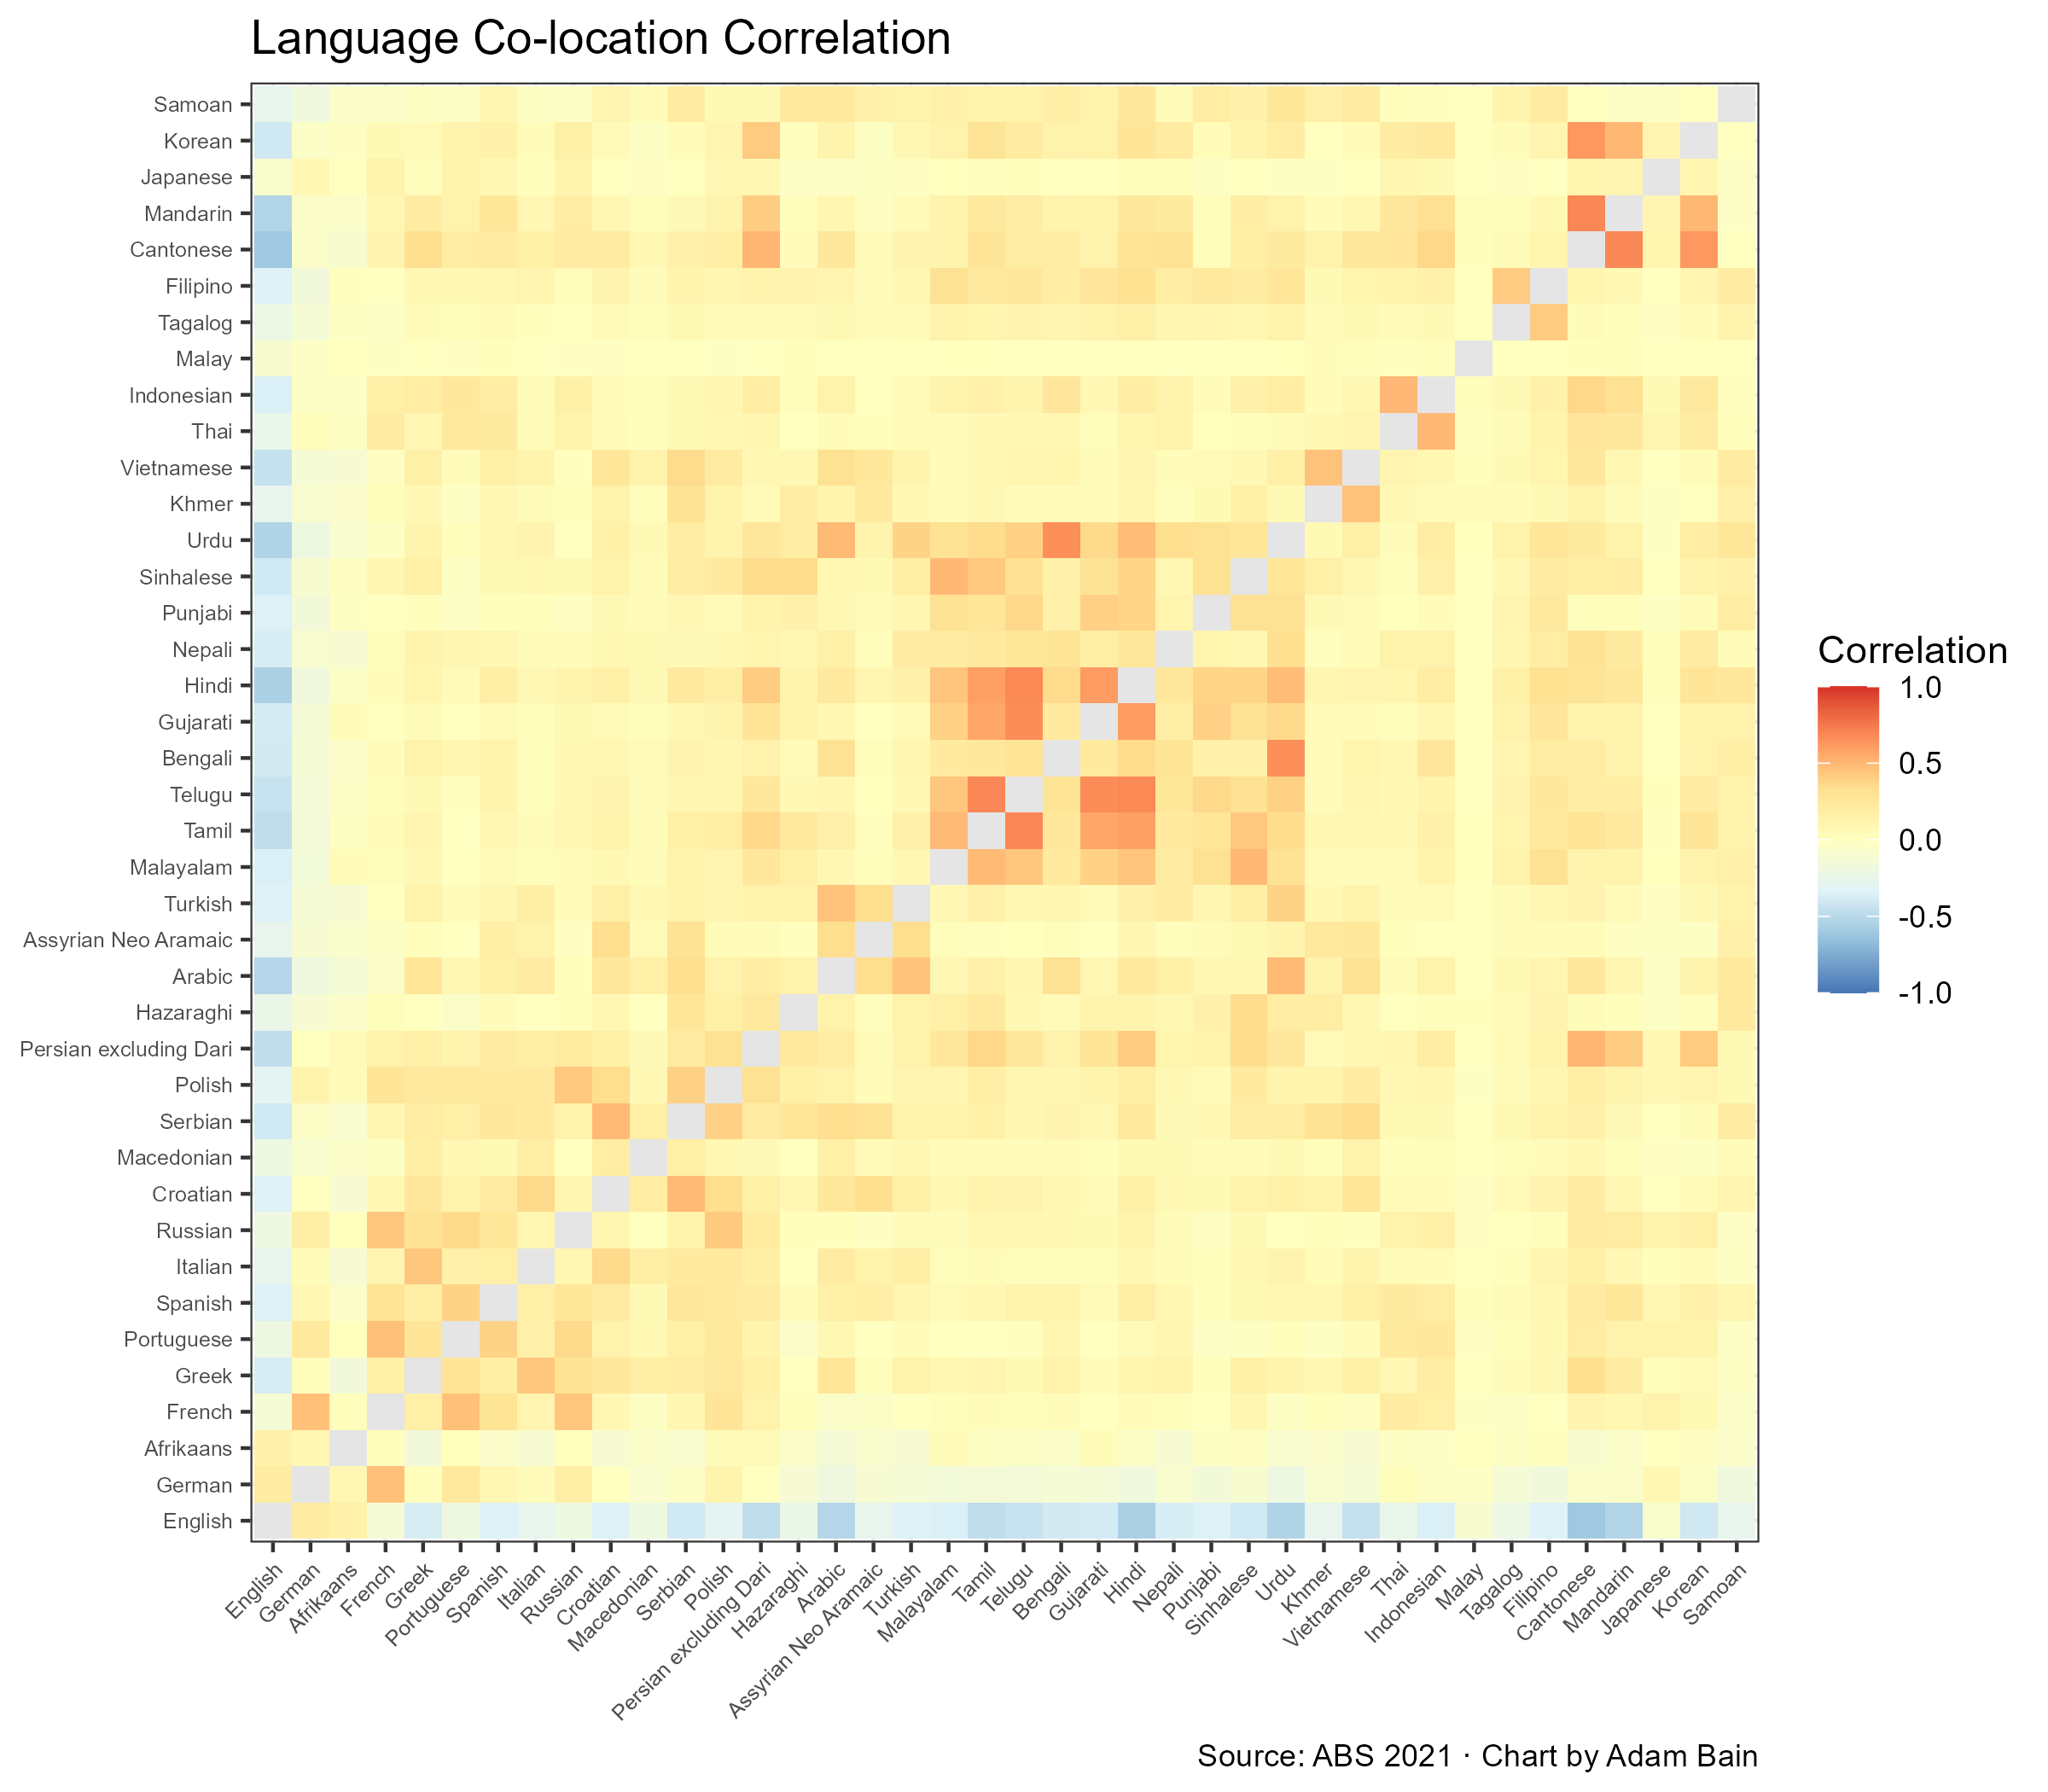
Above is a heatmap chart of the 40 most common languages in Australia and how they correlate. The most striking feature is the cluster in the centre of the chart, representing languages from the Indian subcontinent.
Speakers of these languages tend to live near speakers of other languages from this cluster. However, speakers of Sinhalese, Nepali and Punjabi have much weaker correlations to the other languages of South Asia, suggesting stronger local ethnic identities. Urdu and Bengali despite primarily being from Pakistan and Bangladesh respectively – at other ends of the Indian subcontinent, are also far more correlated with each other than other regional languages. This is possibly because communities of Urdu speakers and Bengali speakers are drawn together by largely sharing an Islamic faith.
Other notable pairings are parings such as Portuguese and Spanish as well as Croatian and Serbian, showing that languages originally from close areas tend to cluster together too in Australia.
The mosaic chart is a lot of information all at once, so I made a dendrogram of language correlation. This chart groups languages into families by colocation and should not be understood as a “family tree”.
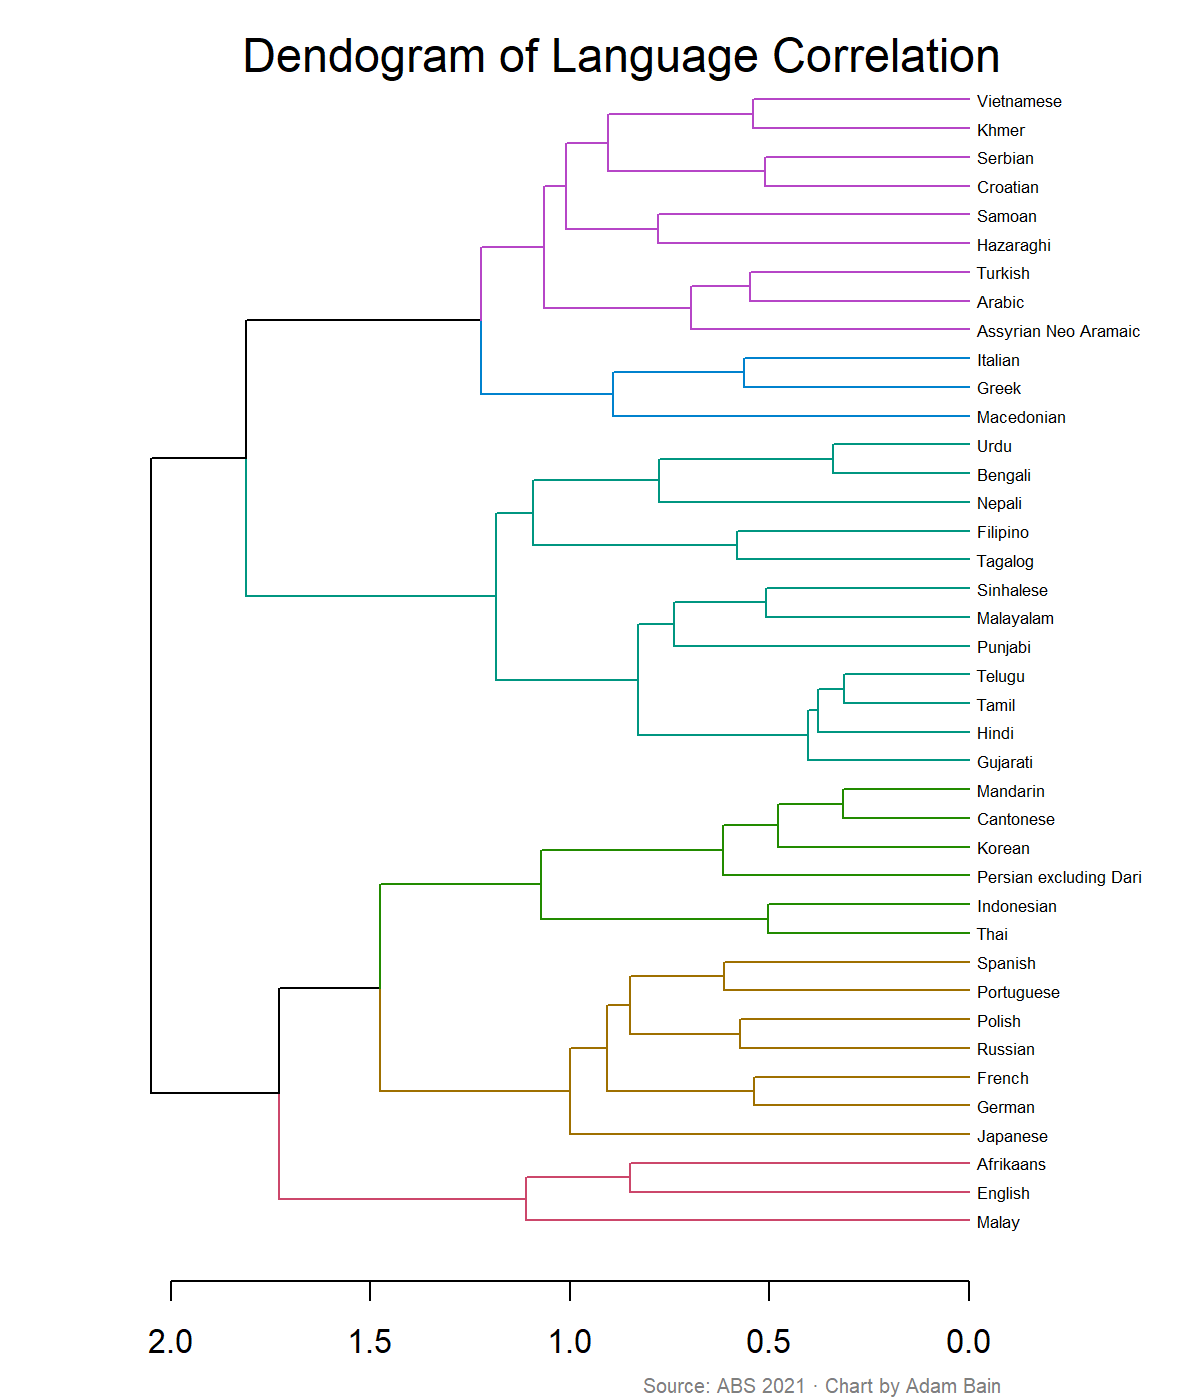
It is interesting to see the South Asian languages linked slightly more to languages from Southern Europe and the Middle East such as Italian, Macedonian and Greek, whilst the East Asian languages are clustered more with northern and western European languages, including English.
From personal experience, speakers of the second group do indeed tend to find themselves in less traditionally “ethnic” areas of Australia, such as the Eastern Suburbs of Melbourne and North Shore in Sydney.
One result particularly surprised me. “Persian excluding Dari” is much more strongly associated with Mandarin, Cantonese and Korean than with Hazaraghi, despite Hazaraghi itself being a variety of Persian.
I think what is going on is that people that speak “Persian excluding Dari” are mostly Iranian Australians whilst Hazaraghi speakers are mostly Afghan Australians.
I don’t believe there is a necessarily push factor driving away different Persian speaking communities, rather I think it’s a lack of pull factor, as these communities migrated to Australia in vastly different contexts.
The Afghan community in Australia is predominantly made of refugees of the Taliban rule and the following American invasion, many from the persecuted Hazara minority. They came from all different walks of life but generally spent time in countries such as Pakistan and Indonesia before arriving in Australia. A majority are adherents of Shia Islam.
The bulk of Iranian Australians in comparison, came to Australia in the wake of the Islamic revolution of 1979 directly from Iran. They are mostly non-Muslim with significant non-religious and Bahá’í cohorts and are largely critical of the regime back home. They are often highly skilled, and value education and job opportunities, common tendencies they share with Chinese and Korean speaking migrants, who they are more closely clustered with.
Below is a table of the top 10 SA2s by “Persian excluding Dari” speakers, alongside the local percentage of Mandarin speaking. The percentage of Australia as a whole who speak Mandarin at home is 2.7%.
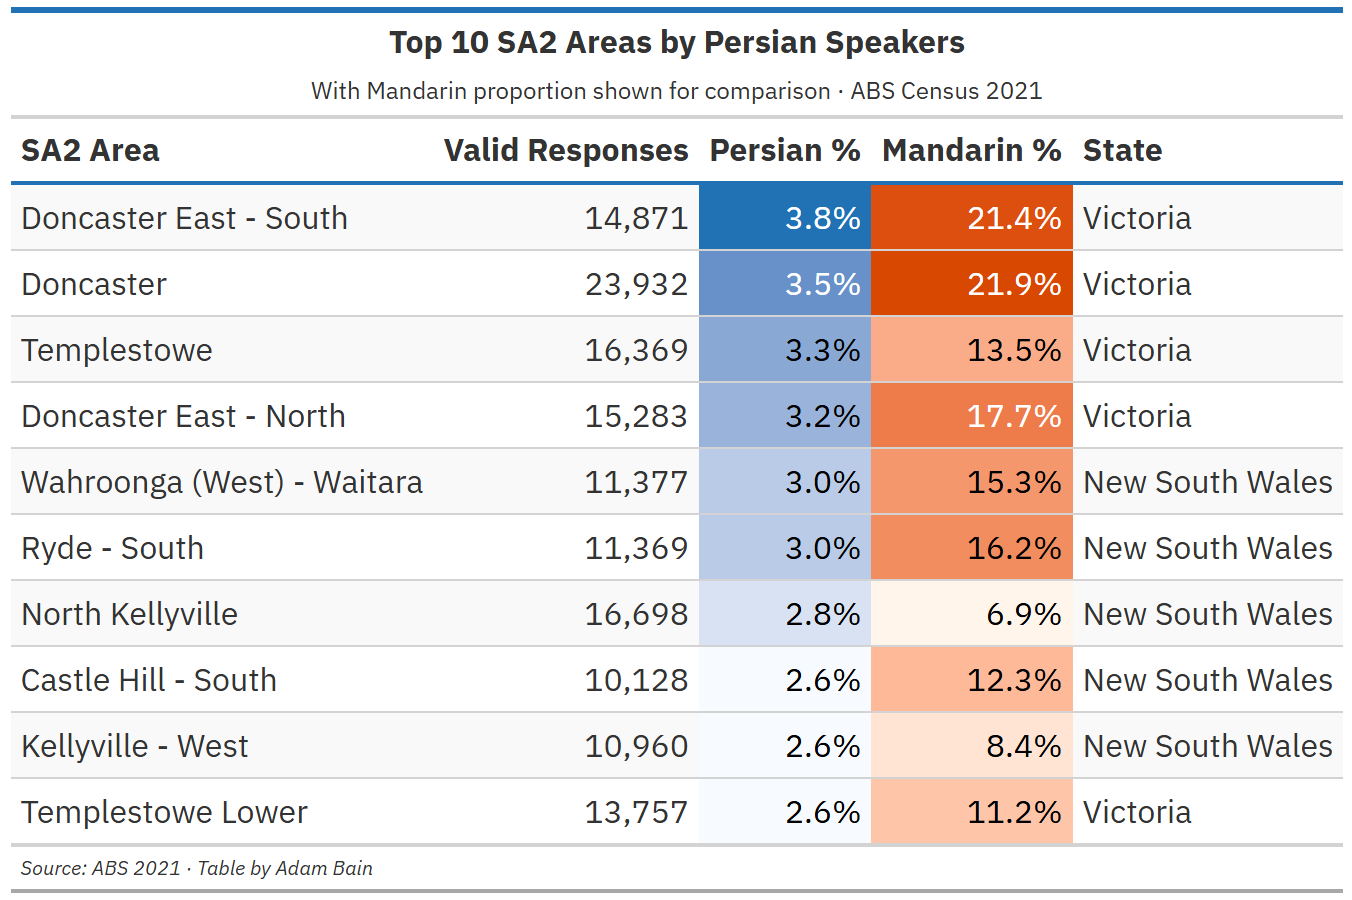
This list is dominated by the Manningham area of Melbourne and by The Hills and Ryde areas of Sydney. These areas are disproportionately high income, high education areas, and perhaps or perhaps-not coincidentally are hilly and have high forest cover.
Looking at these migration histories also raises a broader question. Throughout this series I have often treated language and ancestry rather interchangeably, but how closely are they actually connected?
Below is a chart of the top 40 ancestry responses in the 2021 census and the languages respondents from these groups spoke at home, sorted from most English speaking to least.
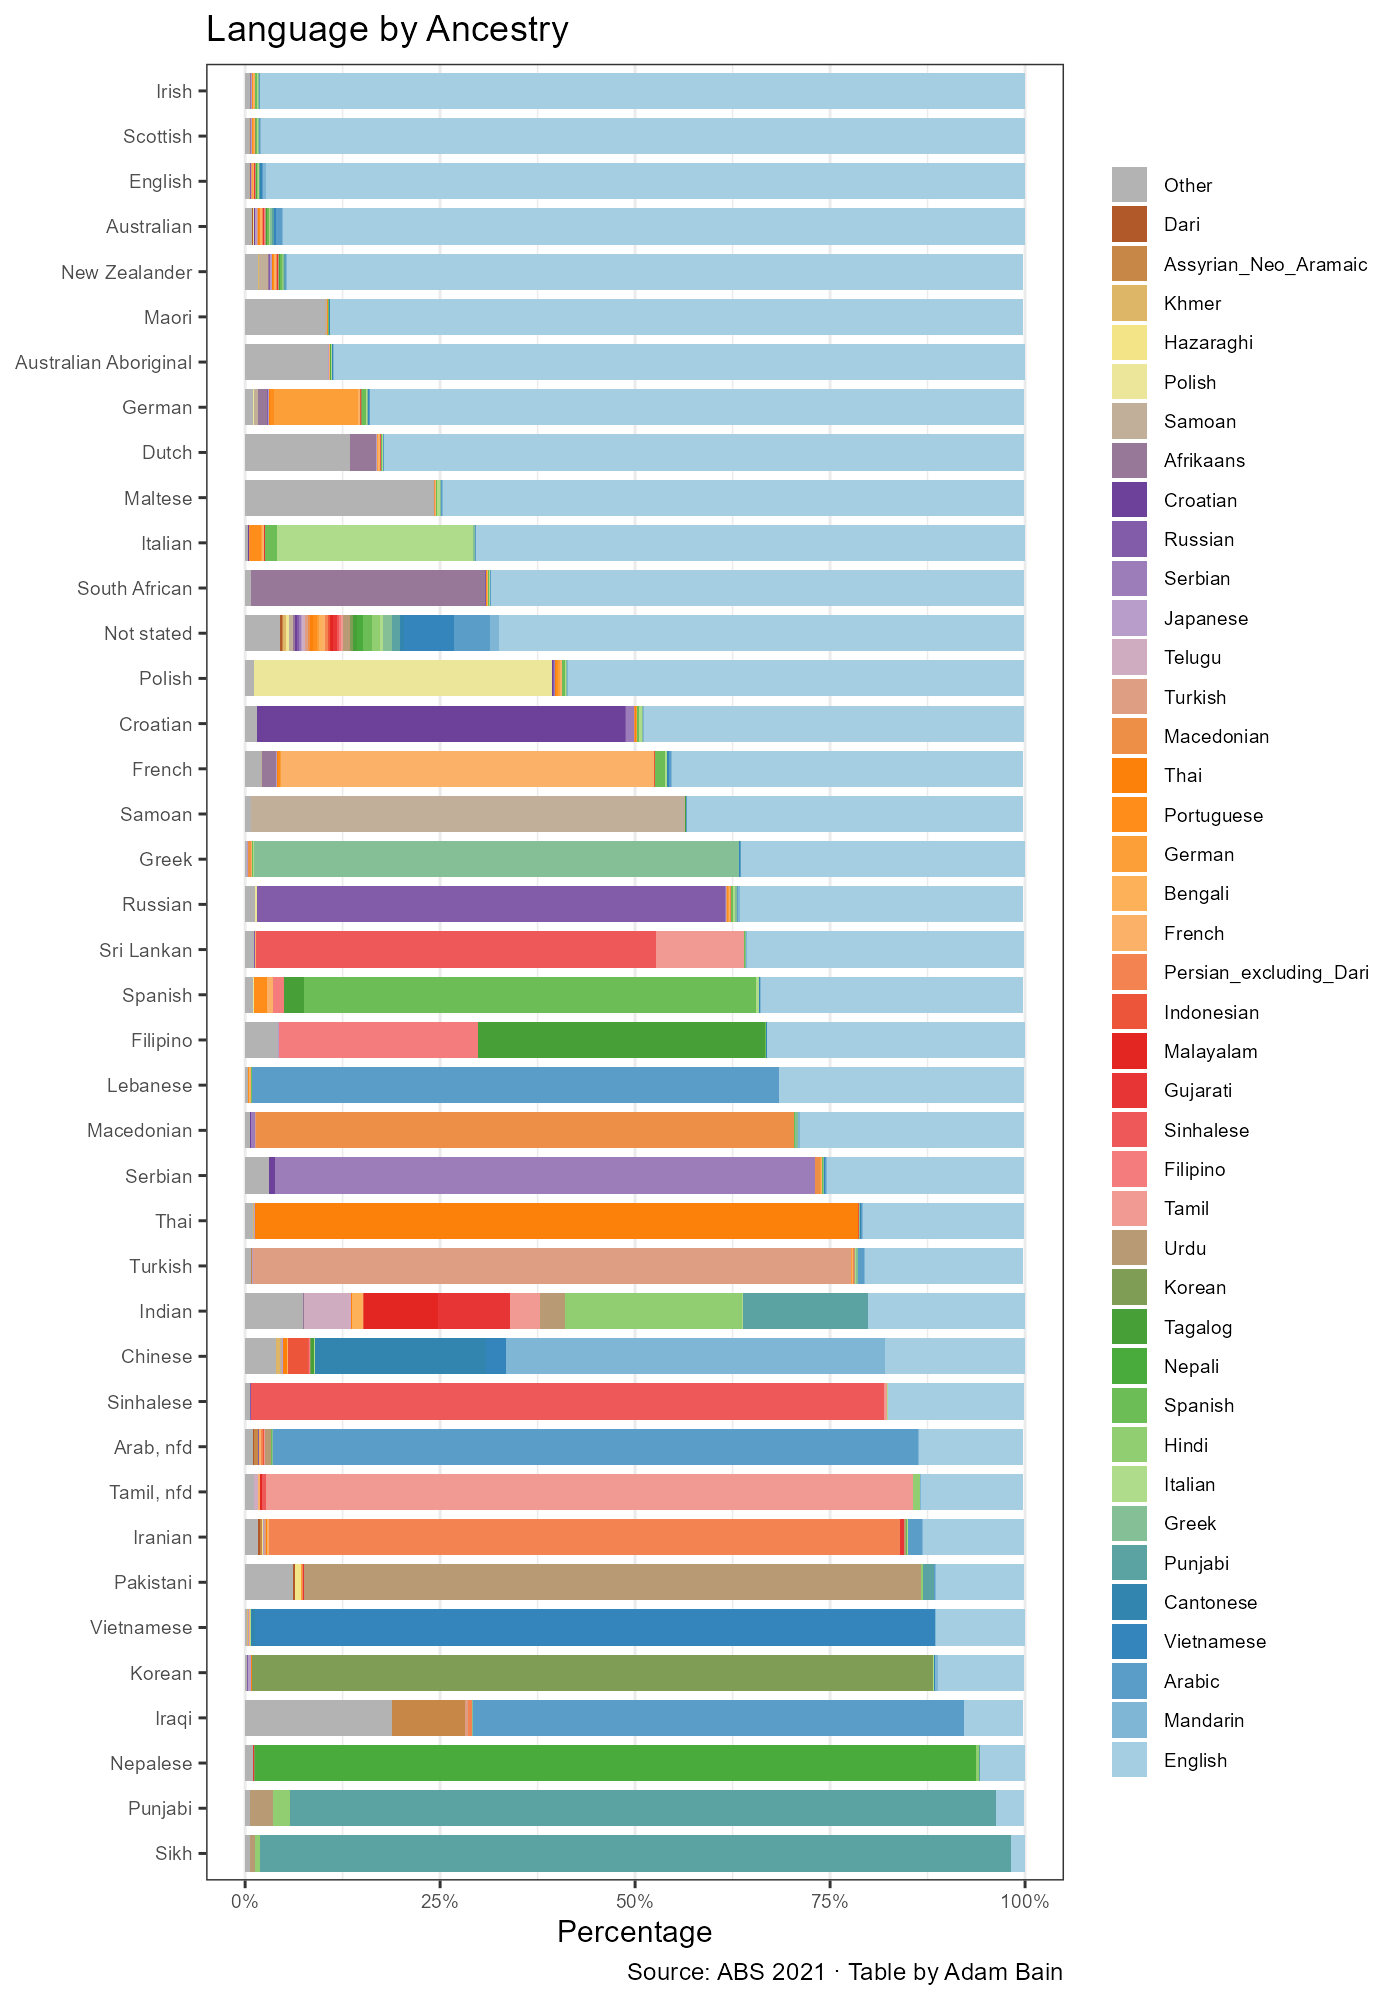
English ancestry perhaps surprisingly doesn’t have the largest proportion of English spoken at home; a bigger proportion of respondents who nominate Scottish and Irish ancestry speak English at home. I can personally vouch for a bit of that as my family is of both Scottish and Irish ancestry, and whatever Gaelic or Scots our ancestors may have spoken, it’s long since been forgotten in the family.
Respondents with European ancestry such as German and Italian tend to have a much higher proportion of speaking English at home than other groups such as Nepalese and Korean. I think this is tied to how long the migrant group has been in Australia for – Italian Australian immigration was mostly a postwar phenomenon, with subsequent generations slowly dropping Italian speaking, whilst Nepali Australians are mostly first generation. As time passes, I think it’s likely that people descended from recent migrants will increasingly speak English at home too.
Two ancestries stood out to me on this chart more than any, due to their internally diverse responses – Indian and Chinese.
Respondents who selected Indian ancestry responded with a mix of Malayalam, Hindi and Gujarati as their home languages. The other two large Indian languages in Australia dominated other ethnicity options, with Punjabi being spoken by respondents who selected Punjabi or Sikh and Sinhalese spoken by respondents that selected Tamil.
Respondents with Chinese ancestry were split between Mandarin and Cantonese. Throughout modern Australia, Mandarin is the more popular Chinese language, but there are some pockets where Cantonese is more widely spoken.
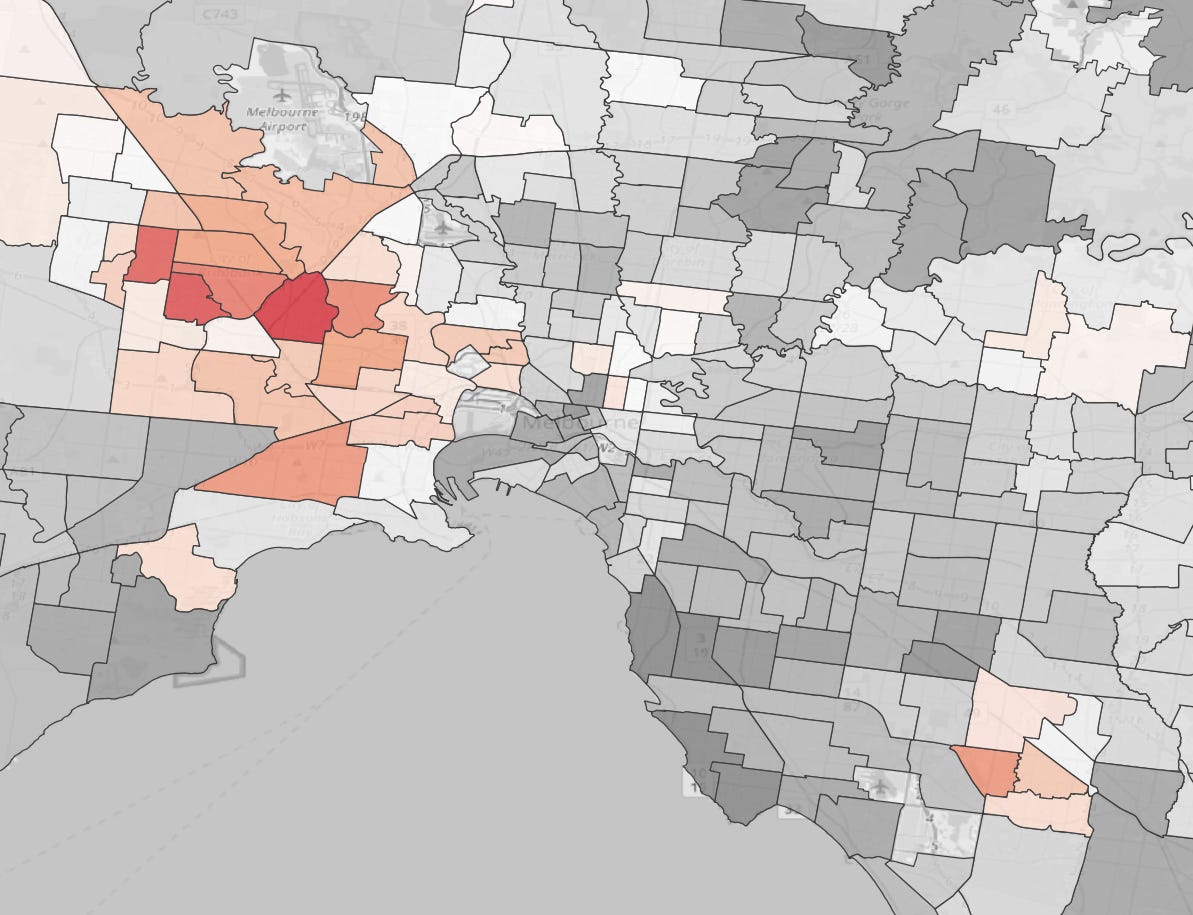
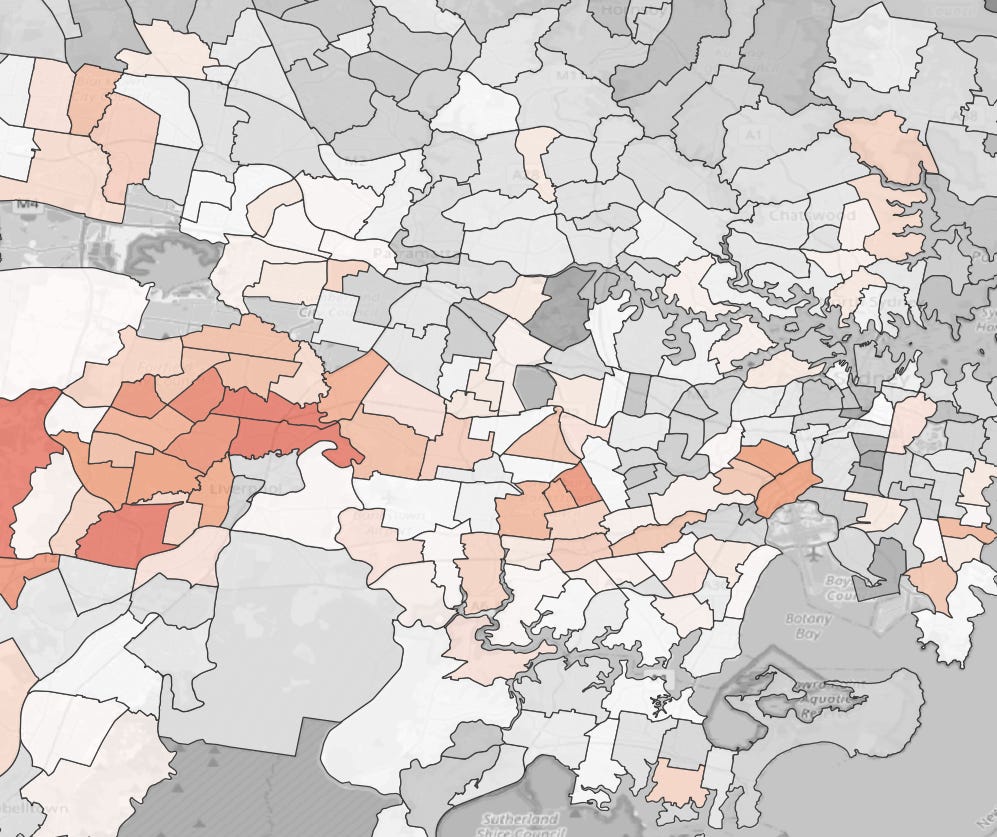
In Melbourne these are Sunshine and Springvale. In Sydney it is the Cabramatta and Lakemba areas. It is important to note this is not where Cantonese speakers are concentrated, it’s only where they outnumber Mandarin speakers.
The areas with proportionally more Cantonese speakers than Mandarin speakers tend to be areas with larger Vietnamese communities. I think that may be due earlier waves of Chinese migration to Australia coinciding with the Vietnamese refugees predominantly coming from the Cantonese speaking south, as well as Vietnam itself. The temporal connection with the Vietnamese community may have led to them collocating in the same areas.
This has been a long series of posts, and I have had a lot of fun investigating ABS census language data.
We started by looking at the areas where English is spoken the least and most at home, then looked at what the most linguistically diverse suburbs before finishing with the most co-located languages.
I’d like to thank all who have read through the end, I hope it has broadened your understanding of Australian demographics, an area that I am deeply interested in.
Unfortunately, I think I must address some misunderstandings that have been spread surrounding some of the material in these posts by far-right accounts online.
It is very important to note that series relied on the ABS’s “Language Used at Home” variable, which is not indicative about language used in the community. Most Australians who speak a different language at home speak English in workplaces, schools and public life.
Some far-right voices have gone a step further as of recent, criticising Australians for speaking a non-English language at home. To me, this misunderstands what these statistics measure. The census records what language people use within their households, not whether they participate in Australian society. Beyond the practical difficulties of policing language use within the home, I think attempting to do so would represent a draconian governmental overreach.
On a lighter note, I hope that these posts have helped widen our understanding of the cultural and linguistic geography of Australia. For my readers who are more interested in my transport content, do not worry because after this run of four consecutive non-transport articles, I can ensure the next one will bread and butter transport content.
Stay tuned!
No posts
Comments
Nothing yet. Say the first thing.
Sign in to join the conversation.