
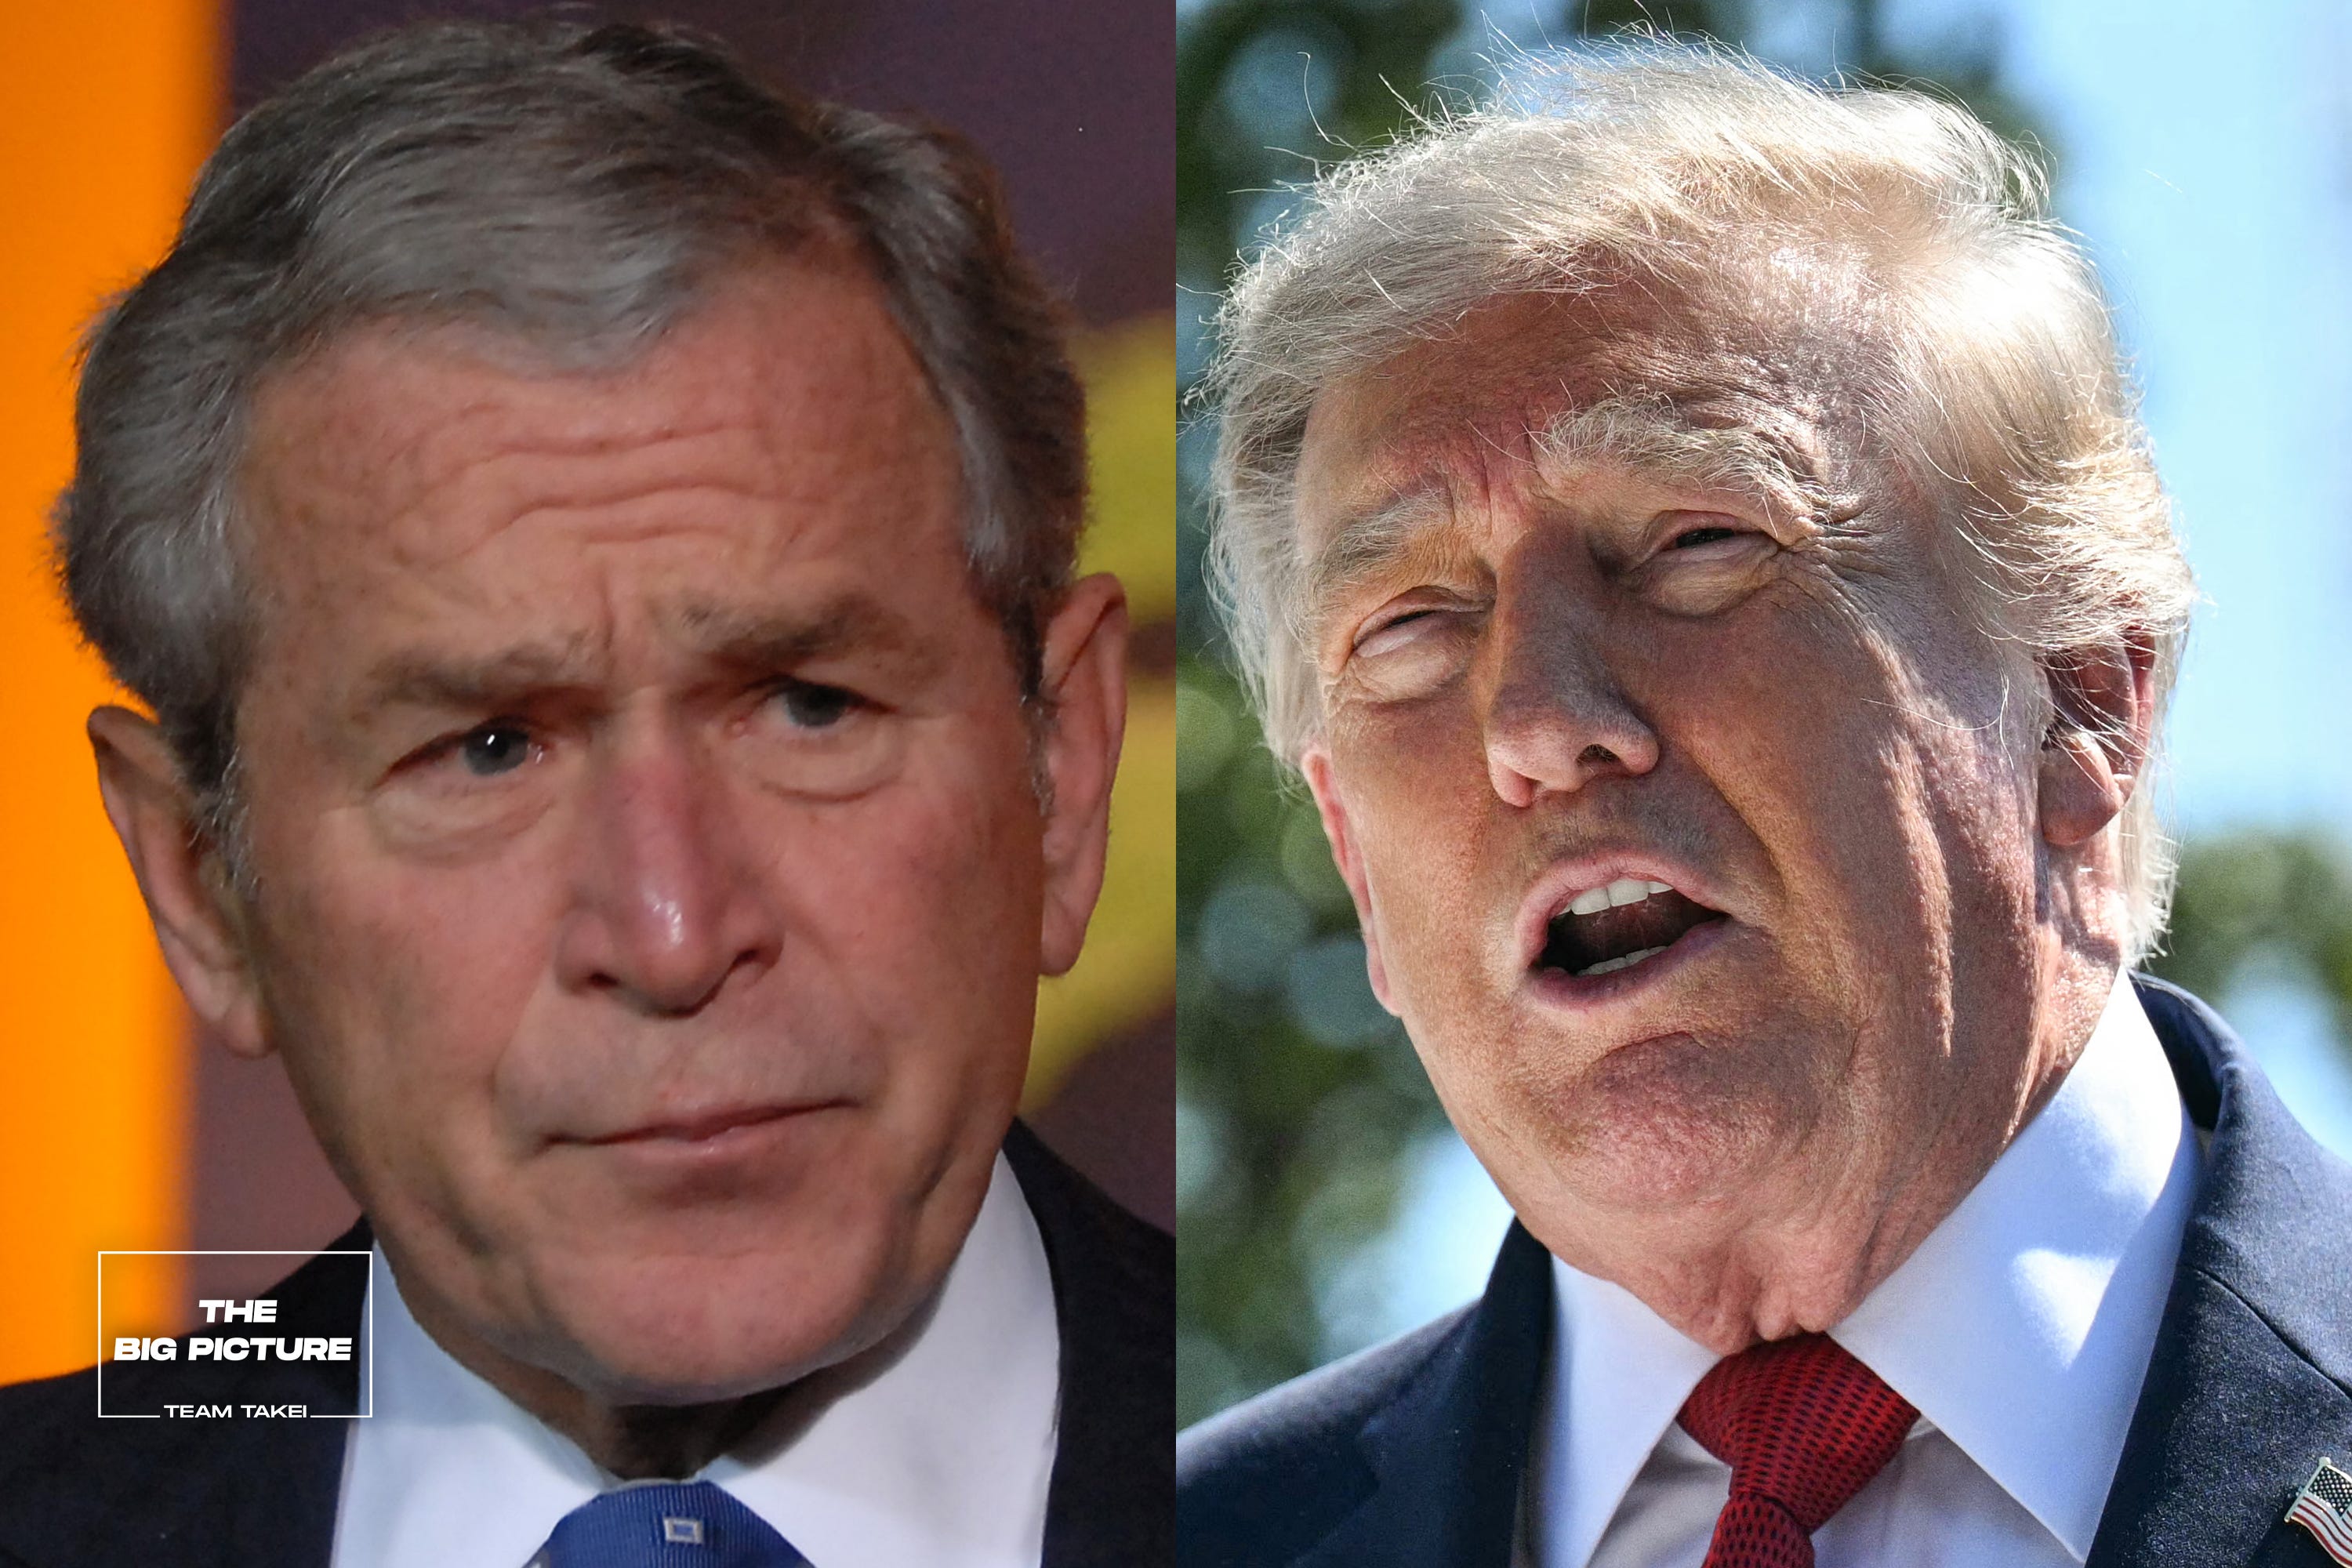
In the immediate aftermath of his 2024 presidential victory, Donald Trump declared that the American people had given him an “unprecedented and powerful mandate.”
This was absurd, of course. It was typical Trumpian hyperbole, but it immediately brought me back twenty years prior, almost to the day, when on November 5, 2004, George W. Bush declared his own presidential mandate, saying,
“I earned capital in this campaign, political capital, and now I intend to spend it.”
His declaration was no less absurd.
Trump had won the 2024 race by 1.5%, ultimately falling below 50%. In his reelection, Bush won by 2.4%, earning a bare majority of the vote.
Both men had first ascended to the presidency thanks to the Electoral College after popular vote losses, and these narrow victories no doubt served as vindication. But arrogance led each to misread their victories and overreach in their second terms, ultimately contributing to their descent to historic levels of disapproval.
But the similarities don’t end there.
With just 75 days until the 2026 midterm election, the myriad parallels between the 2006 cycle and this one are stark. Democrats are taking the lessons of 2006 to drive a wave similar to the one that propelled Nancy Pelosi to the Speakership 20 years ago. From there, they aim to leverage that energy into a massive presidential win in 2028, with expanded congressional majorities, just as they did in 2008.
We rely on the support of paid subscribers to keep us going and to subsidize coverage for readers who can't afford it right now. At just $6/month or $60/year (about 16 cents a day), becoming a paid reader helps keep this work accessible to everyone, not just the people who can pay for it. Thank you for your continued support!
As I recounted in a piece just weeks after Trump won back the White House, in early 2005, Bush insisted on “spending the capital” he’d earned in the election by pursuing Social Security privatization, something nobody had voted for. It was this policy overreach that first began to sour the American people on his presidency. He launched his second term privatization push in his February 3, 2005 State of the Union address. And as Brookings summarized,
Within weeks, observers noticed that the more the President talked about Social Security, the more support for his plan declined. According to the Gallup organization, public disapproval of President Bush’s handling of Social Security rose by 16 points from 48 to 64 percent between his State of the Union address and June.
According to Gallup, Bush’s approval rating was as high as 57% in February. By August 1, it had dropped to 45%.
By September, in the wake of his disastrous handling of Hurricane Katrina and with support for Iraq dropping fast, NBC reported, “Bush’s job approval has plummeted to 40 percent, an all-time low for the president.” In Gallup’s polling, Bush first dropped below 40% as of November 1, 2005. And on the eve of the 2006 midterms, Bush was down to 33%.
In that wave election, Democrats retook both the House and Senate, netting 31 new House seats and a whopping 6 Senate seats, giving Rep. Nancy Pelosi the Speaker’s gavel and making Senator Harry Reid Majority Leader.
Trump’s trajectory has been remarkably similar.
In January 2025, Trump wasted no time “spending” his own perceived political capital, making Bush’s privatization push seem almost quaint. His firehose of executive orders began on Day One and continued through March. He signed EOs to reduce the federal bureaucracy, to shutter the Department of Education and to implement voter ID. This was followed by his Liberation Day tariffs in April, the introduction of the “Big Beautiful Bill” in Congress in May and his deployment of National Guard troops to Los Angeles in early June to quell protests resulting from mass ICE arrests.
After beginning his presidency with an approval rating of over 50 percent, by August, his approval had been driven down to 42%, hitting 40% in November per Fifty Plus One’s polling average—the same number as Bush at the same point in his second term. By January of this year, amid the disastrous ICE deployment in Minneapolis, Trump’s average approval had dropped into the 30s. After a poll showed Trump’s approval as low as 36 percent this past March, The Bulwark’s Sarah Longwell declared, “I want to see Trump at 32%,” a number she labeled “The Bush line” because it was Bush’s approval when he left office in 2009.

Sarah Longwell@SarahLongwell25
George W. Bush left office with a 32% approval rating. That was enough to cost Republicans two Prez elections, but more importantly left the party so weak that Trump was able to hijack it and turn it into something completely different. I want to see Trump at 32%. The Bush line.

6:54 PM · Mar 25, 2026 · 2.9M Views
380 Replies · 1.04K Reposts · 7.3K Likes
Due in large part to the rise in gas prices resulting from Trump’s war in Iran, which he launched at the end of February, Trump only needed until July 29 to achieve that distinction.
Sarah Longwell@SarahLongwell25
That, my friends, is the Bush Line.

InteractivePolls @IAPolls2022
🇺🇸 NATIONAL POLL By Quinnipiac Pres. Trump Approve: 32% (-6) Disapprove: 58% (+3) Trump's lowest approval in either term —— Trump's net approval on key issues 🟤 Immigration: -17 🔴 Economy: -32 (new low) 🔴 Foreign policy: -32 (new low) 🔴 Iran: -38 (new low) —— 7/23-27 |
8:56 PM · Jul 29, 2026 · 728K Views
207 Replies · 776 Reposts · 6.65K Likes
But as Cook Political’s Amy Walter noted earlier this month, there are even more notable commonalities between 2026 and 2006.
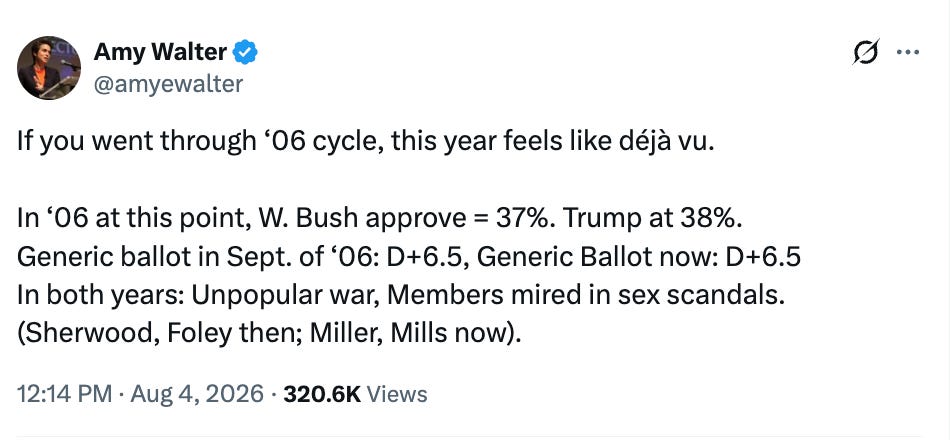
For both George W. Bush and Donald Trump, their sharp second-term declines in approval were exacerbated by other factors, including unpopular wars in the Middle East of their own making and remarkably weak economies.
For much of George W. Bush’s first term, his approval rating was buoyed by a post-9/11 rally-around-the-leader glow. It’s hard to imagine these days, but in the wake of 9/11 and the launch of his wars in Afghanistan and Iraq, Bush didn’t dip below 50 percent until 2004. That’s when it became clearer to the American people that the “mission” in Iraq had not been “accomplished” as Bush claimed the year before, and as the Abu Ghraib prison scandal hit that summer. Ultimately, his ploy to run for reelection as a wartime president was successful, returning to positive territory with 51 percent approval in mid-to-late October just in time to win reelection over John Kerry that November.
But by September of 2005, in the same NBC News poll that saw Bush at 40% approval for the first time, his numbers on Iraq hit a new low.
The poll also finds that just 37 percent of respondents approve of Bush’s job handling Iraq, compared with 58 percent who disapprove — another all-time low. In addition, 55 percent want to reduce the number of troops in Iraq, while just 36 percent want to maintain the current level there.
Additionally, while Iraq raged and Bush was pilloried for his response to Hurricane Katrina, there was another notable development that summer. As the headlines blared:
ABC News, July 17, 2005: Gas Reaches Second-Highest Average Price
CNN, August 14, 2005: Gas Prices Hit High
The AP, August 23, 2005: Gasoline prices rise 6 cents to reach a new record high
This is painfully similar to headlines in the months following Trump’s own Middle East misadventure in Iran, which he launched on February 28, 2026.
This April 28, 2026 CBS News headline certainly sounds familiar:
And now, as we approach six months of Trump’s own Middle East quagmire, this is how The Economist put it, as a new poll finds Trump at 35% Approval and 61% Disapproval:
Donald Trump’s net approval is -26 according to The Economist’s tracker of YouGov polling. The administration’s resumption of strikes on Iran in mid-July may be to blame. Since then both sides have been locked in a cycle of fighting and half-baked attempts at a ceasefire. Still, by this point, most Americans will not be surprised by Mr Trump’s failure to reach a face-saving settlement to re-open the Strait of Hormuz. Our polling suggests 61% are uneasy about the president’s ability to deal wisely with an international crisis.
Notably:
Mr. Trump’s net approval rating for his handling of inflation and prices reached -44 in August, the lowest it has been this term. That is hardly unexpected. Before the Iran war began, the average price for a gallon of petrol was under $3. Now it is around $4, although inflation has cooled somewhat since the start of the war.
Not to be outdone, take a look at this Fox News headline published just yesterday, reporting on the latest Reuters/Ipsos poll with Trump at a new low approval of 33%:
Gas prices have jumped from $3 to over $4 per gallon since the Iran war began, and 80% expect an extended conflict
Trump has never been a student of history. But he need only have looked back 20 years to understand just how devastating to the country—and to his approval—launching a war in the Middle East during an election year would likely prove to be.
The generic ballot polling question heading into any even-year election serves as an important gauge of general voter sentiment and tends to be predictive as to who will ultimately win control of Congress. Pew Research Center words the question as follows:
“If the elections for U.S. Congress were being held today, would you vote for the Republican Party’s candidate or the Democratic Party’s candidate for Congress in your district?”
As Pew puts it:
There is no national election for Congress, of course; rather, 435 individual races determine the composition of the House. So while it might seem that the generic ballot is too broad a measure to forecast the outcome, it has proven to be an accurate predictor of the partisan distribution of the national vote.
The final forecast of the generic House vote and the actual vote totals have paralleled each other very closely for nearly a half-century in U.S. elections. The average prediction error in off-year elections since 1954 has been 1.1%. The lines plotting the actual vote against the final poll-based forecast vote by Gallup and the Pew Research Center track almost perfectly over time.
Looking at the 2026 midterm generic ballot polling averages today, Fifty Plus One has Democrats up 6.1 points, Real Clear Politics (RCP) has Democrats + 6.4, Race To Win has them at +6.5, and Silver Bulletin at +6.6.
As Walter suggests above, this is eerily similar to RCP’s September 2006 generic ballot average, which had Democrats up by +6.5. According to RCP’s interactive generic ballot graph, the final average heading into Election Day that year had Democrats up by 9.6 percent. The final result that year: Democrats up 7.9. With just 75 days until Election Day, could Democrats replicate such a margin?
Nate Silver thinks so. In a piece published on August 11, when his generic ballot average had Democrats up 6.7, Nate wrote:
…that 6.7-point margin might actually lowball Democrats. That’s because most generic ballot polls at this not-exactly-early-but-not-exactly-late point are being conducted among registered voters rather than likely voters — and therefore, don’t account for turnout. FLIPR makes a likely voter adjustment. In line with our longstanding practices, the adjustment is based mostly on polls that release both likely and registered voter versions of the same survey. Typically in such polls, the LV version has been better for Democrats than the RV version.
In yesterday’s estimate, Silver’s model, which he dubs FLIPR (Forecast with Leading Indicators, Polls and [Expert] Ratings) converts a default polls-only average of D+6.5 to a more robust 7.9-point advantage for Democrats.
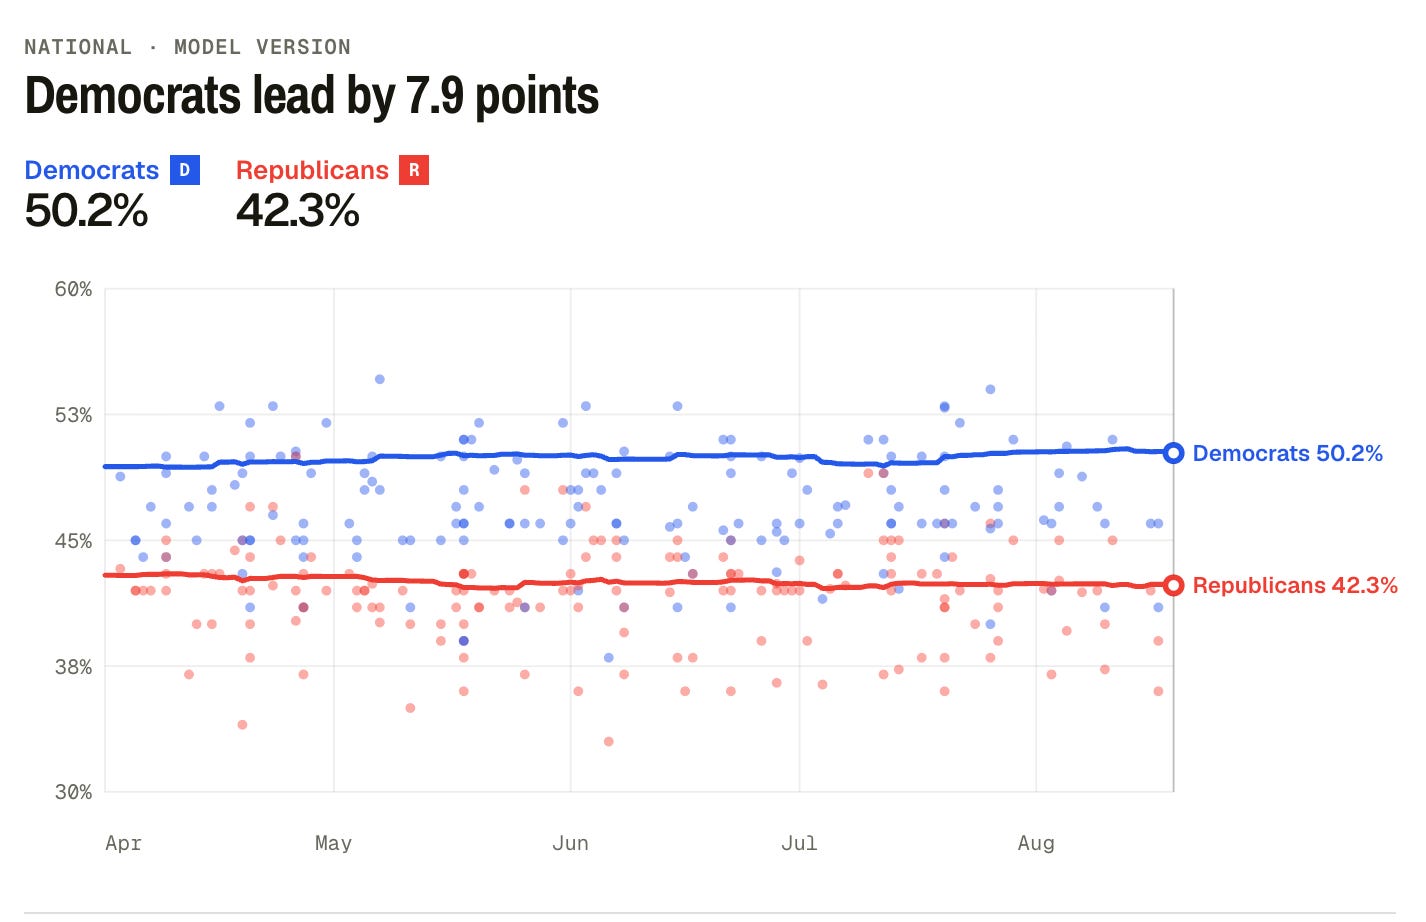
As Nate explains, even that may underestimate Democrats’ ultimate Election Day performance.
How about the longer sweep of history? Well, FLIPR has a calculation for that, too. We estimate a “prior” based on all congressional elections since 1946, calibrated based on the president’s approval rating, the result of the previous election, and whether the election was a midterm, and adjusted for ever-increasing partisan polarization. In that calculation, Democrats are favored to win the popular vote for the U.S. House by 8.7 points instead.
Such a result would track almost precisely with the 2006 popular vote margin.
In this environment, with Republicans holding onto a mere 3-seat majority in the House, few question whether Democrats are likely to retake the House. For example, Nate Silver’s most recent deluxe model gives Democrats an 85 percent chance of doing so. The only variables that remain are 1) How large will Democrats’ majority be, and 2) Will the wave be able to sweep Democrats into power in the Senate as well?
Per FLIPR, the projections range from Democrats picking up 18 to 21 seats in the House, even given the GOP advantage through gerrymandering (more on that below). Interestingly, in the Senate, whether you just look at polls or adjust for fundamentals, the model is clear: Democrats have around a 57 percent likelihood of retaking the Senate with a net pick-up of 4 seats.
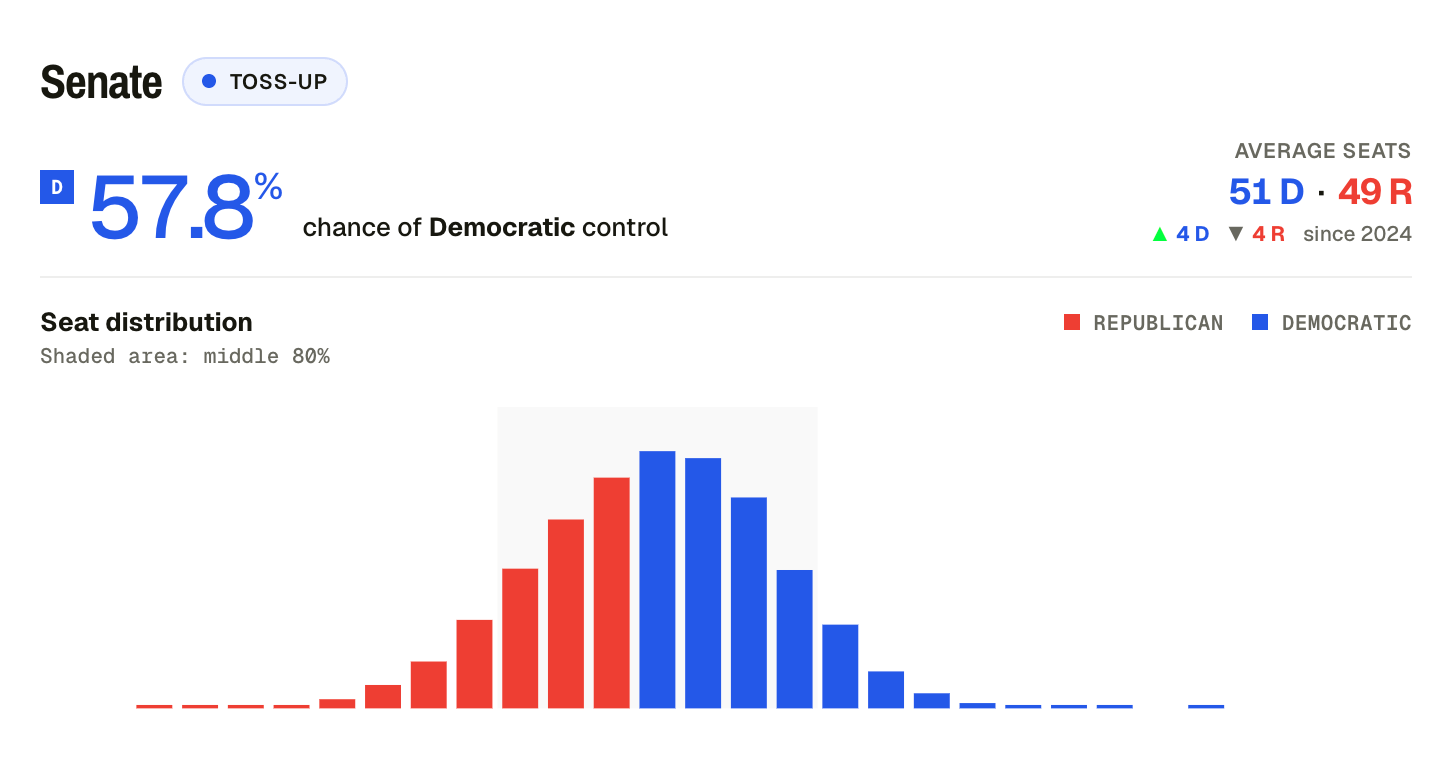
While a net gain of four Senate seats would underperform 2006’s net gain of six, it should be noted that Nate’s model projects that if Democrats do win the congressional popular vote in November by between 8-9 points, that would translate to a 5th net Senate pick-up.
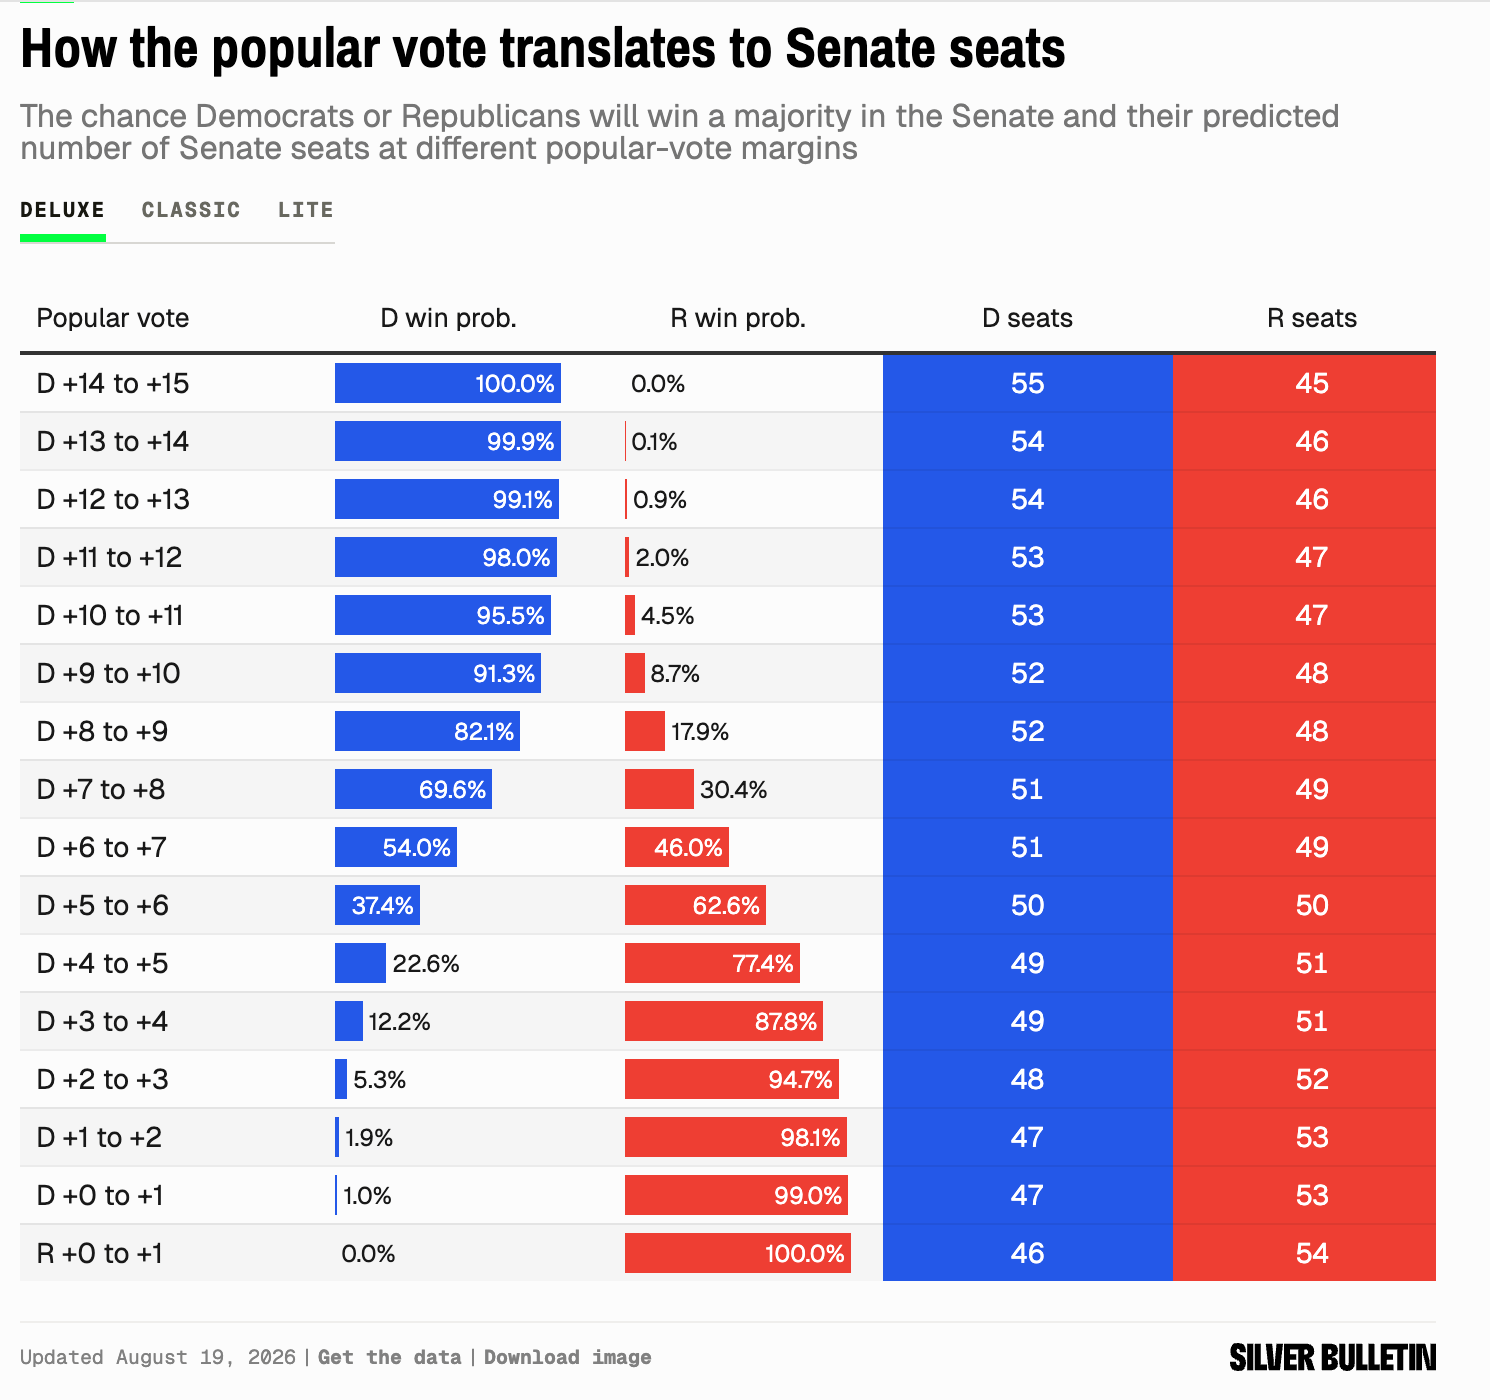
In this universe, Democrats would hold onto both Michigan and Georgia, and flip Maine, North Carolina, Ohio, Alaska and Texas. And that doesn’t even count Iowa, which FLIPR rates as a tossup, although currently favoring the Republican.
It’s worth diving into why an 8+ point advantage in the congressional popular vote would net Democrats just 18 seats in the House this year whereas that same margin of victory netted them 31 seats in 2006.
As Nate Silver explains it:
In the House, Republicans basically won the war in an unprecedentedly aggressive round of mid-decade redistricting, which left the map with a mild Republican bias. That gives Democrats a hurdle to clear. Not to be overlooked: extremely partisan maps drawn by both parties have greatly reduced the number of competitive districts in the House. Even if Democrats have a great year — say, they win the national popular vote for the U.S. House by 9 percentage points, which would qualify as a landslide by modern standards — they’ll have trouble matching the 41-seat gain that they had in 2018.
Or the 31 they gained in 2006.
In the last 20 years, due to a combination of partisan gerrymandering and increased polarization, there are simply fewer seats in play this November. For example, ahead of the 2006 midterms, The Center for Politics rated 70 Republican seats truly in play while just 10 Democratic seats were. Compare that to the 38 total seats they rate either a Toss-up or Lean either R or D this year.
Despite this, just as we saw become key to their strategy back in 2006, the Democrats keep expanding their map of targeted seats.
As Politico reported on August 5, the DCCC is adding 12 Republican-held districts to its target list, bringing its “Districts In Play” up to 58 seats.
The expansion puts several prominent Republicans in Democrats’ sights, notably including Lauren Boebert in Colorado’s 4th, Victoria Spartz in Indiana’s 5th, French Hill in Arkansas’ 2nd, while also adding Tony Gonzales’ now open border seat in Texas’ 23rd, as Democrats bet voter backlash has put even Trump territory in play.
On top of that, just today, Democrats added five more races to their Red to Blue program.
The Democratic Congressional Campaign Committee (DCCC) is adding five new races to its Red to Blue list, a program that looks to equip candidates in particularly competitive districts.
The Red to Blue program is backing Tom Perriello in Virginia, Nancy Lacore in South Carolina, Matt Dunlap in Maine, Zach Dembo in Kentucky and Leela Gray in Florida, bringing the program’s designated races to a total of 37.
It’s no accident that these shifts followed soon after The Center for Politics shifted 13 House race ratings toward Democrats. It is also not an accident that it came in the wake of high-profile Republican scandals.
Take Rep. Max Miller in Ohio’s 7th District. This district went for Trump by 11 points in 2024. Now, in the aftermath of the high-profile accusations of domestic and even child abuse against Miller and his refusal to leave the race, the DCCC is targeting the seat, which is now rated a toss-up.
Then there’s Rep. Chuck Edwards, who represents NC-11, which normally would have been a safe hold for Republicans. Now, however, per Axios,
Chuck Edwards (R-N.C.) dropped his reelection bid after the Ethics Committee found he violated House rules by sexually harassing female aides and creating a hostile work environment. That’s set off a scramble to find a replacement just three months before the election.
The race was shifted to “toss-up” last week by Sabato’s Crystal Ball, even before the ethics report was released. Trump won Edwards’ district by 9.5 points last cycle.
Two other scandal-plagued Republicans in safe districts, Andy Ogles (R-TN) and Cory Mills (R-FL), were recently ousted in their primaries, and their seats are being targeted by the Democrats as well.
This is yet another redux of the 2006 cycle when Republicans’ high-profile scandals led to multiple resignations and fed one of the central narratives of that midterm cycle: The Culture of Corruption.
This year, as Donald Trump outwardly flaunts unprecedented levels of official abuse and corruption seemingly every day, this angle of attack is becoming central to Democrats’ 2026 strategy, particularly when it comes to retaking the U.S. Senate.
As the DSCC’s press release framed it just today:
With less than three months until the midterm elections, new reporting highlights how Democratic candidates are taking on corruption, which is “shaping up to be a major campaign battlefront.”
As warning signs continue to mount for Republicans, polling finds “voters tilted toward associating the Republican Party with corruption,” and voters now ranking “government ethics and reform” high among issues they care about.
Specifically:
For both Sen. Jon Ossoff and state Rep. James Talarico, inveighing against corruption is a key part of their political identities, with their broadsides against Trump and the broader political system key to their viral popularity among liberals.
Both have also been gifted opponents who make for target-rich environments. […] Rep. Mike Collins, the target of the aforementioned House Ethics investigation […] made a fortune in the trucking industry and has backed policies helping it. Talarico is running against state Attorney General Ken Paxton, who handed out the plea deal to a sex offender, faced an indictment on securities fraud charges and was once impeached by the Texas House of Representatives.
The Democrats understand the assignment.
After the 2006 midterm elections, Democratic momentum didn’t slow. As the war in Iraq and the economy worsened, the desire for even more change grew. Gallup found Bush at 25 percent approval in October 2008 ahead of Barack Obama’s landslide presidential victory. In that same election, Democrats were able to expand their majorities in both chambers of Congress (Democrats netted 21 additional House seats and a remarkable 8 additional Senate seats.)
It is hard to imagine such a convergence of historic blunders as Bush presided over in the latter half of his second term—including both the war in Iraq and the 2008 financial crisis—driving Democrats to such majorities in this environment. But Trump’s war in Iran is increasingly seen as a quagmire, and inflation will likely continue to weigh Trump’s approval rating down even after the midterms.
Looking ahead, there are key points to note:
The 2028 Senate map.
In 2028, 34 Senators are up for reelection, including 15 Democrats and 19 Republicans. The fact that the battle for Senate control will largely be fought on Republican terrain is good news for Democrats, although the vast majority are deep red states. There are a few prime pick-up opportunities for Democrats, however, including in Wisconsin, North Carolina, and Ohio. And depending on how 2026 goes, Iowa and Florida may very well be in play as well.
A Change Election
In 2008, even though Democrats had held Congress for two years at that point, they were able to credibly frame themselves as the party of change, particularly as Barack Obama’s campaign became a political and cultural phenomenon. Democrats understand that they must once again take up the mantle of change ahead of 2028. And while it’s difficult to envision another Obama-like campaign, we are already seeing Democratic hopefuls pivoting their messages to a change/anti-system message, anticipating that they can ride continued disapproval of Trump to another back-to-back wave.
Redistricting
One aspect to the 2028 cycle that was not in play 20 years ago is redistricting. Democrats must move aggressively ahead of 2028 to counter the advantage Republicans gained this year. That will have to take place in blue trifecta states, which Marc Elias breaks down here.
But crucially, in a sign that Democrats are rising to the fight, the party understands it can only maximize redistricting advantages by bolstering state-level legislative majorities.
And per Time, that effort is well underway.
Democrats are setting the stage to pursue redistricting efforts in as many as 13 states before 2028, redrawing congressional lines to secure potentially dozens of additional House seats, according to an internal strategy memo obtained exclusively by TIME. To move forward on that plan, party strategists have a list of fewer than two dozen state legislative seats they need to flip in this year’s midterm elections.
“Our ability to go on offense in this year’s environment is not only important for power in 2026, but will have an enormous impact on the power we can build through the end of the decade and wield in the post-2030 redistricting process,” wrote Heather Williams, the president of the Democratic Legislative Campaign Committee, the Democrats’ official arm that works on state legislative races.
As we approach the final stretch of this year’s midterms, and if two-decade-old history is any guide, the wind is at Democrats’ backs to take back both the House and Senate. The question is not just how big the growing Democratic wave will be, but whether the party can convert those wins and continued anti-Trump sentiment into another massive victory in two years.
Our democracy depends on it.
Thanks for reading! This post is public so feel free to share it.
Comments
Nothing yet. Say the first thing.
Sign in to join the conversation.