
Before I get into this essay and the technical analysis, I want to make clear that, in my opinion, all markets are cyclical. We can argue about the length of those cycles, and we’ll discuss some of that throughout this essay.
But buying quality assets, whatever your definition of quality might be, at low prices has been a winning strategy for me throughout my crypto career. I would consider 70 to 80% off an all time high a low price. That doesn’t mean it can’t go lower.
Simply buying and holding quality assets has allowed me to multiply my net worth by around 20x over seven years of full time work in this industry, and that’s at today’s prices. At the highs, it was closer to 50x.
So I want to make this clear. When I get extra cash, I am DCAing into these prices. Full stop.
The rest of this essay is my speculation on technical analysis and what could come next. But my overriding feeling is that if you’re not DCAing now, you’re probably making a mistake in regards to your future self.
We’ll start with the bad because we want to finish with the good. So we’ll go bad, ugly, good.
And to start with, we’re going to look at open interest and leverage.
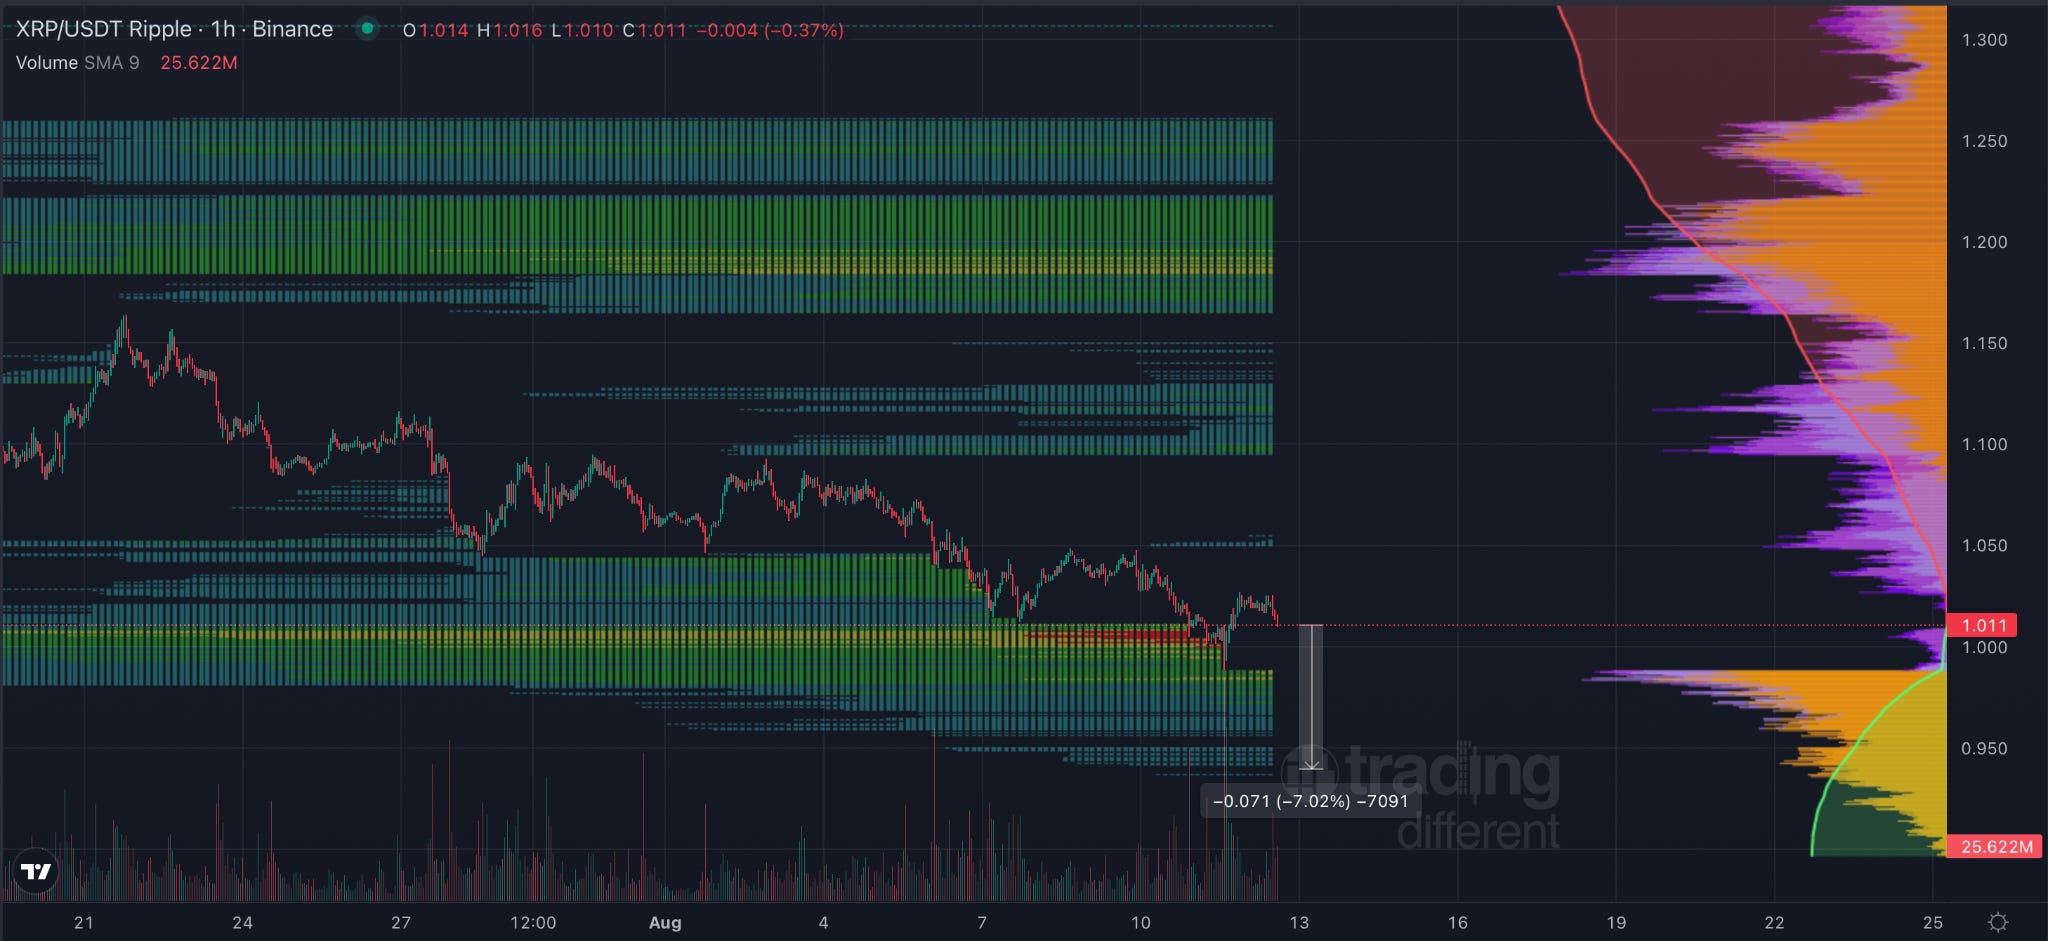
If we look at the low timeframe using heat maps, what we can see is there’s roughly 7% downside open interest that XRP could still feasibly take.
From a simple heat map perspective, what we can see is that if the price moved down to around $0.89, we would take roughly $157 million worth of open interest there. So we’d essentially liquidate $157 million worth of long positions.
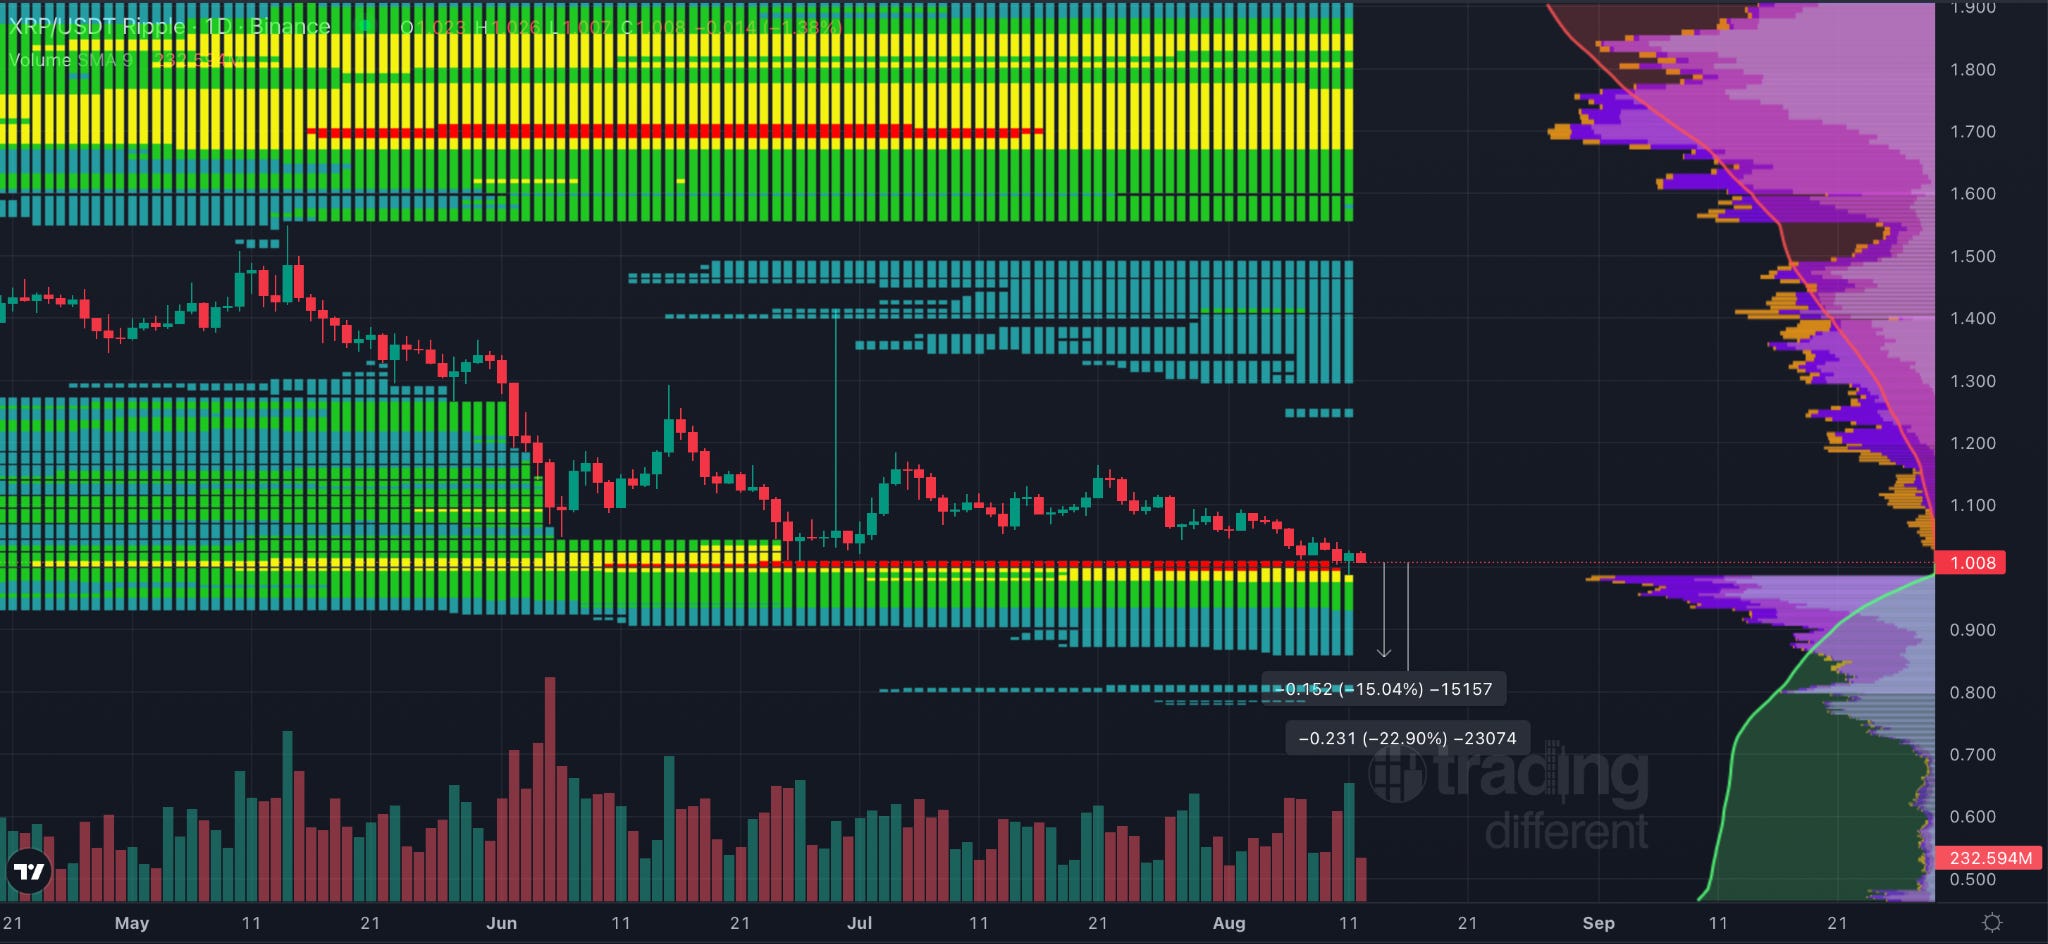
Zoom out to the higher timeframes, the daily in this example, and still using the same liquidity pools, what we can see is there’s a downside argument for between 15% and 22 to 23%.
I would say it’s most likely that the 15% target is taken. There is also an argument to say that we don’t need to take the lighter blue liquidity. Some liquidity is always left behind, and of course, as we find a low, there will be some liquidity that builds below that low as people jump in long and try to find the bottom.
So just remember that there’s always some liquidity left behind. It’s only 80% of the time that liquidity is taken.
With that being said, this also suggests that we have further downside to come and would make an upside move a lot more appealing if we swept this liquidity first. Because, as I said, 80% of the time we move into liquidity. So if we have liquidity below us and continue to move higher, there’s an 80% chance that we would have to come back and take that.
This would take us to roughly $0.85 if we took the 15%, and if we did the whole 22 to 23%, it could take us down to around that $0.77 mark.
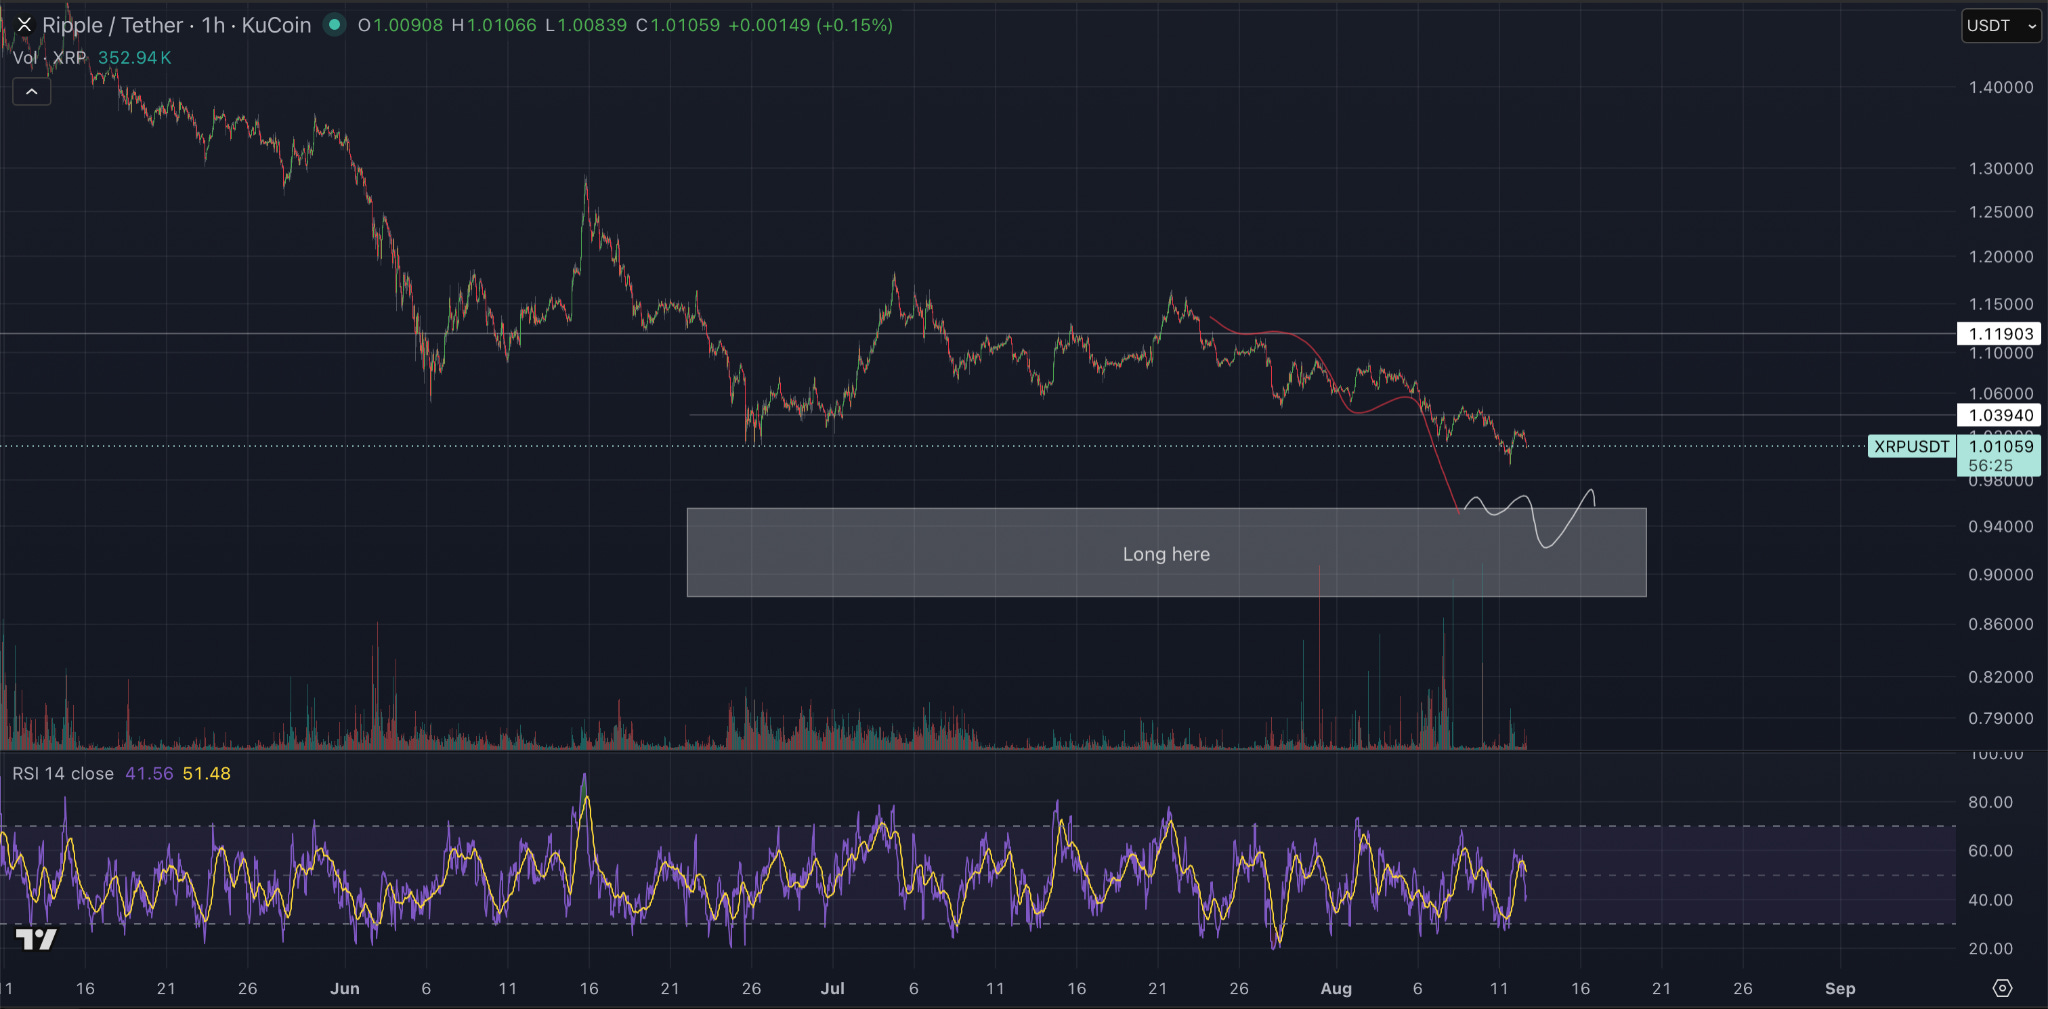
The discussion above is some, but not the only, reason why I’ve been discussing this long here area on XRP. You’ll have seen this if you follow me over there on X.
Additionally to this, just from an observational perspective, what we can see is a continuation of lower highs and lower lows for XRP, showing that there is a clear downtrend that hasn’t been violated for quite a while.
The next thing I try to look for and pay attention to after we’ve got these liquidity “targets” is whether there’s anywhere technically that I think they could line up with.
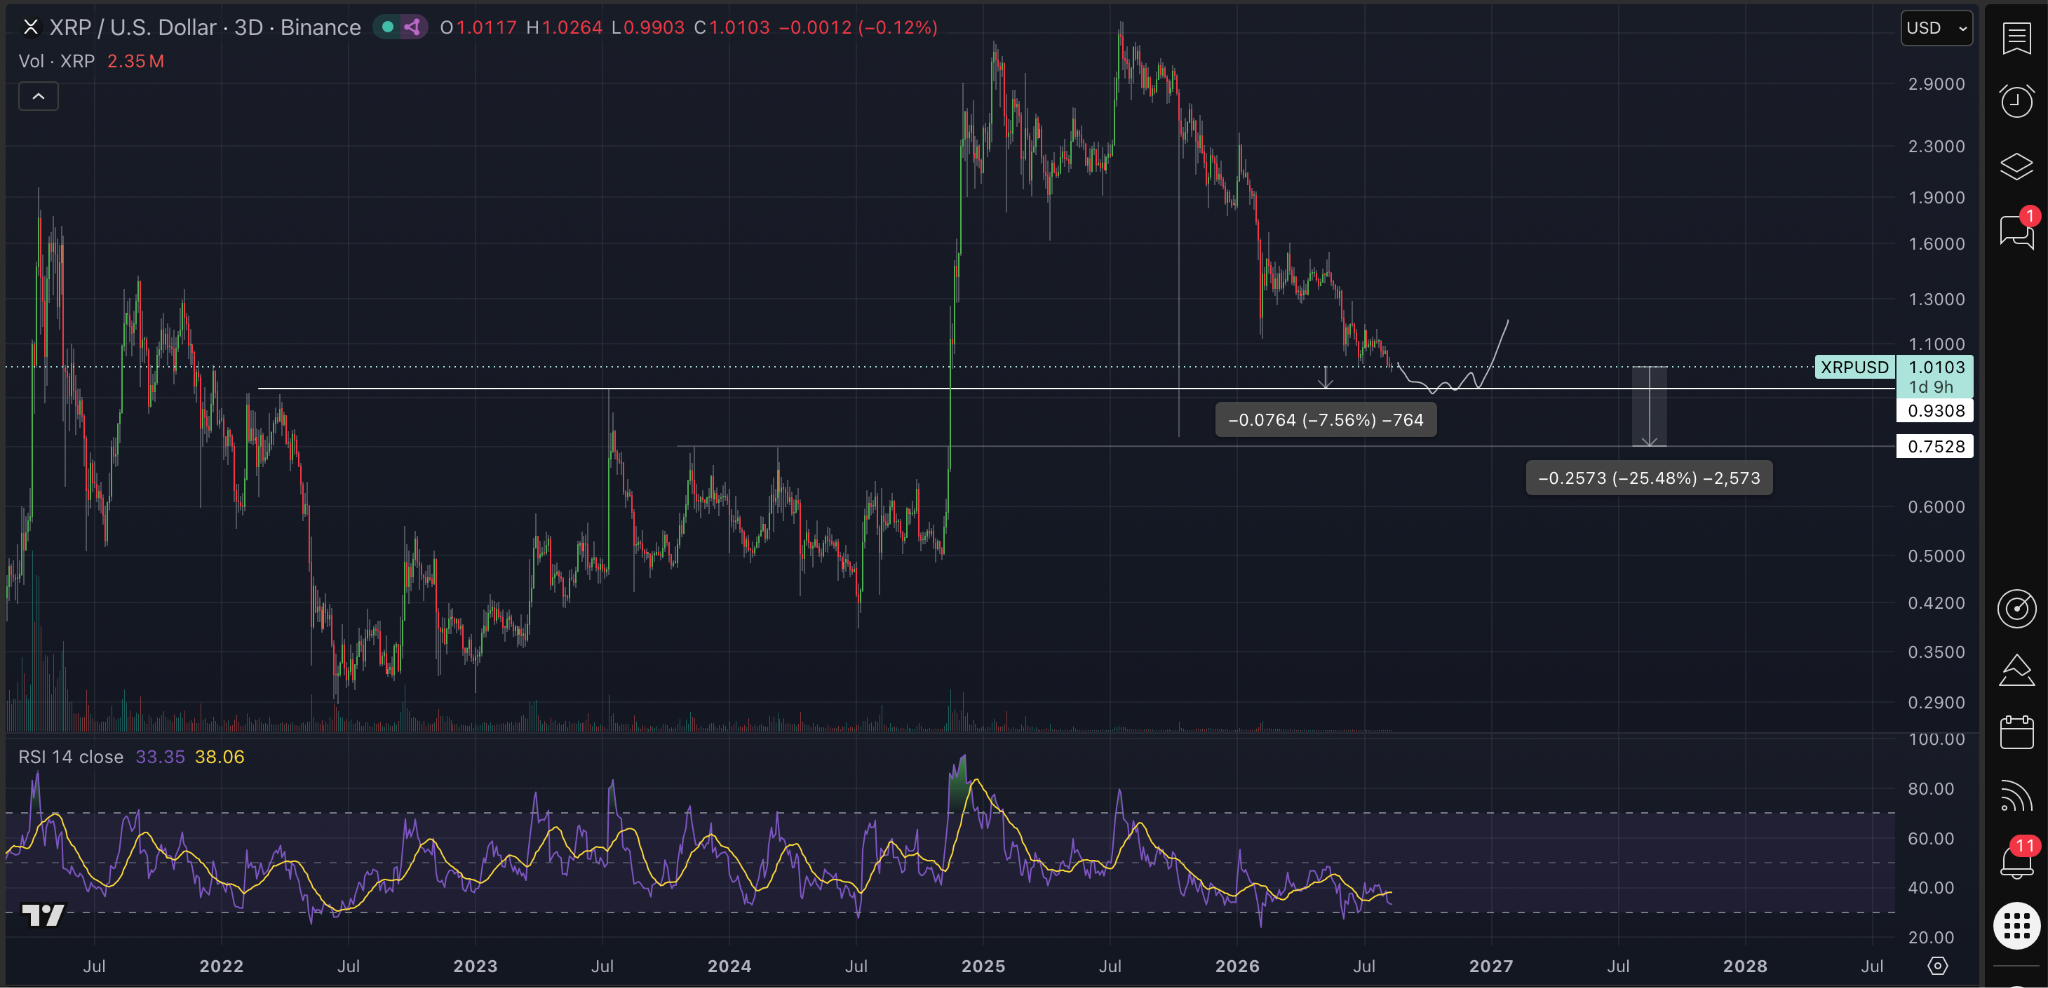
The first area that I’ve got to look at is around 7.5% below us, which is, again, where the low timeframe liquidity targets sit. That’s where Judge Torres ruled XRP to not be a security. It’s the resistance that we found there, and it’s also the resistance that we found before our capitulation event into the 2022 bear market.
This is my first area to bid, and if you bid with low leverage or buy in spot, I think that’s a decent place.
There is obviously also the chance that we have a lower flush than this. The next area of support below that is roughly 25% away, and there are further areas of support which could be found at about a 35% drawdown from where we are.
So, $0.75 would be the 25% drawdown, and $0.93 ish would be the 7% drawdown.
Now, when liquidity pools get taken, they often push a little bit further down than where the liquidity actually is, based on liquidity pools being contracts that force actions on the market. So when, for example, long positions are stopped out, as they would be if the liquidity is below us, that makes people sell on the market, which can push the price down a little bit further than where the liquidity is.
So I think the most likely possibilities from here are a drawdown to around $0.93, potentially wicking just below that to stop people out who are trying to long there or have their stop losses just below that level. My target has been between $0.88 and $0.925 for that reason.
To sweep all the daily liquidity, it’s a drawdown to about $0.75, and what I would consider the worst case scenario is a drawdown to the $0.66 level.
Do I think we have significantly lower to go? I think it’s possible. Do I want to take the chance that I could miss that and not get any of my positions filled? No, I don’t want to take that chance.
Because as we start to go lower, the probability of us continuing to the downside below these targets becomes less and less, in my opinion, and I want to get my bags filled when possible.
Now that we’ve broken down some of the technicals on the XRP chart specifically, we’re going to have to look around at some other charts. And unfortunately, this is going to be the section that is the ugly.
The first discussion I’m going to have here is XRP against Ethereum. If we look at previous cycles, Bitcoin normally leads from the lows and altcoins follow. Whether this cycle is going to be exactly the same, I don’t know. But you have to expect that something along those lines is probably going to occur.
Can all cryptos move up at the same time? Yes. But normally, Bitcoin either outperforms or altcoins outperform.
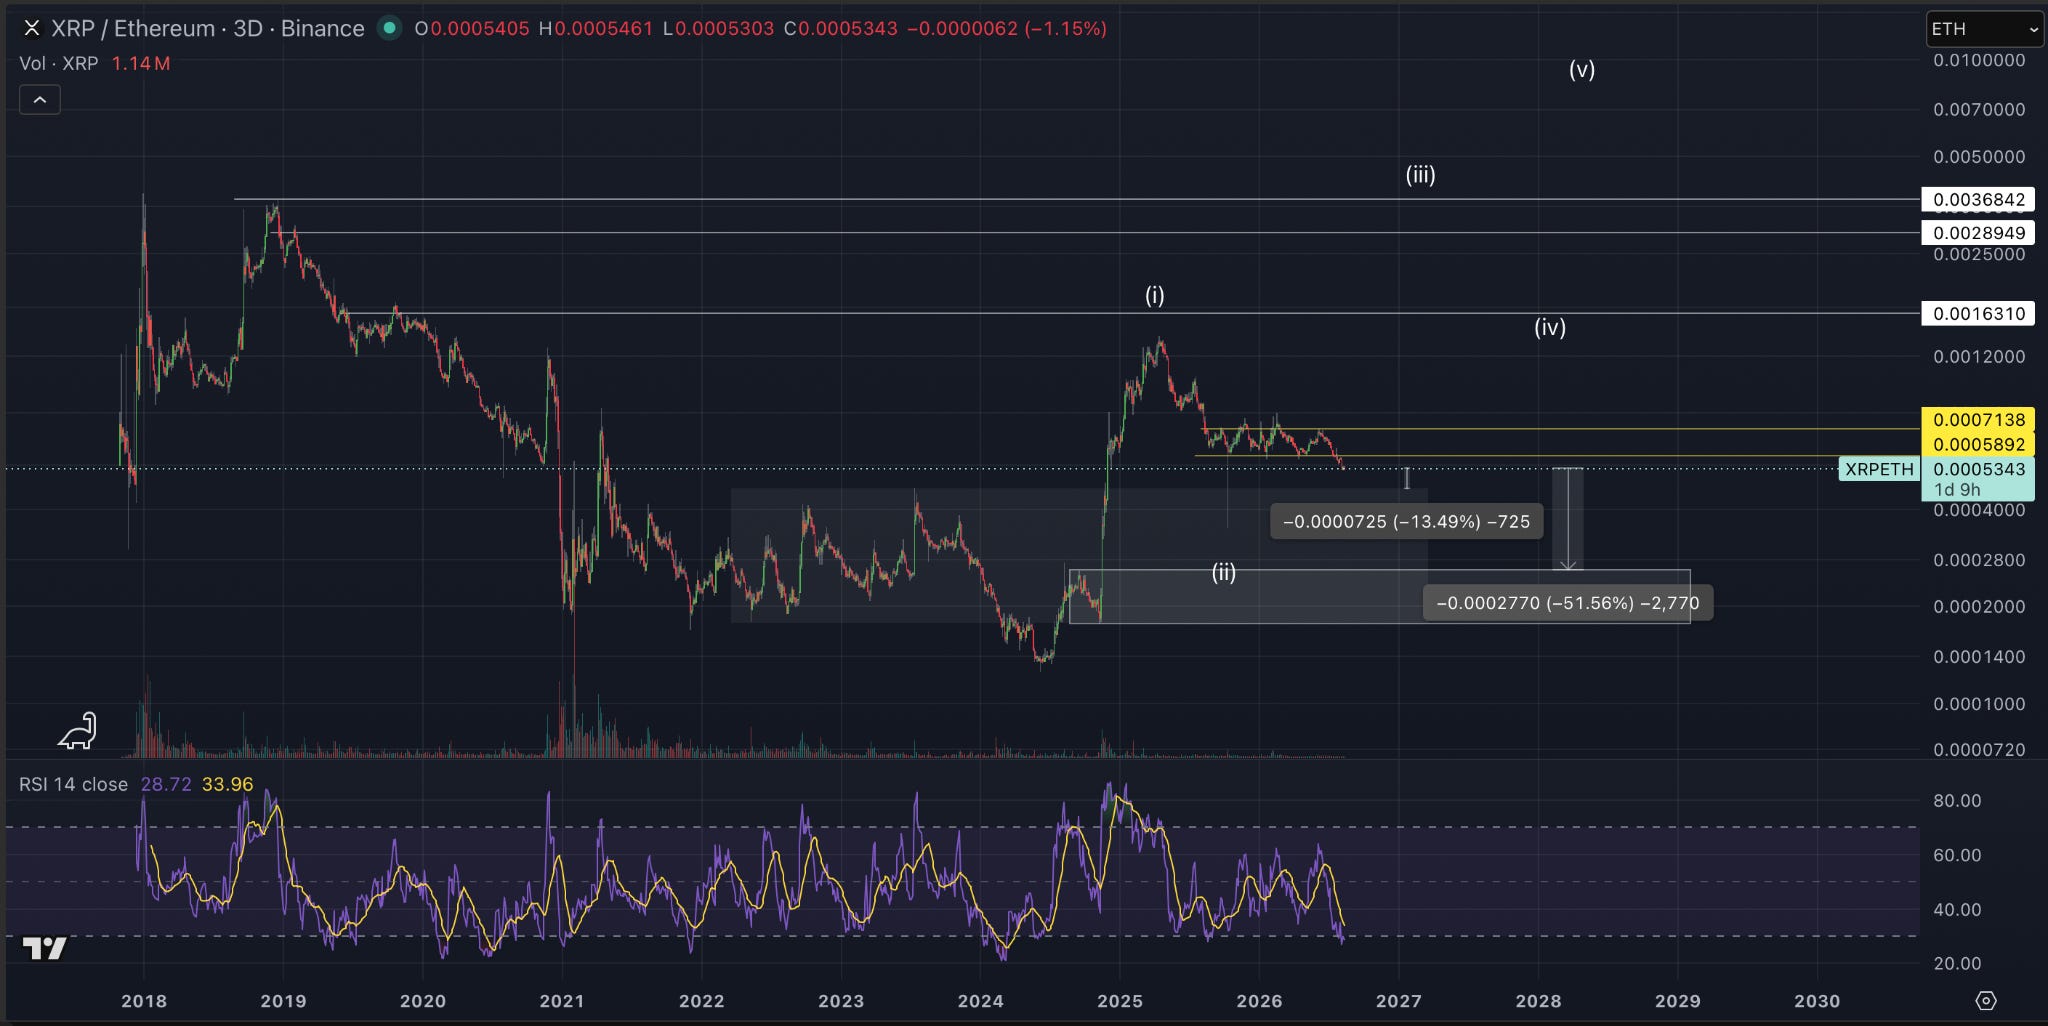
We’re going to start with ETH because I think XRP against ETH is a very interesting chart. As I’ve just discussed, I think there could be some drawdown for XRP. I also think that XRP against ETH could depreciate by 13% to the first major area of support.
Then there’s a discussion as to whether we could depreciate 49%, basically making a higher low, but closing a lot of the fair value gaps that are below us and potentially touching the order block prior to expansion for XRP against ETH.
I think both of those targets are possible.
What that means in terms of price action for XRP, again, I don’t know for sure. ETH could simply outperform to the upside and start to push harder while XRP lags. This could also be sentimental capitulation that causes XRP’s price to deteriorate. XRP might go sideways while ETH goes up 50%, or it could be any combination of ETH appreciating and XRP depreciating.
If ETH goes up 25% and XRP comes down 25%, that’s roughly a 50% difference.
So that’s what I’d be looking for with XRP against ETH.
And we’re going to get into the good at the end, I promise, and we will talk about ETH and XRP as well. As you can see, I don’t think this is the end. It’s just what I’m looking for over the short to medium term.
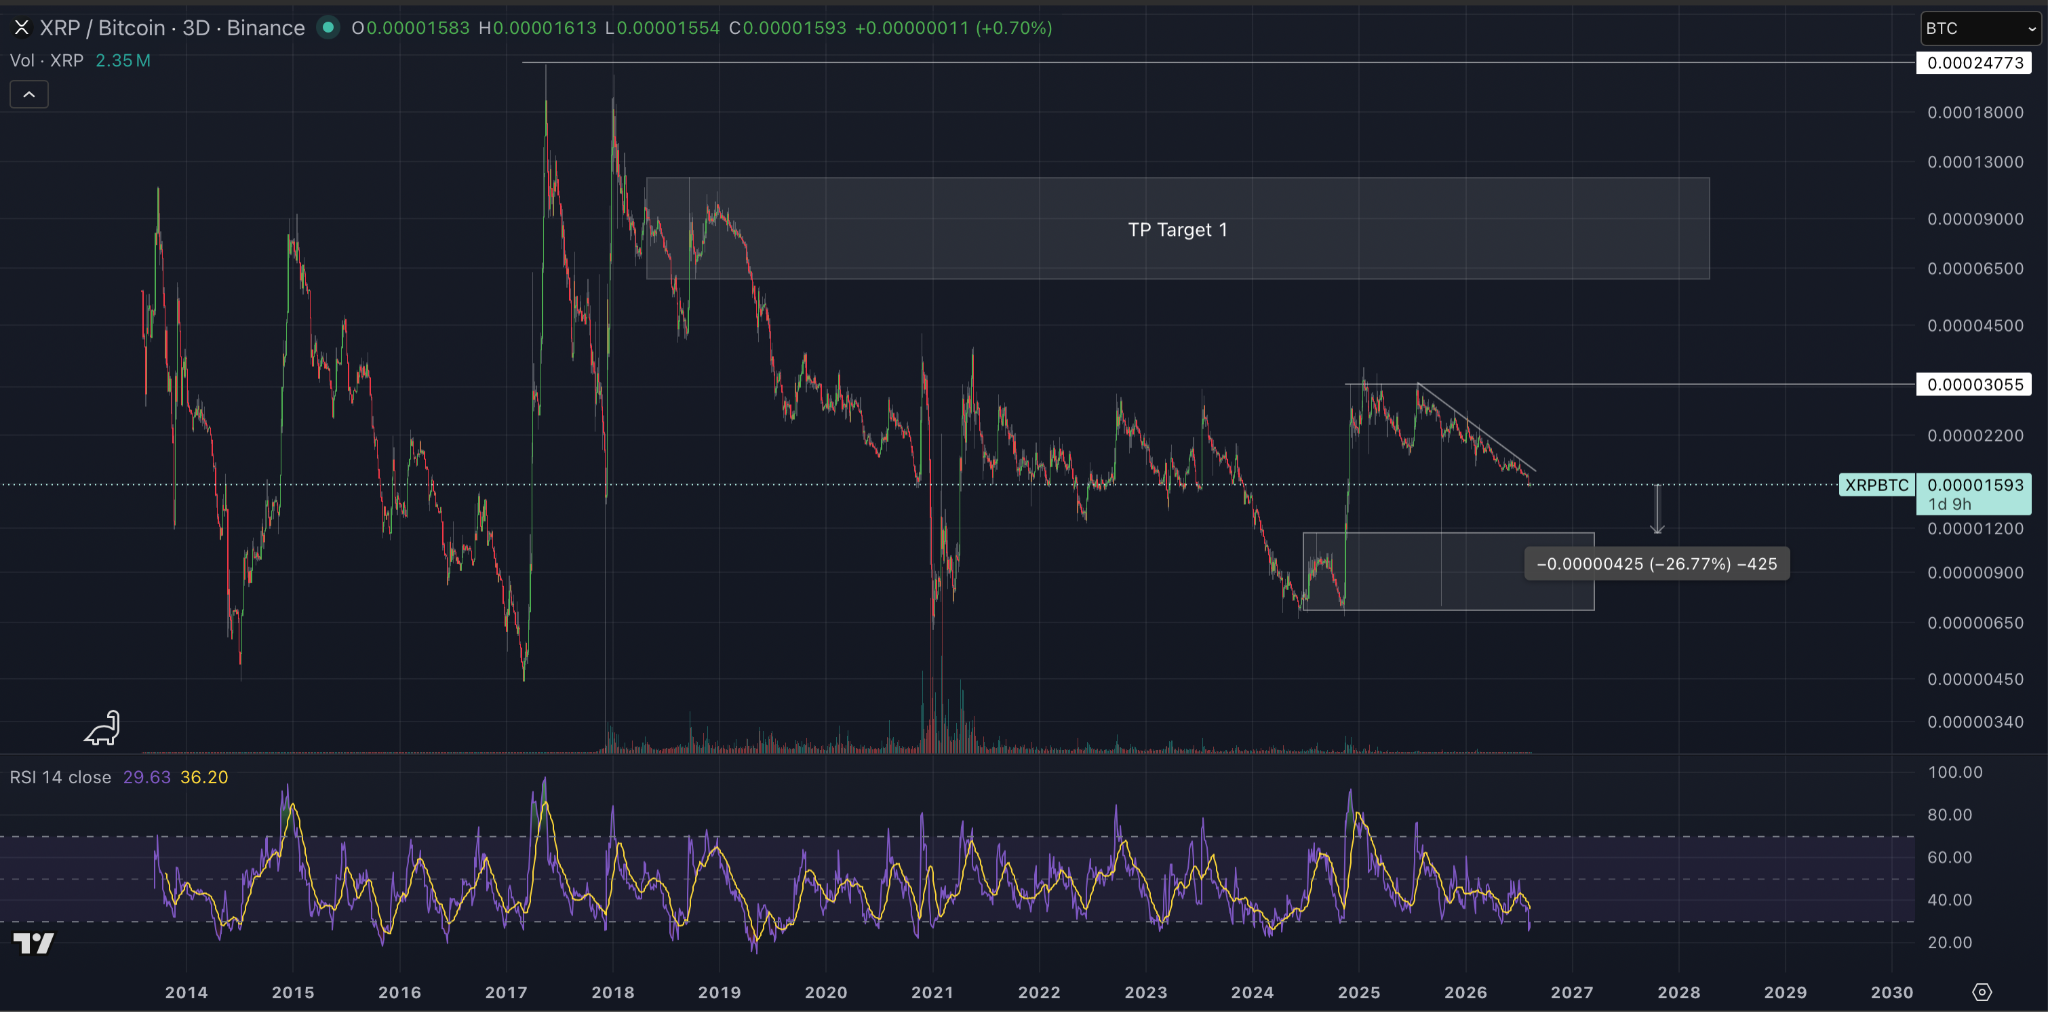
Next up, let’s look at XRP against Bitcoin. Now, there’s a solid argument to say that XRP against Bitcoin could come down around 26%, again, to touch that order block prior to expansion.
People might argue it comes all the way down to the 0.00001 ish level, which would be about a 37% loss against Bitcoin. I think around 26% here makes sense.
If you look slightly to the left of your screen, you can see that from roughly this area, XRP has previously bounced back up to its local highs around the 0.00003 level and then found resistance there. It’s been a key resistance level since around 2019 to 2020.
So there looks to be at least a small amount, if not roughly 25%, depreciation versus Bitcoin to be had here.
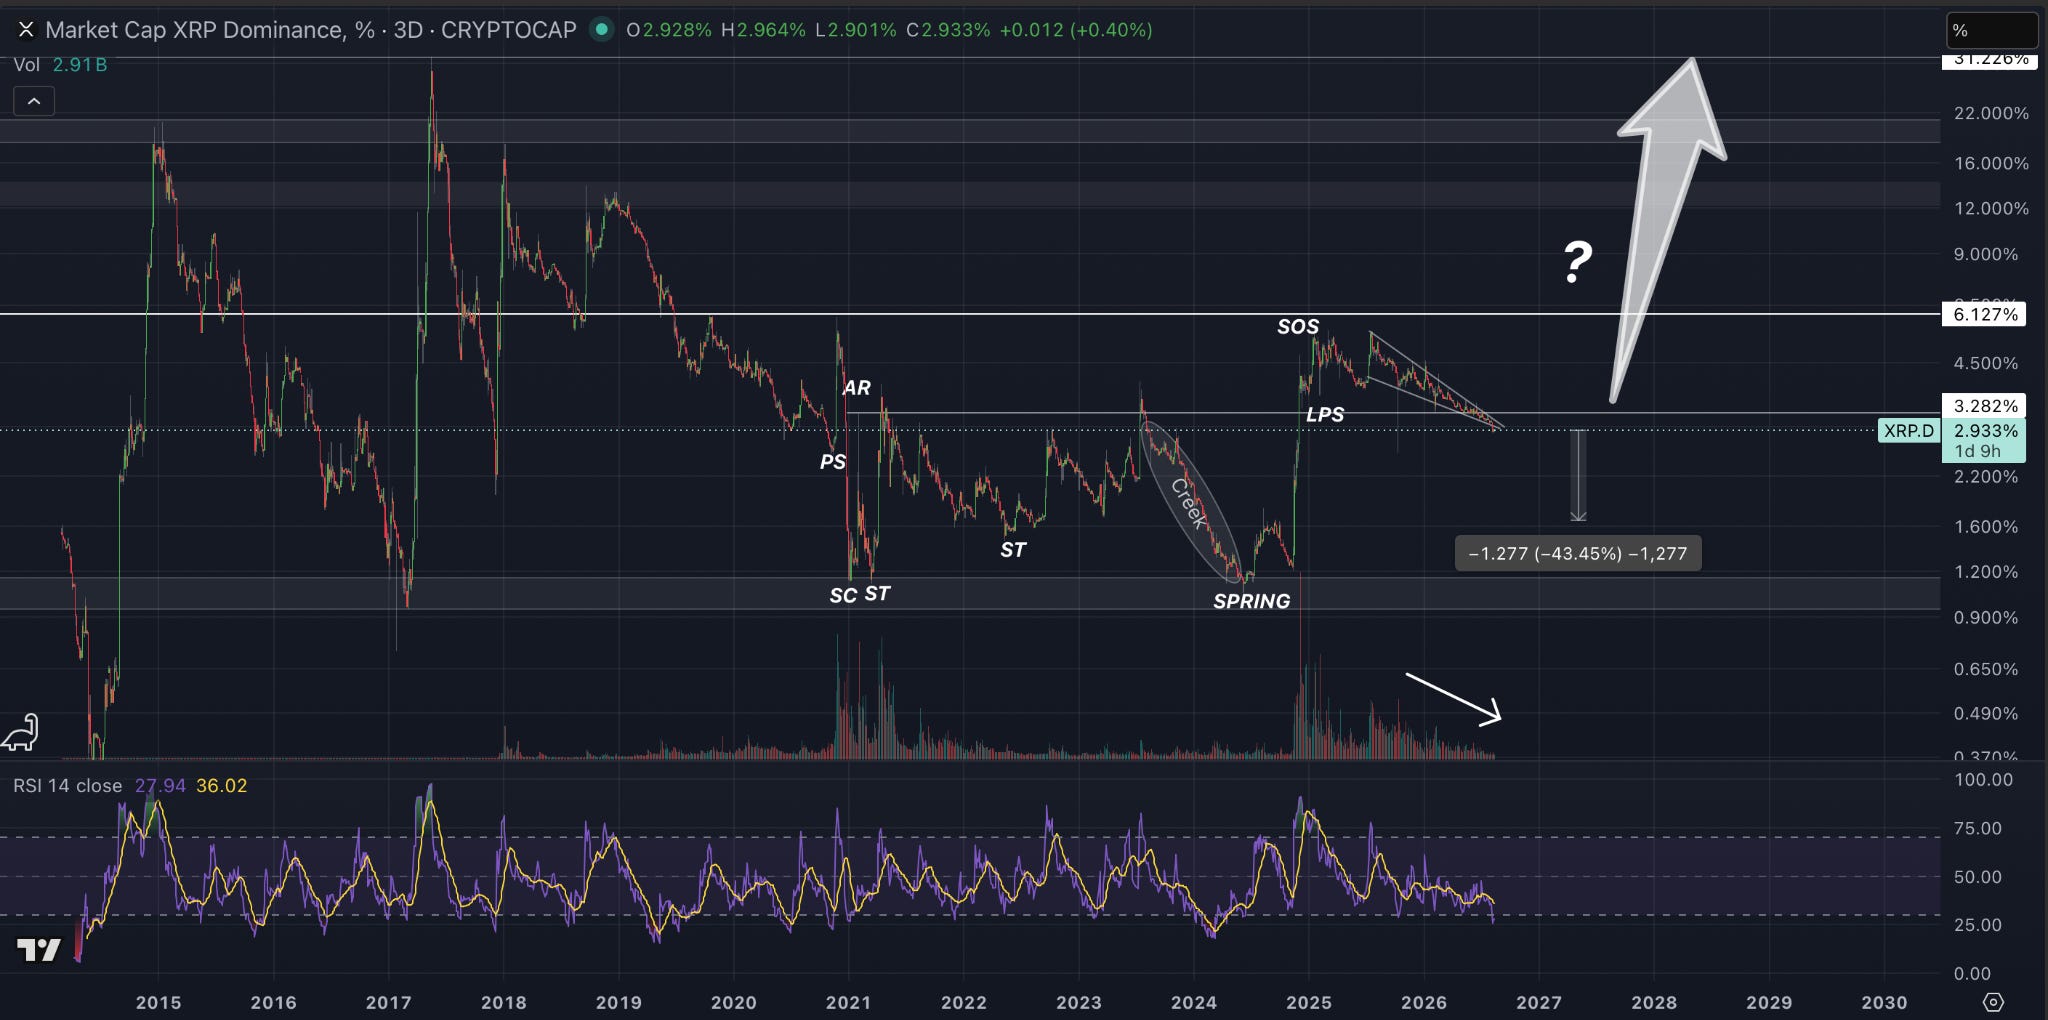
Here we have XRP dominance, which, in my opinion, is looking a little bit different. I’ve been trying to argue that XRP dominance may have completed a Wyckoff accumulation bottoming pattern for a while.
After this, we’ve been in what I would call a bull flag pattern, a descending wedge consolidation pattern that we recently broke to the downside of. Now, these can fake to the downside and reverse. If it was going to do that, it would be somewhere around this level where I would expect it to reverse.
As you can see, there’s likely some support and previous resistance from our August and October highs within the range of the Wyckoff accumulation.
We also have diminishing volume here on XRP dominance as price has been falling, with no real reprieve rally.
Now, there is also an argument to say this could collapse 43% from here, close some of those fair value gaps, etc., as we’ve discussed before. Whether that happens or not, I don’t know. Again, this would give us a target of around 1.6% dominance if that were to happen.
And I will touch back on all of these charts in the good section, as you can see there are some positive drawings on this chart as well.
Finally, I want to look at open interest. What we can see is that over the last few weeks, we’ve seen an addition in open interest, roughly between $400 and $500 million worth if you measure from the lows in open interest.
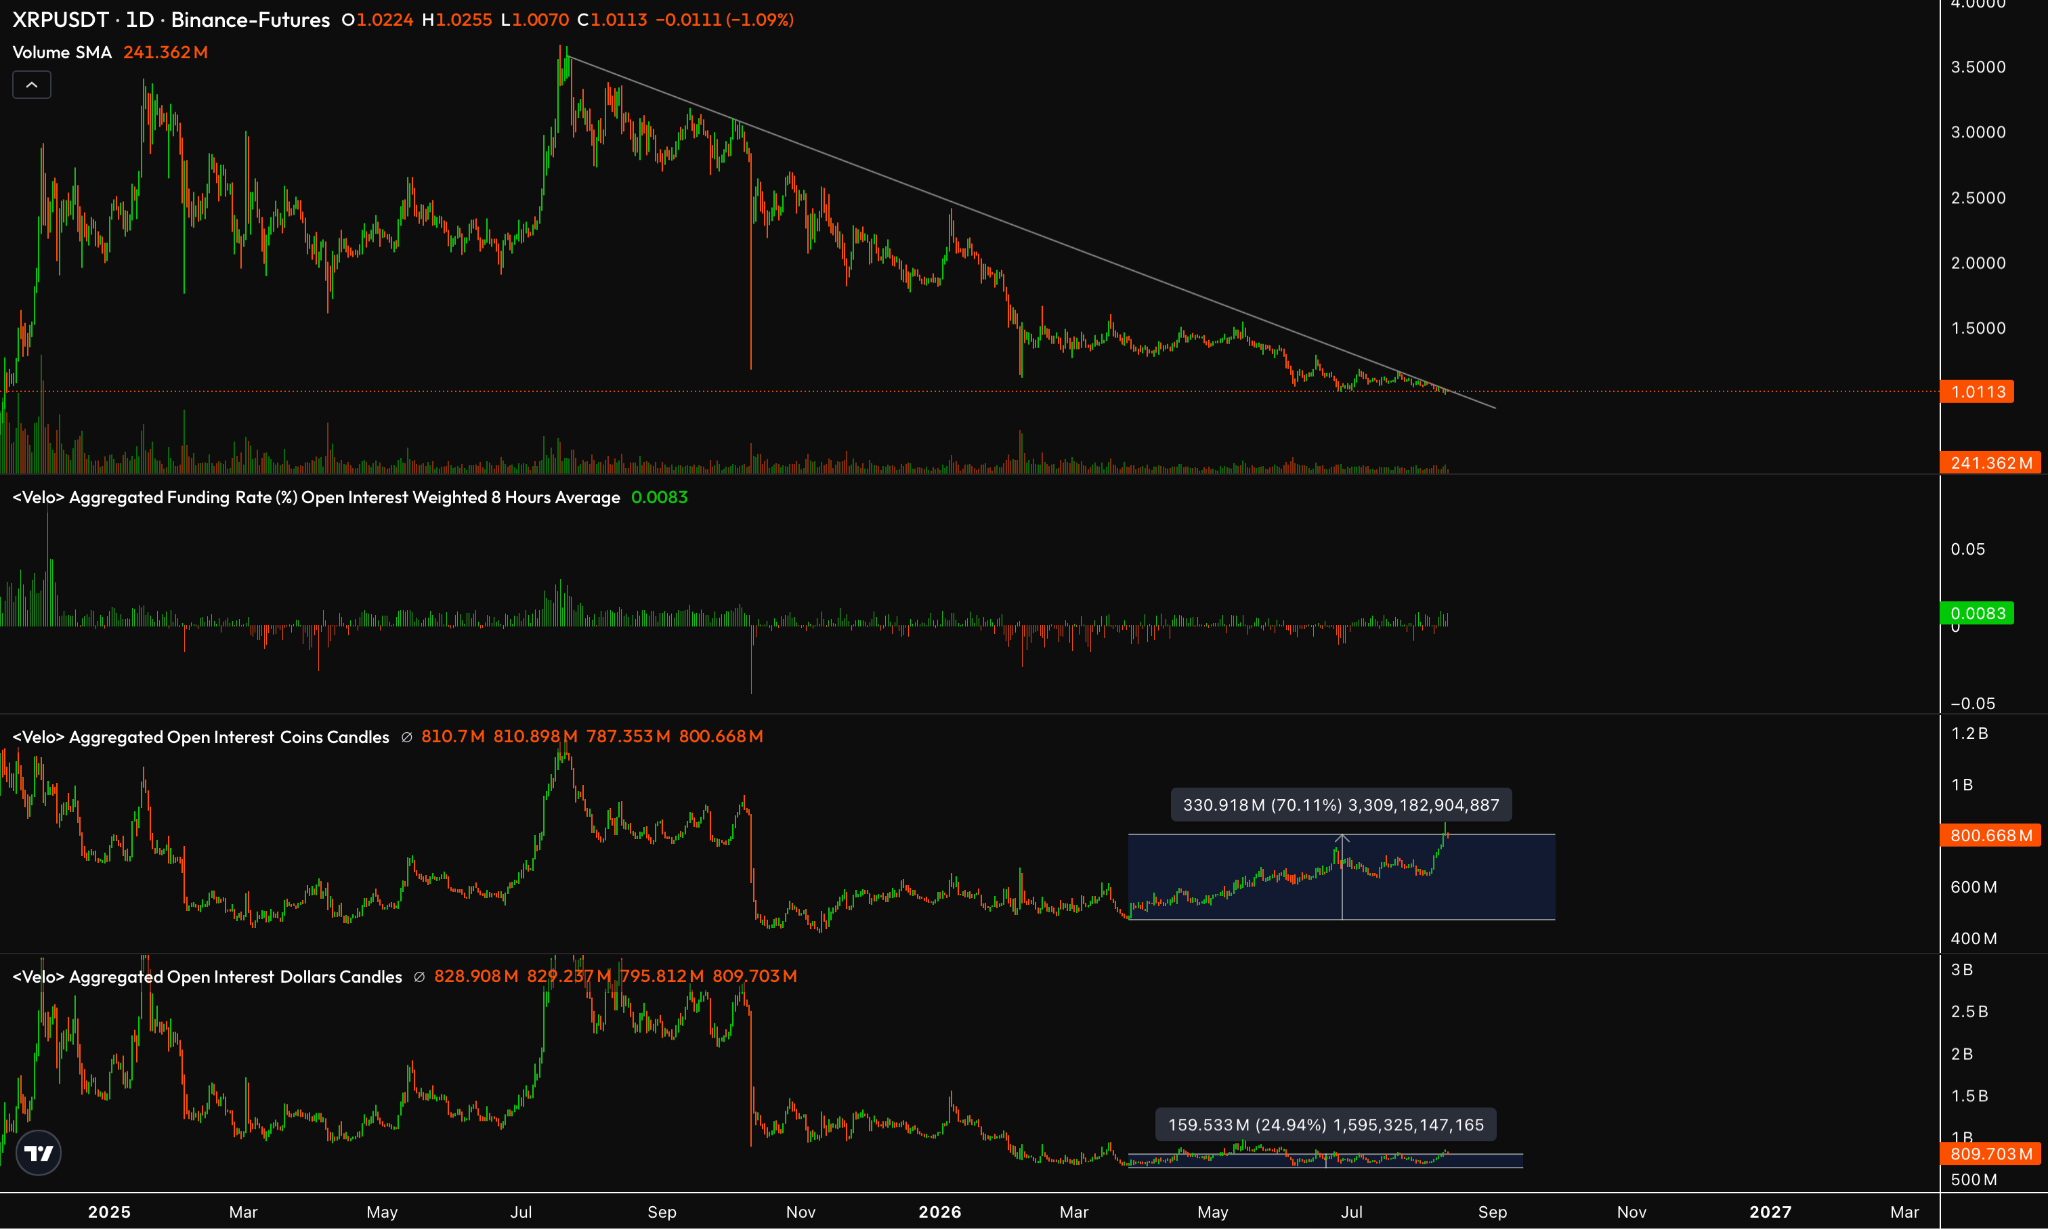
Does this tell us which direction that open interest has been added? No. But if we add funding rates on top of that, we can suggest which direction may have had more open interest added on that day. Red days on funding are more likely to have had shorts added, and green days on funding are more likely to have had longs added.
This can lead to cascading or reflexive price action. When price moves down, longs get stopped out, which makes people net sellers, which then moves price down further, etc. And the reverse applies to the upside.
This, I think, adds a bit of confluence to the liquidity pools that we’ve been showing. They’re likely the key levels and key areas where people are going to be stopped out.
This is why support and resistance are so important, and why liquidity is so important. These can lead to liquidation events, but on the flip side, they can also lead to expansionary events in crypto, or liquidation events to the upside that lead into expansionary phases.
Here we can get on to the good part.
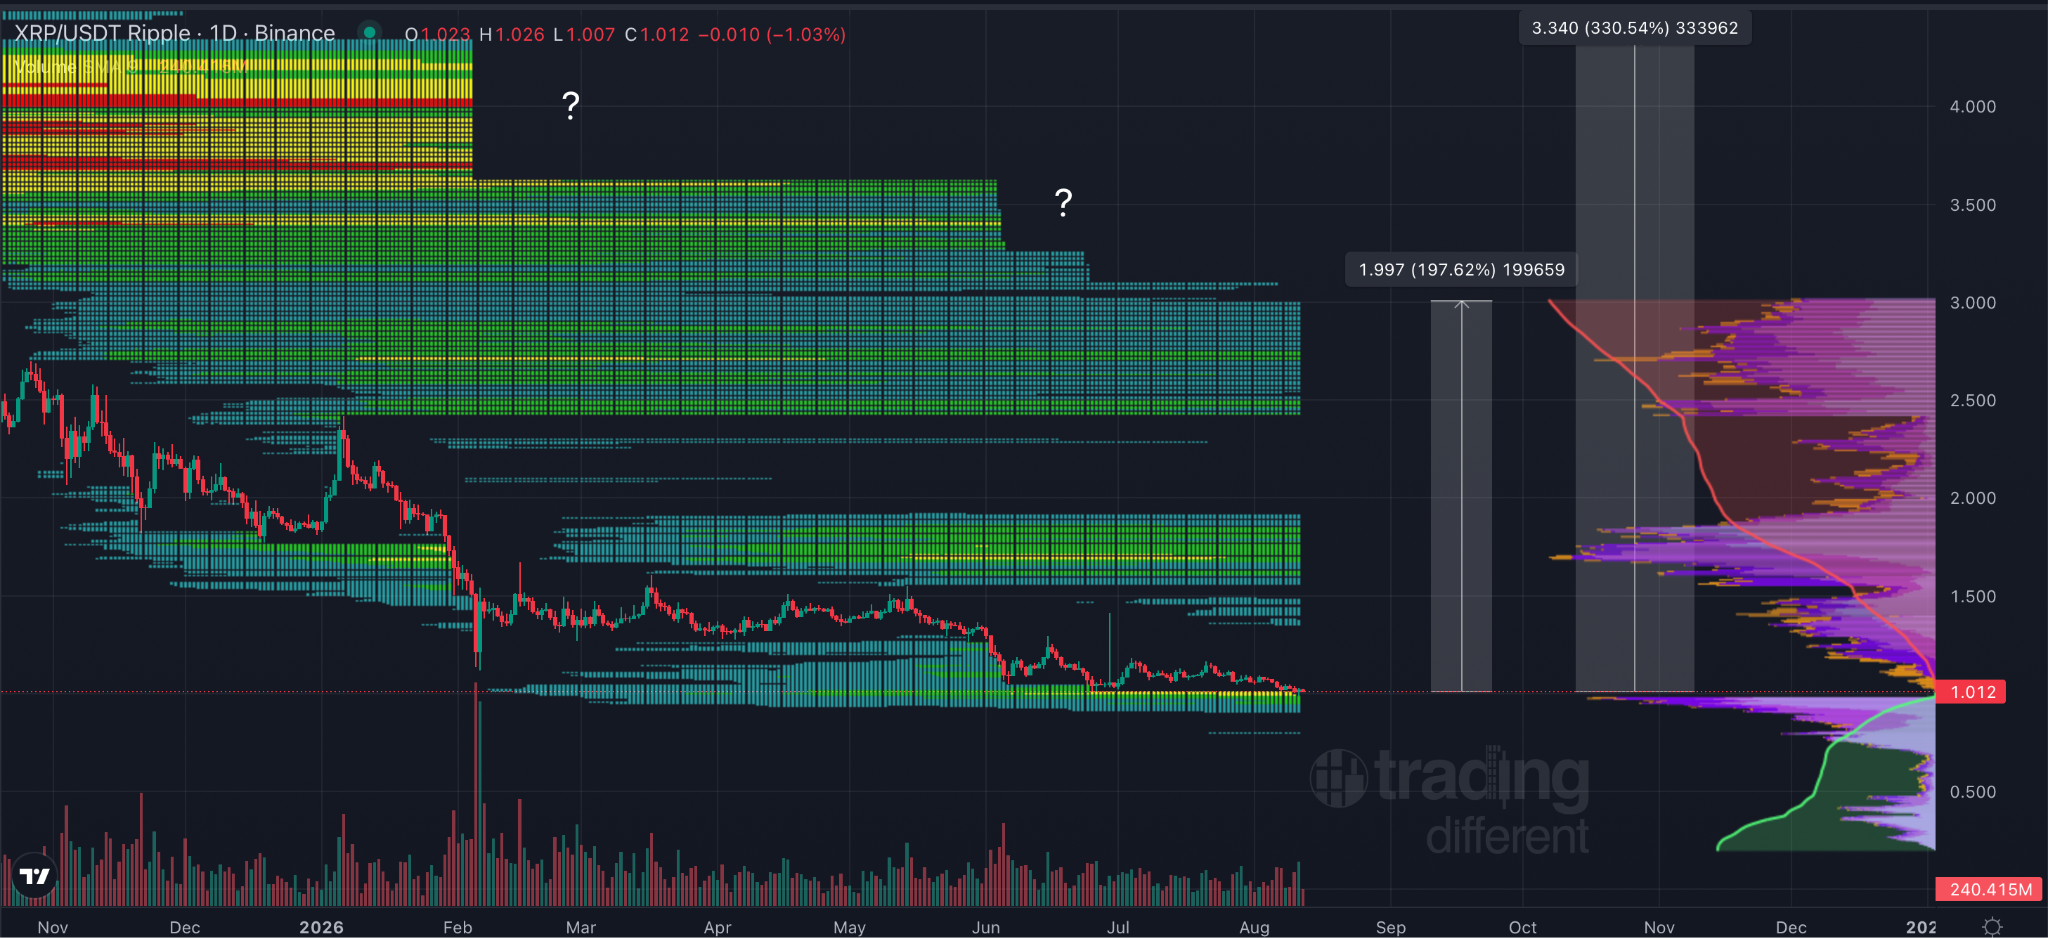
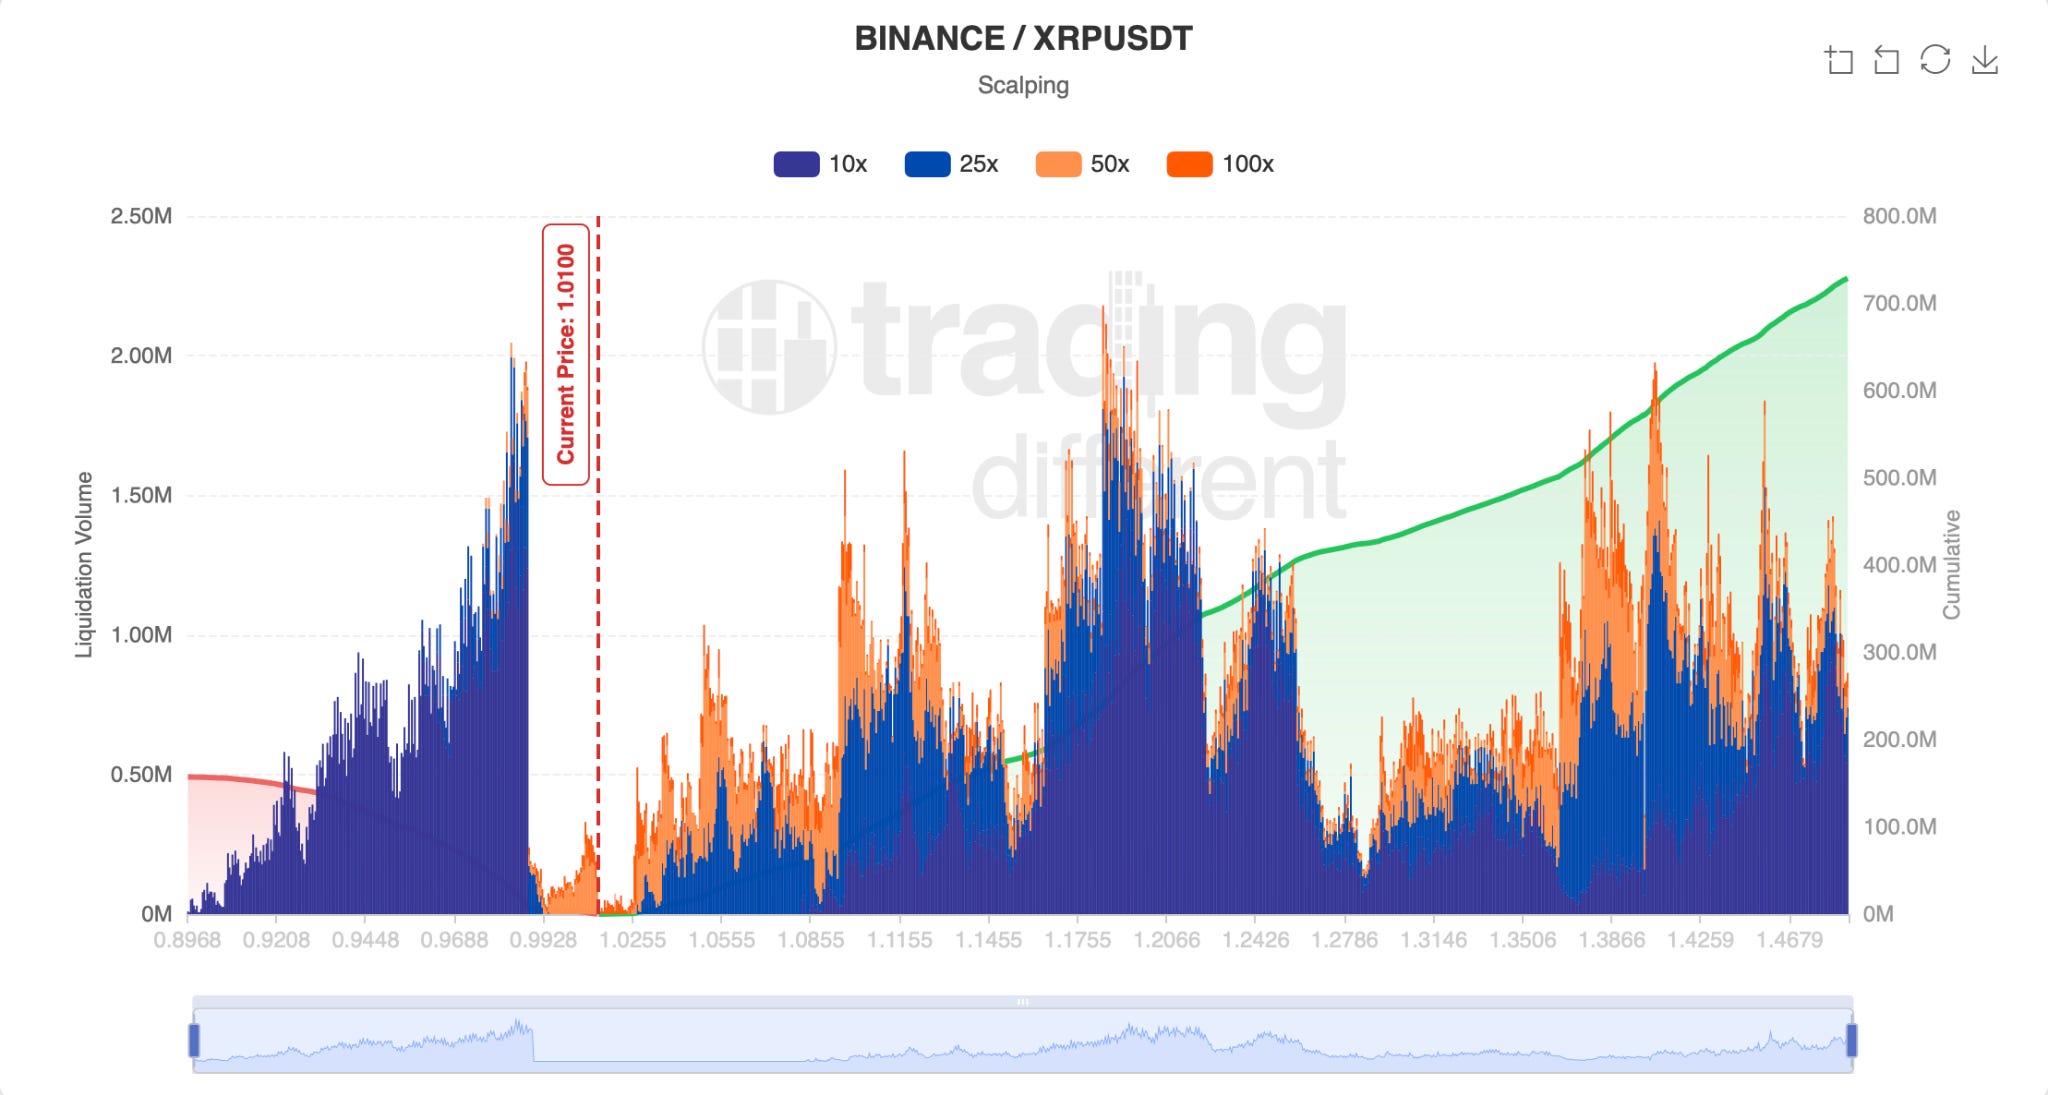
First off, let’s use liquidity. From the levels that we are right now, I’m not even discussing whether we take the liquidity below us. Just to take the liquidity above us, we would need to see at least a 197% gain in XRP. There’s also the potential for liquidity to take us all the way to a 330% gain.
I’m not sure if this is an API glitch or whether that liquidity has been removed, which is why there are question marks there.
So that’s the first section of the good. This is why I keep saying, if we take the downside liquidity, all I’m going to be doing is screaming bullish, because we’ll only have upside liquidity left, and that takes us, at a very minimum, around 200% higher than where we are right now.
And remember, whether people love it or hate it, liquidity is taken around 80% of the time.
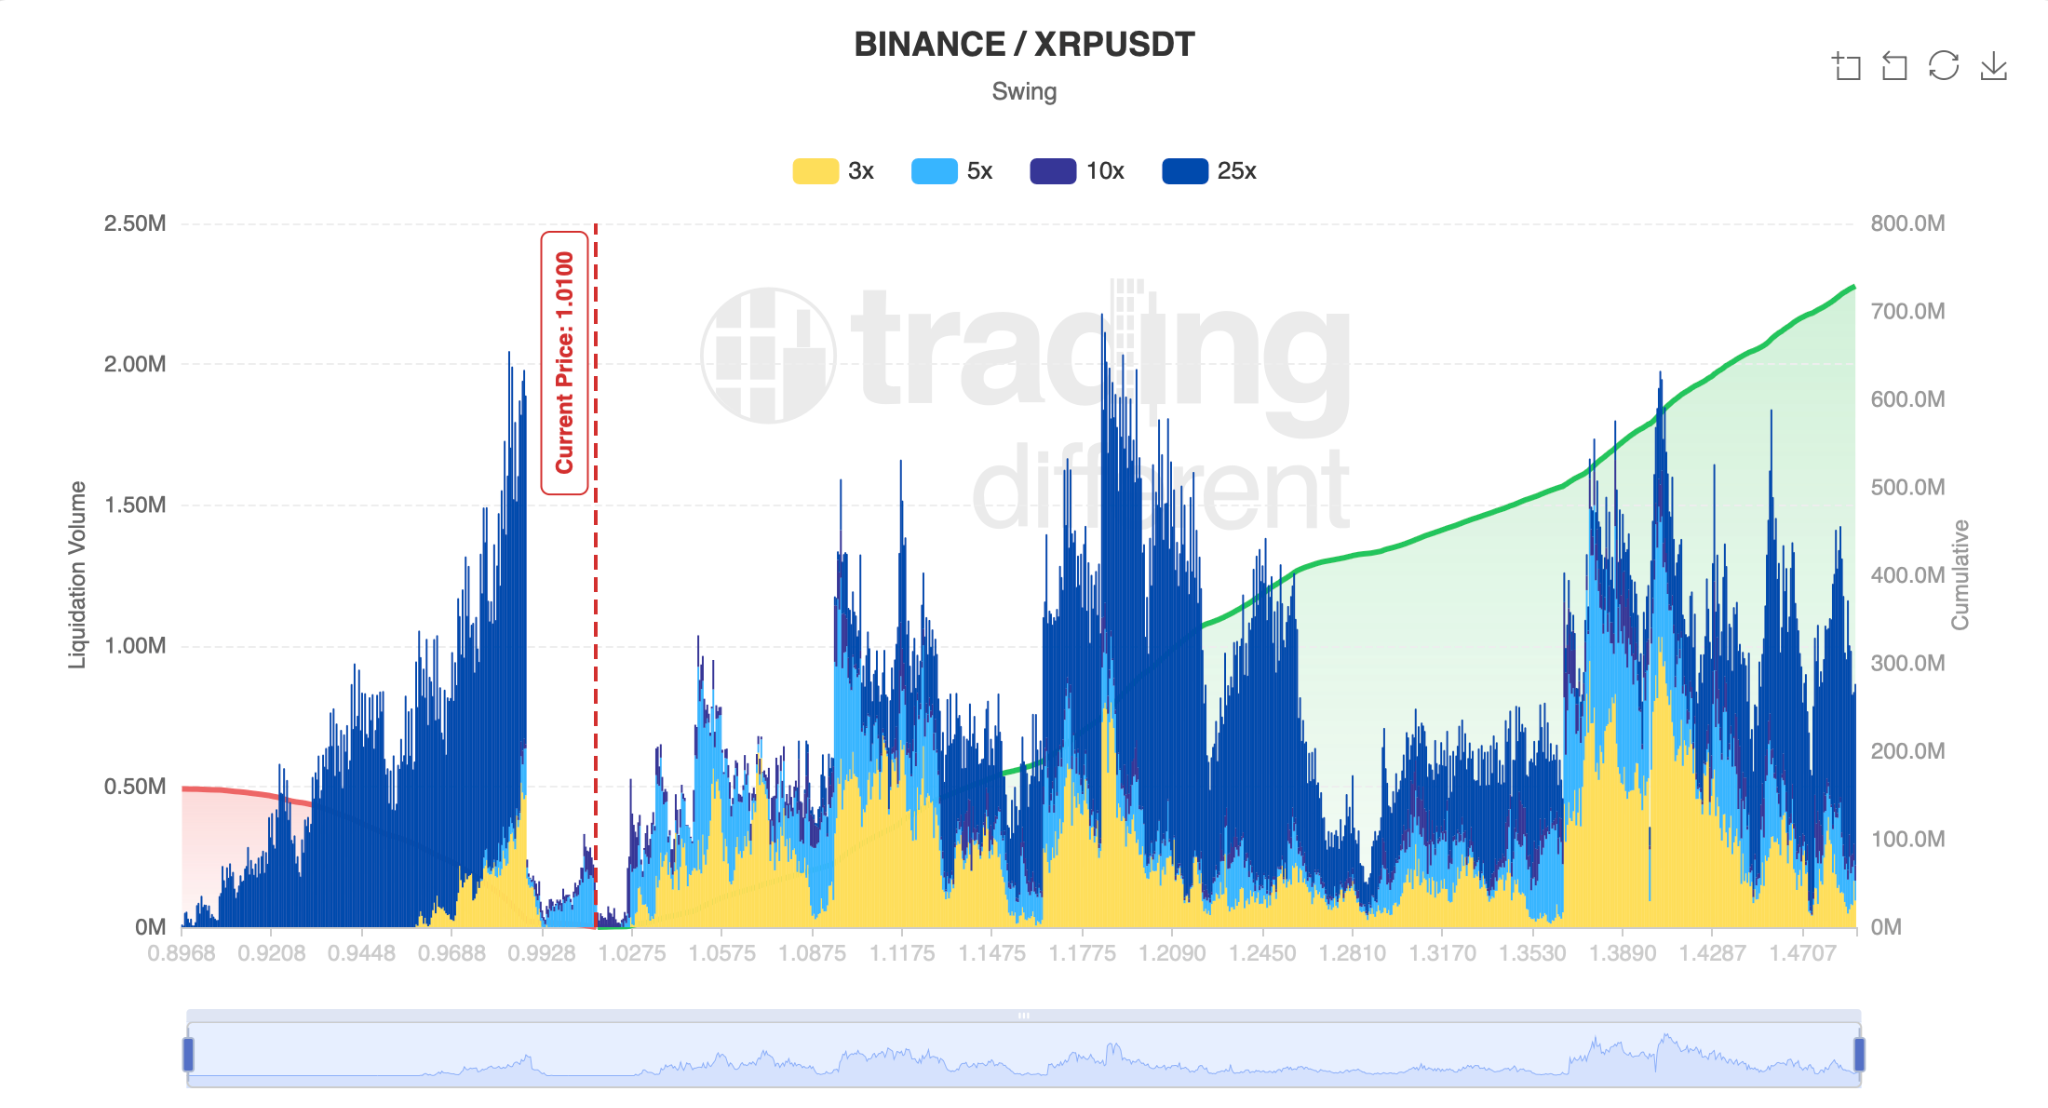
Using the simple heatmap we can see that we’d liquidate roughly 727m in leveraged XRP shorts if XRP squeezed to $1.48.
Next, if you’re a follower of my channel, you’ll know that I use the RSI a lot. I really like the RSI as an indicator.
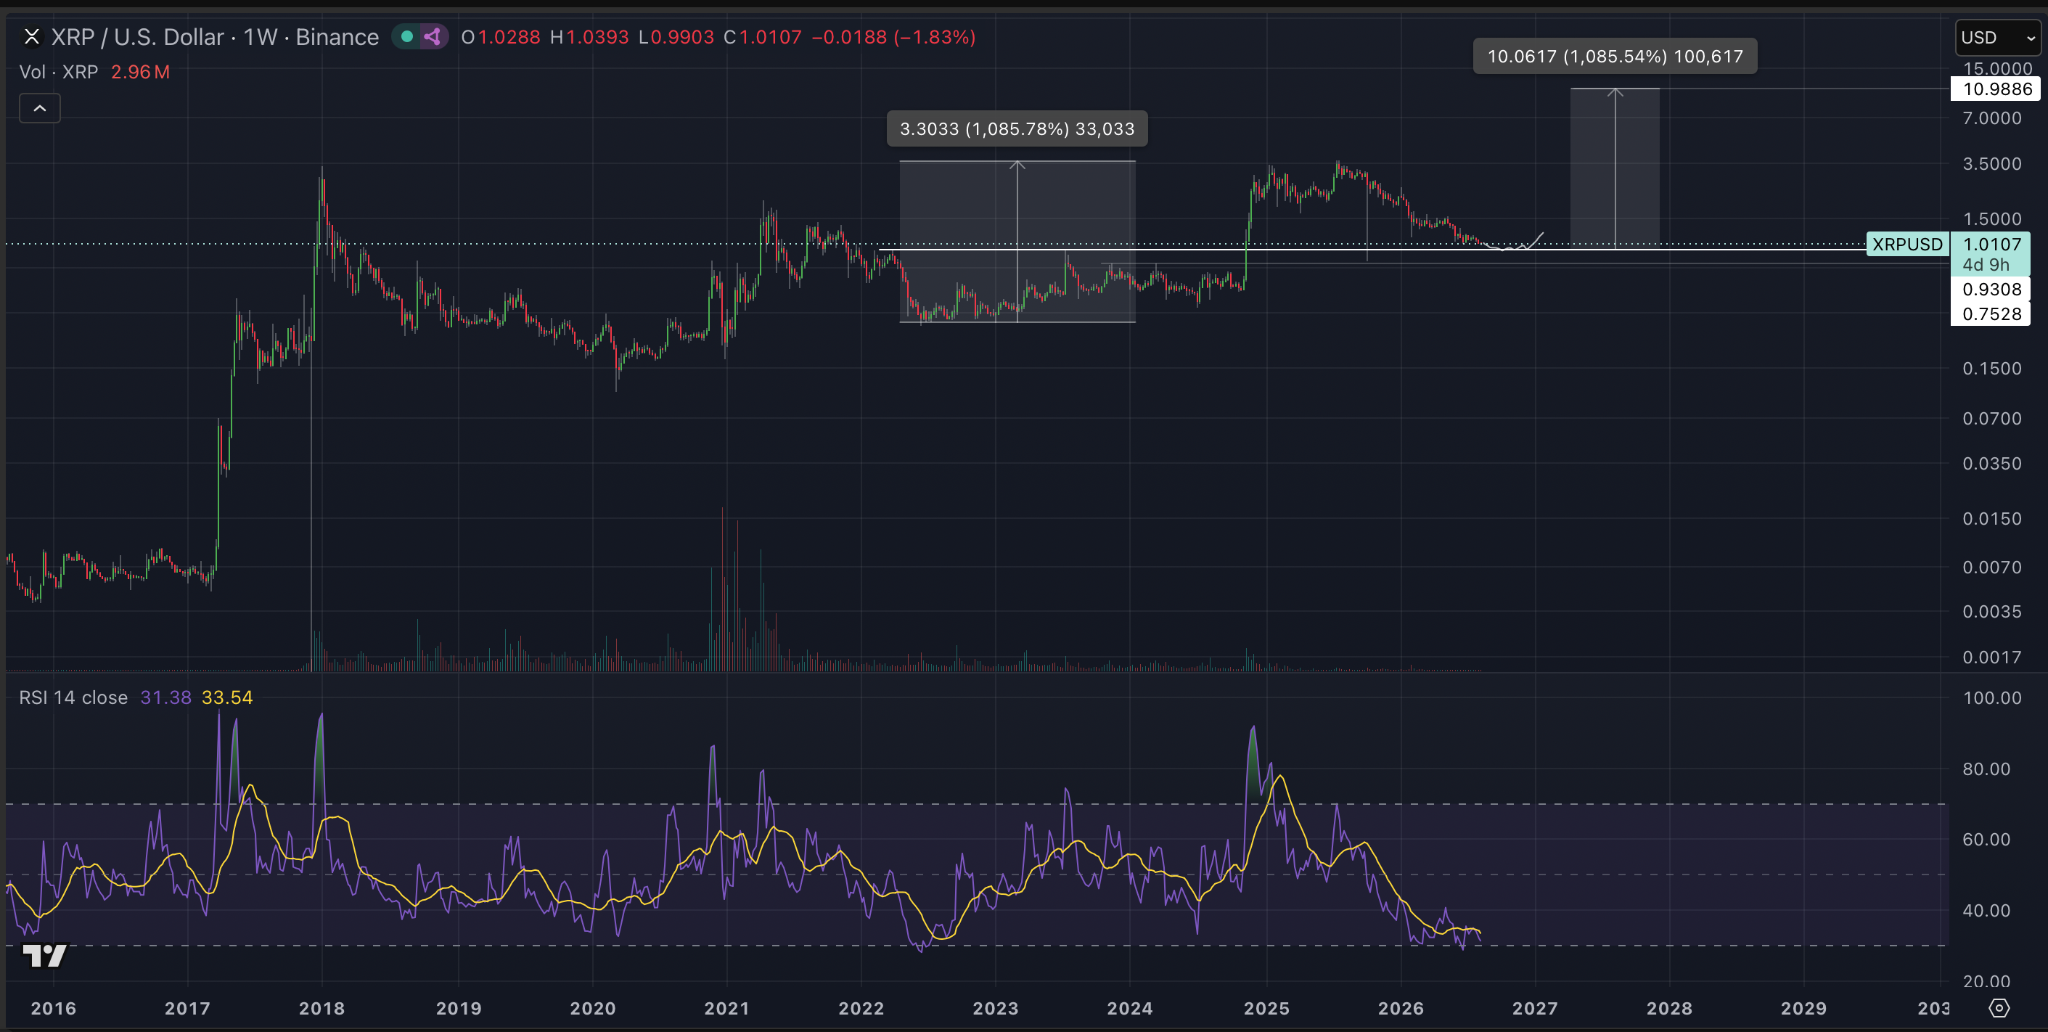
If we look at XRP on the weekly timeframe, what we can see is that XRP’s weekly RSI a few weeks ago dipped into the oversold area for only the second period in XRP’s history.
If we take the last time XRP’s weekly RSI touched the oversold area and measure from there to our local high, it was about a 1,085% gain. If we were to do something like that again, that would bring us out to roughly $11.
Now, I’m not saying this is definitely going to happen. I’m just showing you the relative strength of the move compared to the last time we were in this sort of area and the expansion that followed.
What I think would be the perfect outcome in this position, and the reason why I’ve left the drawings to the downside and drawn from the low in price, is because I think there is a scenario which would be perfect where we do sweep the lows again to the levels we’ve discussed above, but then make a slightly higher low on the RSI.
That would create a bullish divergence, which could act as a bit of a trampoline for price, and that would be when you can start to maybe confirm that the lows are in.
That’s what I’d be looking for. The RSI makes a higher low while price makes a lower low. Then I’ll really start to blow that bull horn, especially if we’ve taken the liquidity below us.Again, using the RSI, but this time on the monthly timeframe, what we can see is the grey box below, which highlights the area between roughly 44 and 47.5 on the RSI, has historically marked where lows have come in for price.
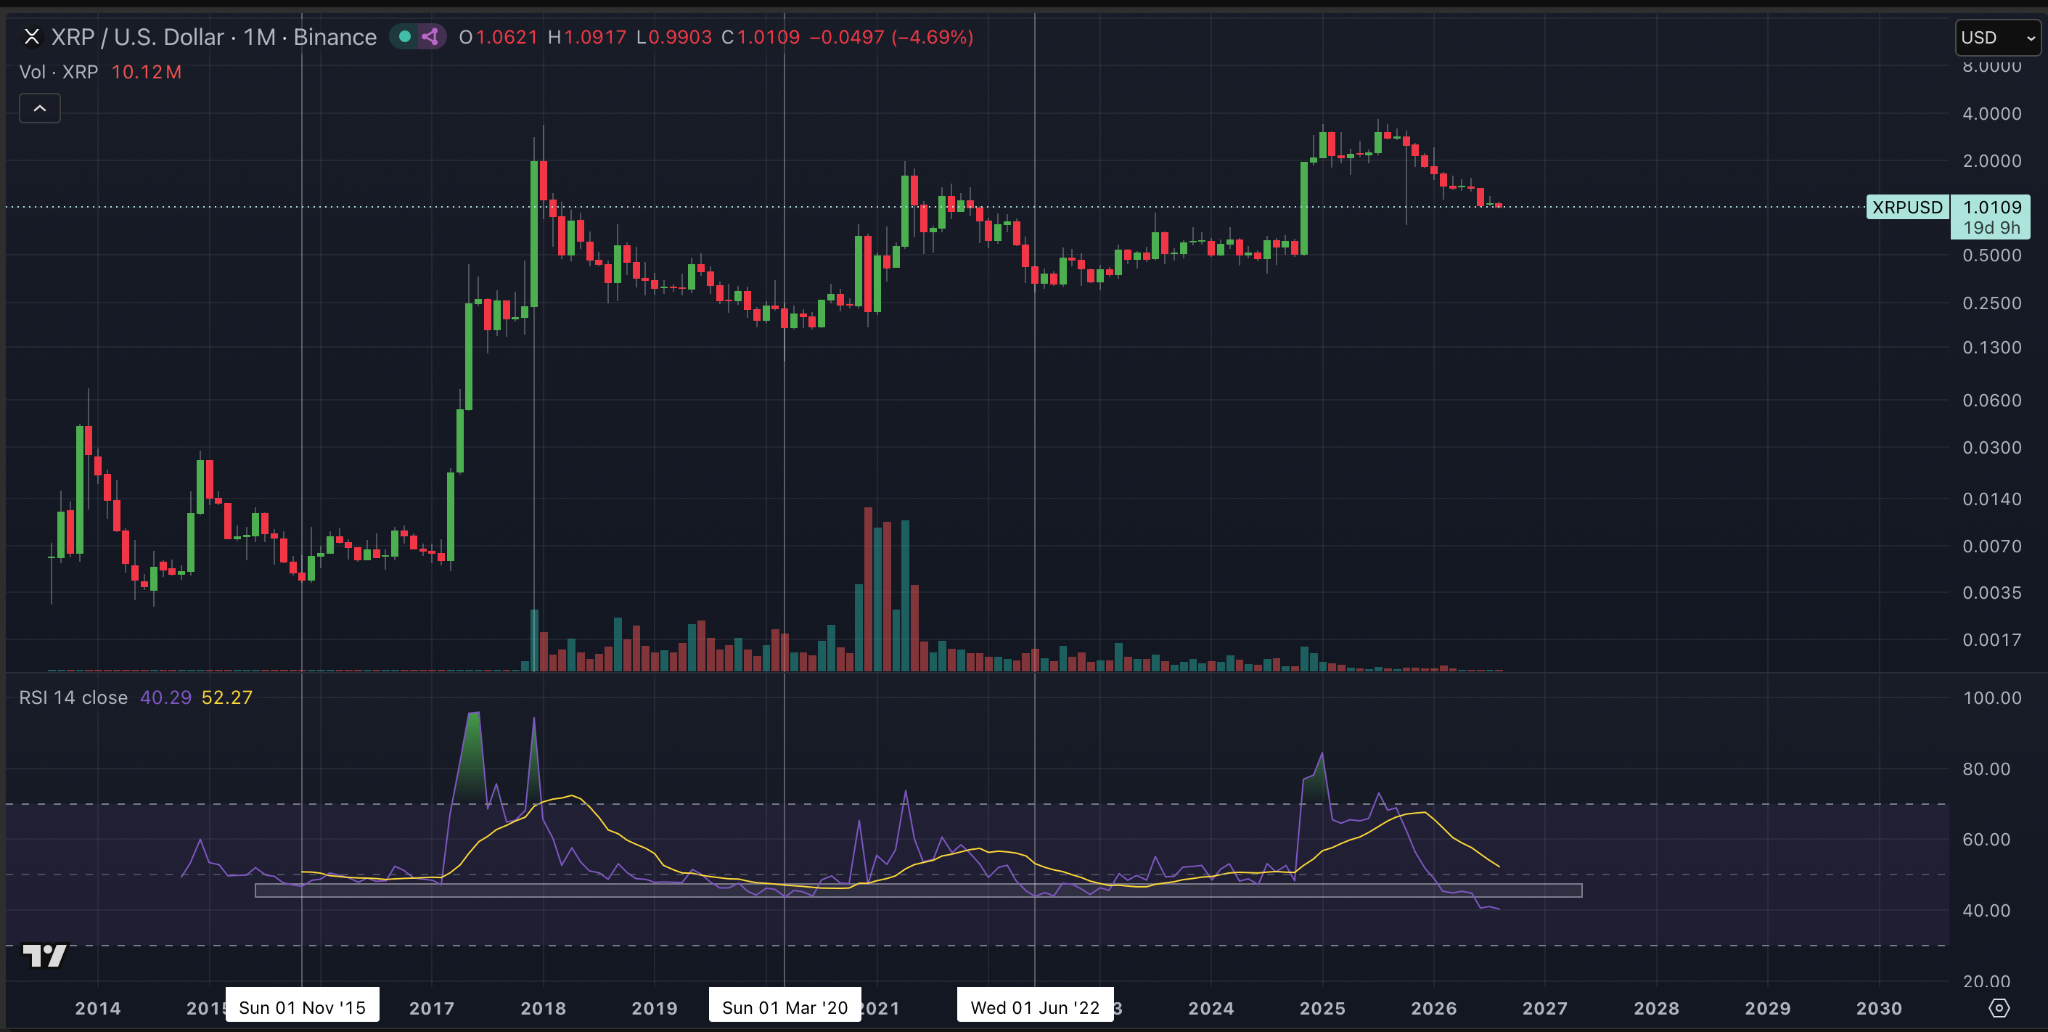
Right now, we’re actually below that. We’re at the lowest ever monthly reading for the RSI, at around 40.
Now, does this mean something’s broken? Does this mean the momentum to the downside may continue and there’s a new paradigm where XRP may not expand again? Potentially, possibly.
But for me, I view the RSI and price as a spring, and this is the deepest we’ve ever pulled that spring back while price is still up towards that $1 level.
Historically, when we found these lows, we were at around $0.32 in the last bear market. In the bear market before that, we were around $0.16. And in the bear market before that, we were around $0.004.
From there, we went into the overbought area every single time on the monthly RSI. If we were to do something similar again, the minimum gain I would expect based on history would be roughly 1,000%. The maximum gain based on history would be around 86,000%.
I think we are moving into the next leg of what I think is an Elliott Wave move, and I would expect the third wave to be the largest, as is generally expected with Elliott Wave theory. It definitely can’t be the smallest.
So, if what I’m projecting with Elliott Wave theory is correct, I would need to see a minimum move of around 600% for my wave count to remain correct.
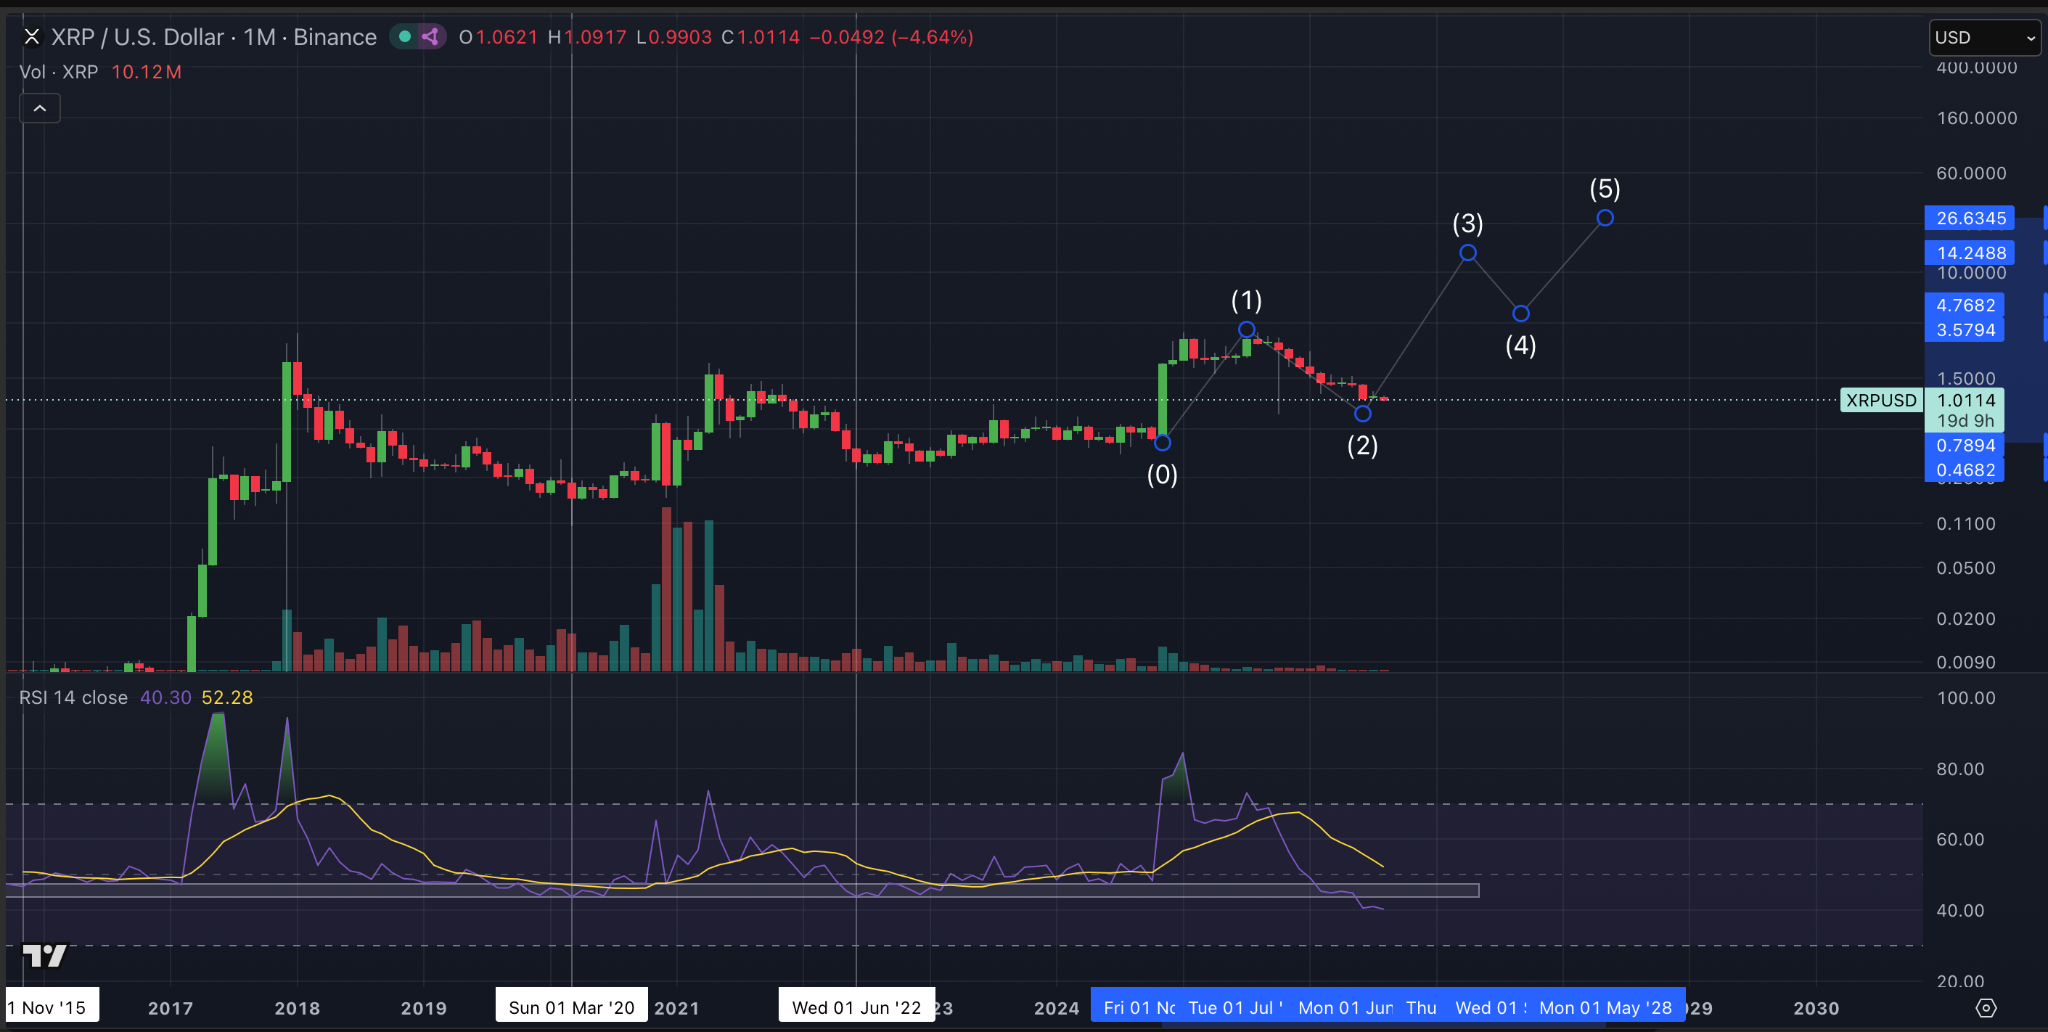
So you’re potentially looking at anywhere between 600% and 86,000% based on these different historical measurements. Let’s just be conservative and say that we line up with that roughly 1,000% move for the next leg here for XRP.
Next, I wanted to retouch on XRP Bitcoin, XRP ETH, and XRP dominance. What I will say to each of these, without having to go into them in more detail, because a lot of the annotations are already drawn on each of the charts, is that I would say, at a very minimum target, we will see a retest of the all-time highs.
In that situation, XRP is essentially just ranging against all of those denominators.
Then, for a bullish target, we would say that we could be coming towards the end of a wave two, with a wave three and a wave five to the upside still to come at some point, if I’m right with the downside targets on XRP Bitcoin and XRP ETH.
Just using the Fibonacci retracement tool, that would give us a target of roughly $14 for XRP. Now, in the previous expansionary cycle that XRP had in 2017, we stalled out on that 4.236 level for a little while before going for what I would consider a blow-off top.
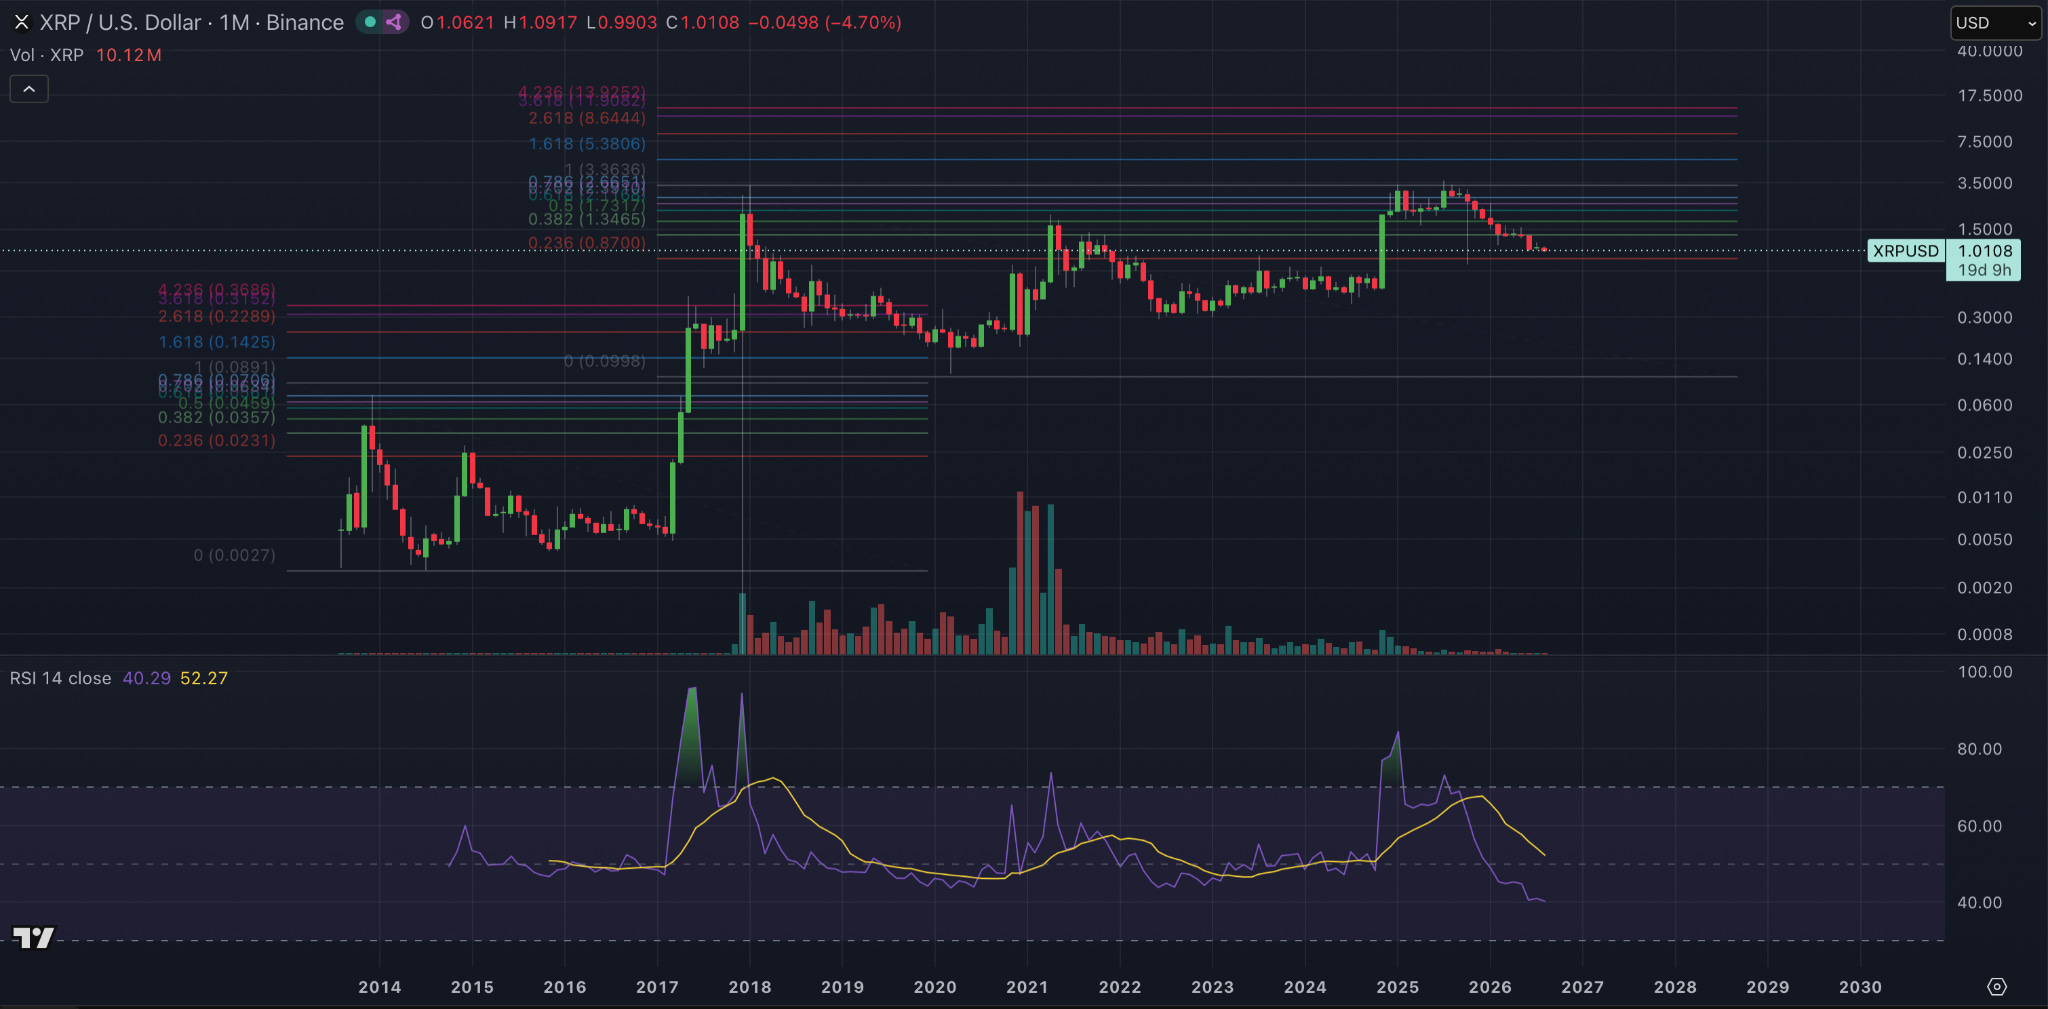
Now, for XRP today, as I said, that would be around $14, with a potential blow-off top above that, which again would line up with that Elliott Wave theory.
Definitely something to take into consideration if you trade crypto. It’s a great tool to give you some potential take profits on any chart that you’re looking at or you think might expand in the future.
No posts
Comments
Nothing yet. Say the first thing.
Sign in to join the conversation.