
The content below represents the personal views and opinions of the authors. It should not be considered as investment or financial advice.
Another week, and this week we’ve seen something quite significant. I’m going to spend the majority of this article writing about crypto. As you can imagine, we’re quite excited right now.
But I do want to preface this by saying I’ve been saying to accumulate for a while, and I’ve been discussing over the last few weeks how much open interest has grown and that volatility was coming. Now, it seems volatility is here.
I’m going to preface this with a little bit of macro, and then we’re going to get into what I think is going on in crypto right now.
But to be absolutely frank with you guys, when we see aggressive moves like this, as I’ve been saying on my Twitter, the best thing to do is just get out of the way. Your plan should already have been in place. You should have been executing for the last few weeks. The last thing you want to do is rush into anything when things are moving like this.
If you think you’ve missed the opportunity, then you’ve misunderstood the last year of price action. And if you played that wrong and got yourself caught out, then you’re in a bit of trouble now, because these green candles could definitely continue, as they did in November 2024 for XRP, for example, but we could also see a pullback.
And that’s why you buy red candles and you watch green candles until they hit your take profits.
That’s always been my mantra.
With today, I think something that a lot of people are going to be pointing their finger at to say why price is rallying is because we obviously had a lot of key players in the crypto space meet at the White House, including Brad Garlinghouse, CEO of Ripple, who was mentioned in person and by name by Donald Trump.
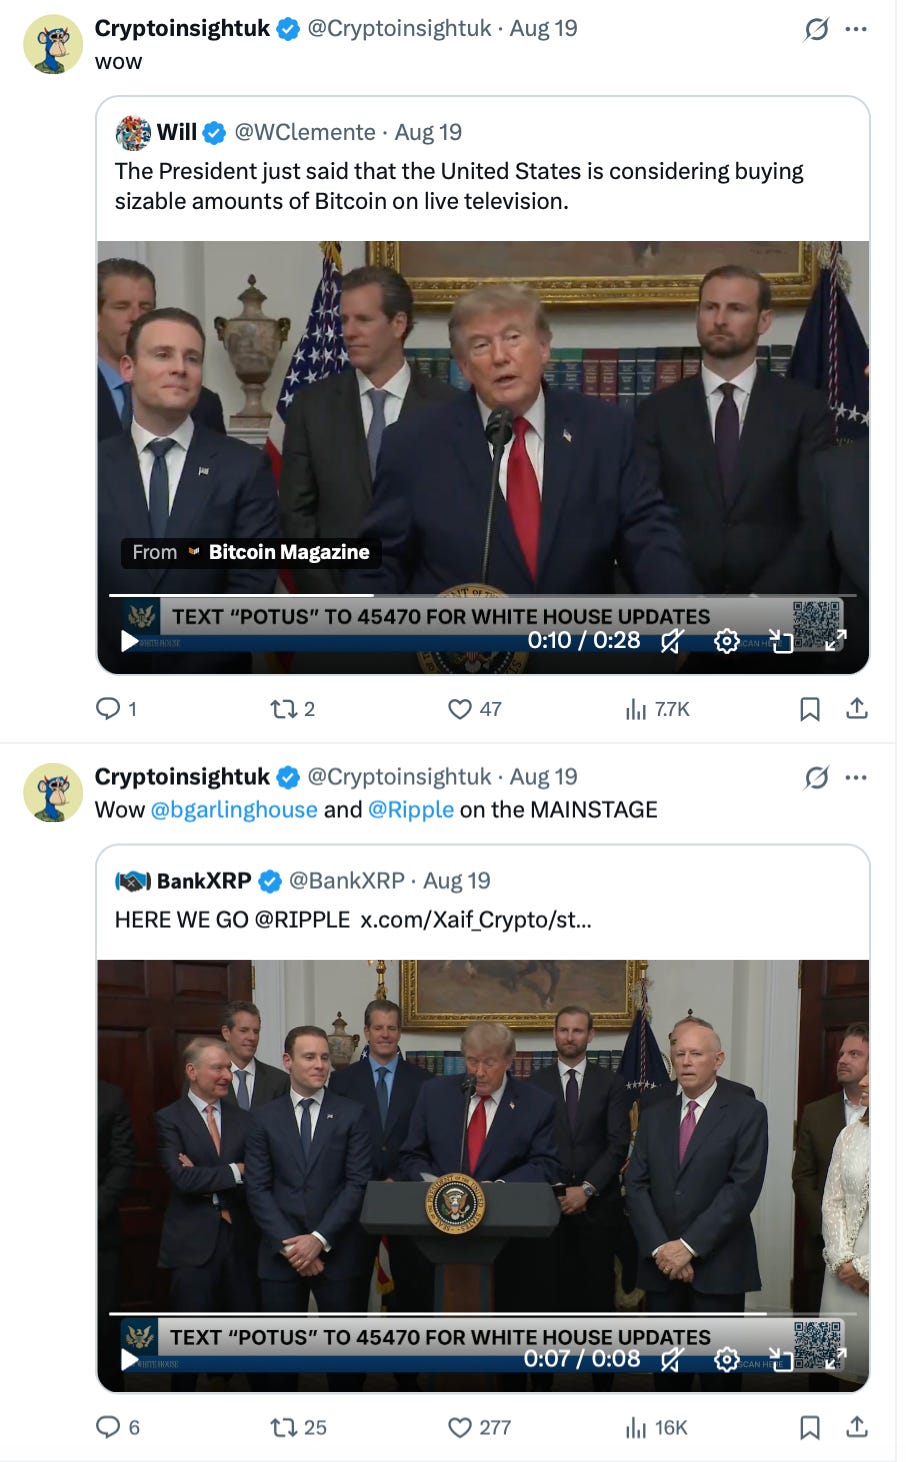
We also saw Trump talking about the potential of them buying Bitcoin, and I think that’s bringing some obvious optical positivity to the crypto space at a time when sentiment was really in the gutter.
Who’s really paying attention? I think this next headline is the thing that brings the most positivity to the space.
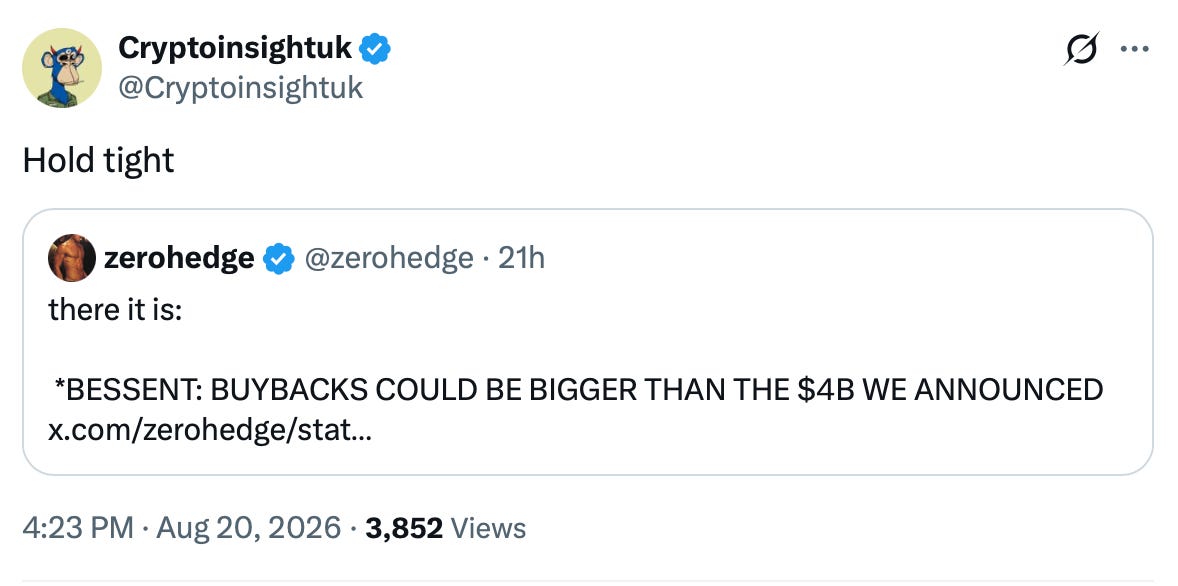
Scott Bessent came out and explained that buybacks could be bigger than the $4 billion a day that they’ve approved for long end bonds.
And why is that important?
They’re already buying $2 billion a day anyway, and $4 billion isn’t a massive amount. But what it does mean is that the level that bond yields have got to now is the top level that they’re comfortable with as a government.
Essentially meaning that if we get any higher than where we’ve been on the 10 year, which is something I’ve been pointing out over and over again in this newsletter, if we get any higher than that 4.8% level, then the Treasury are going to step in.
And they will do that by any means necessary. In this case, verbally, but also backing that up with double the daily buybacks compared to what they have been doing.
That essentially means that whatever the liquidity conditions and the faith in the US financial economy are right now, they shouldn’t get any worse.
So essentially, they’re almost indicating verbally that the lows of liquidity and potentially sentiment are in, and they are going to force that.
Since that announcement, we have seen a little bit of a bounce in yields. But again, he’s already said and explained that they’re willing to step in and double buybacks. They will do more than that as and when required.
It’s basically reinforcing my thesis that they’re not willing to let the system go, and that thesis leads to crypto having explosive rallies.
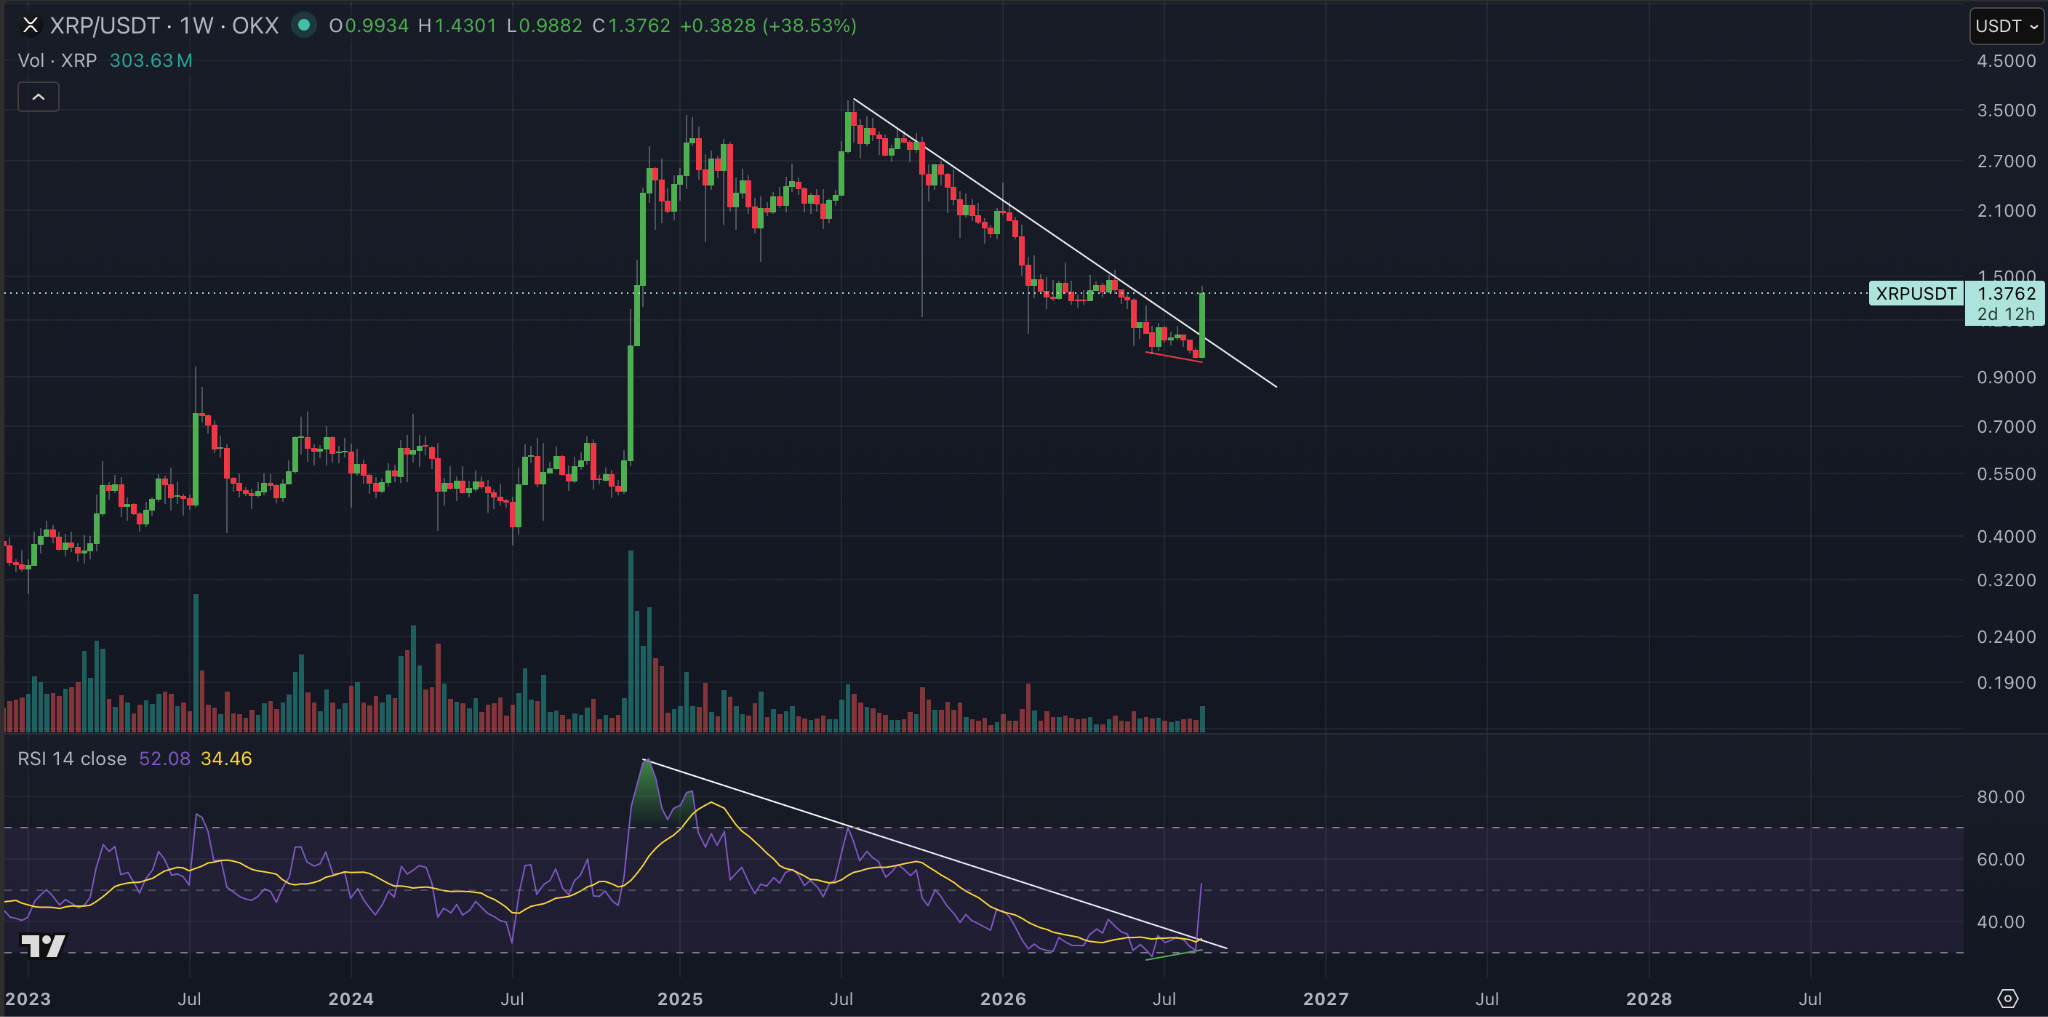
What we can see is XRP has had a weekly bullish divergence, and it’s also broken out of what’s been a downtrend since the all time highs, supported by volume, and broken out of the downtrend on the RSI as well.
This, to me, looks like the start of something exciting.
Now, we still have two days and twelve hours of the weekly candle left. Anything can happen. It’s Friday today, so Trump obviously can pull the rug on us with Iran and after market closes, etc. But I’ve just got to call a spade a spade and say this looks exciting.
Now, as I said, there’s a lot to go from here. There’s a lot to continue with in terms of discussion, and for a perfect weekly candle close, I’d like to see a close above $1.55 in price.
But this is definitely an exciting start, especially with the volume, the weekly divergence and the trend break.
If we’re starting our third wave of a larger five, this could get very exciting very quickly, because the third wave in Elliott Wave theory is often the most aggressive in terms of speed and velocity.
Playing Elliott Wave Theory by the book, which it never is. It’s never the perfect scenario. You have to decide on scenarios yourself and try to validate wave counts.
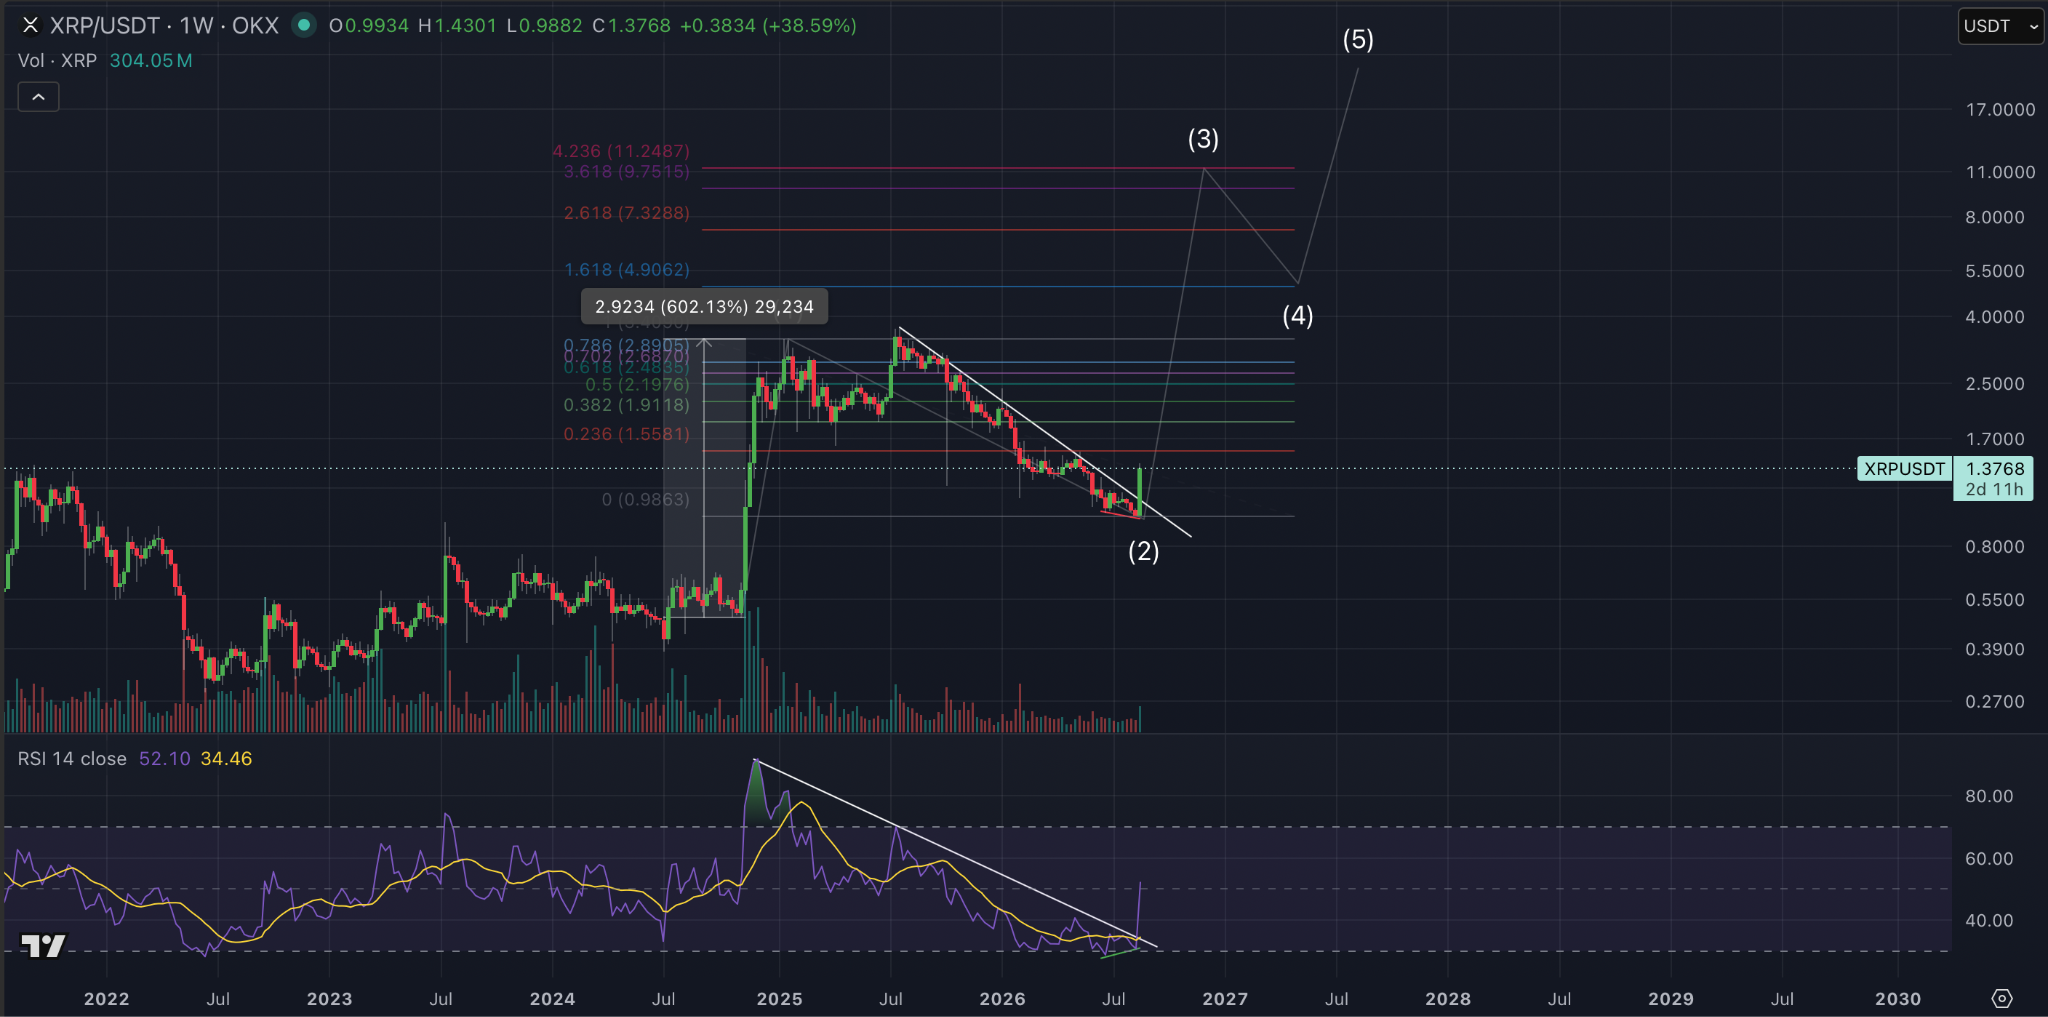
If we’re playing it from the perfect scenario, wave 3 cannot be the shortest wave. That’s the first rule. And the second rule is that normally wave 3 can be about 1.66 times the length of wave 1.
Now, if that is the case, and I’ve thrown a Fibonacci retracement on this as well, it would reach out to the 4.236 extension at $11.21.
And if we times the 600% by 1.66, with the 600% being roughly the first move that we had from November to our local highs before what I consider an ABC correction, or an expanding flat correction where we did actually sweep the highs, I would say 600% was the main move.
Times 1.66 gives us a 996% move from our absolute lows at $0.98. That would also give us a target of around $9.76, which is very close to that Fibonacci extension as well.
So we’ve got a double target within that range of around $9 to $12, and that’s where I’ve been targeting for a long while anyway, if you guys have been following me for a few years.Breaking down what I’m seeing in terms of leverage and open interest to see if we are potentially starting this third wave.
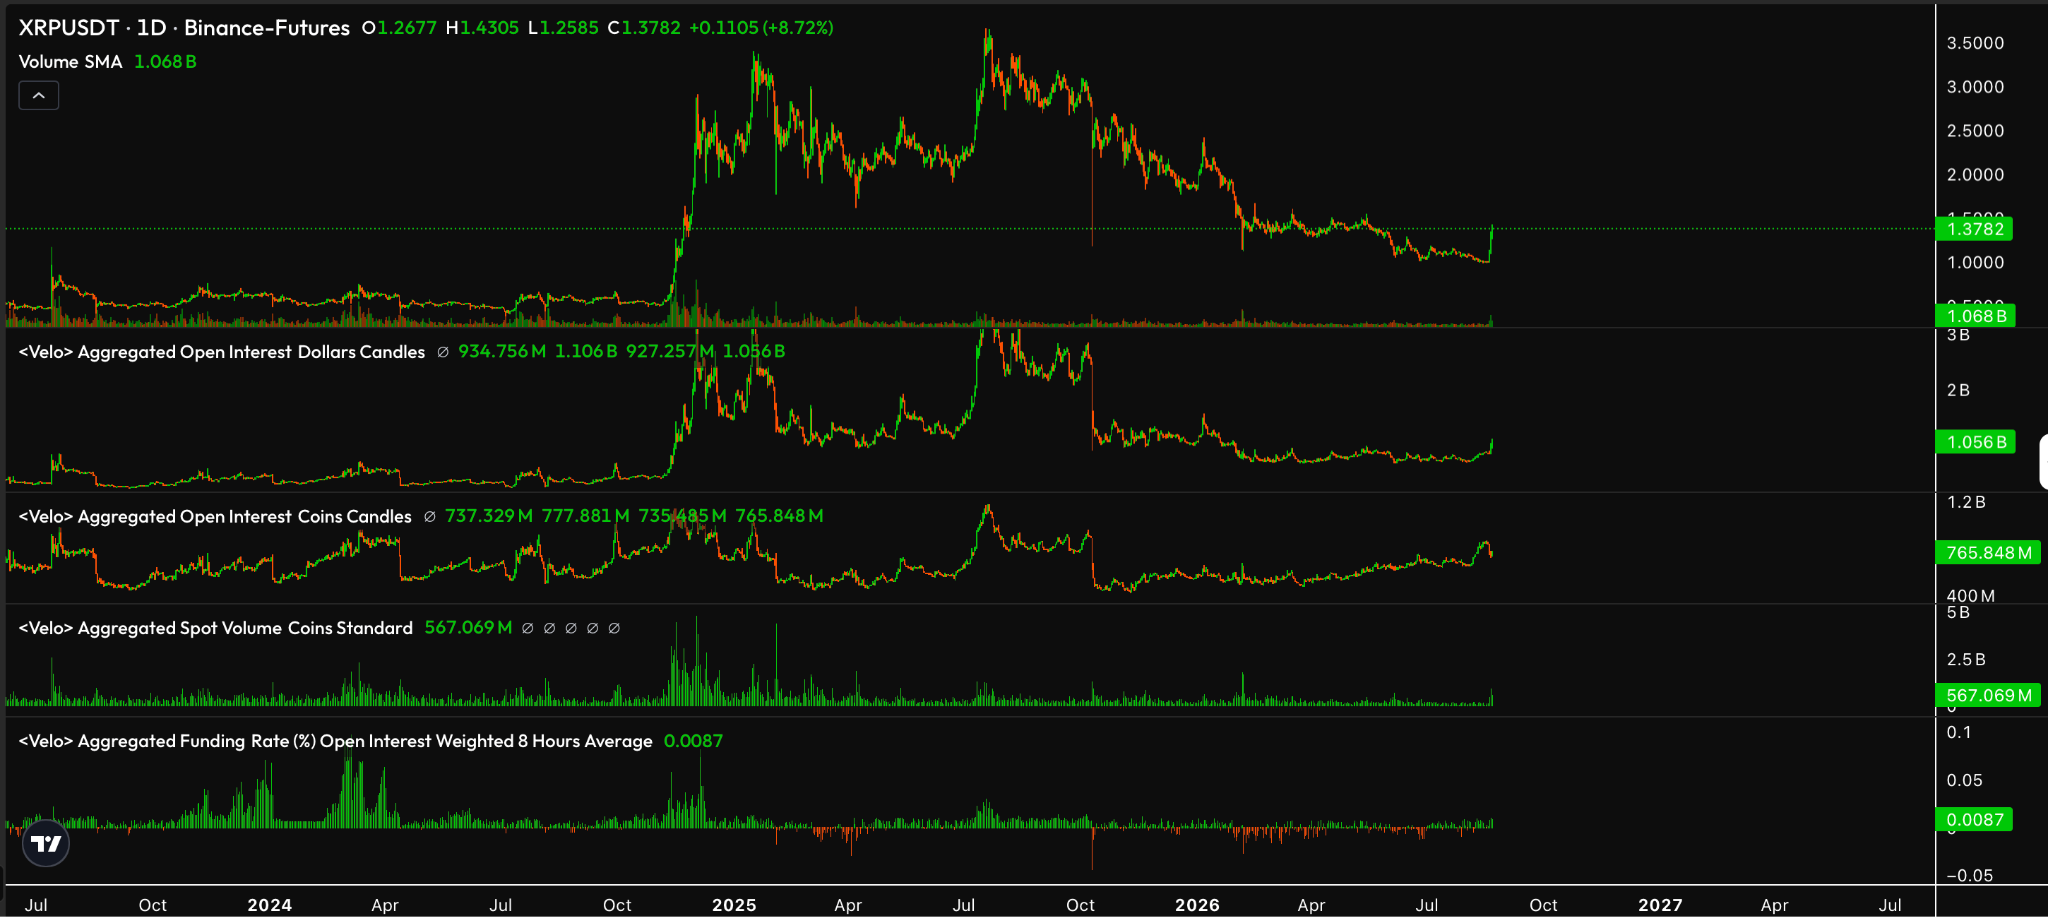
Now, to start with, what we can see is, if you look at the third bar down, aggregated open interest in coins, we can see that as open interest in coins has started to bleed off, price has squeezed.
And we’ve discussed this for a while. I said there’s a lot of open interest, and it could lead to an upside squeeze if a lot of the people in coins are short. And actually, that trend is repeating across Ethereum, XRP and Bitcoin.
What we can also see is aggregated open interest in dollars starting to rise off the lows. So people are going to say, “Oh, well, there’s going to be a liquidation event coming because all these people are jumping in on leverage.”
And that could be possible.
That’s why I say it’s very difficult to predict these short term moves until you can look back and say, “Oh, that’s what that was. It looks obvious now.” It’s difficult to predict what this might mean in the moment.
What it does mean is there’s more leverage coming into the system. I’ve been saying there’s going to be more volatility coming, and that’s what I think this will mean. But we don’t know when or if that extra liquidity will get squeezed.
Because if you look further to your left on the screen, where you can see our main rally from November 2024 to the highs around $2.70 to $3 that we’ve just highlighted in the previous chart, what you can see is open interest rises significantly.
In fact, it roughly 4Xs from here before price starts to stall out.
So that gives us the space, just to get to those previous heights, for a potential 300 to 400% extra addition of open interest.
If we add on to that, and you look down at the aggregated spot volume, what we can see is we’re starting to see some spot volume come in. This is as some shorts get squeezed from the open interest coins candles, but also as people support this move by buying actual spot crypto.
So I think there are foundations there to say, look, this thing definitely could have legs to go higher.
Will there be corrections along the way? Maybe.
Where should we enter into this trade? I tweeted this, and I’ve said it for a few weeks. You enter at the lows, and that’s what I’ve been saying for months.
So where are we getting in now? I don’t know.
Because just as easily as we could have a pullback and see some of that open interest bleed out, look back to November 2024. What’s to say that XRP isn’t going to start this third wave here?
I think it’s very possible that it could be starting that third wave, or has already started it. And in those times, you don’t get much of an opportunity to get in for XRP.
So I’m not going to sit here and say buy XRP right now because we’re definitely starting our third wave and we’re going to $10.
But I’m also not going to sit here and say that can’t happen, because I think it definitely can happen, especially when the market has felt like it has, and we’ve decoupled from everything else in terms of legacy markets.
This could be the time.
It does feel like things are lining up one way or another. And I might be deluded and I might have hopium, and that also could be true.
But that is my honest opinion.More exciting thoughts for XRP.
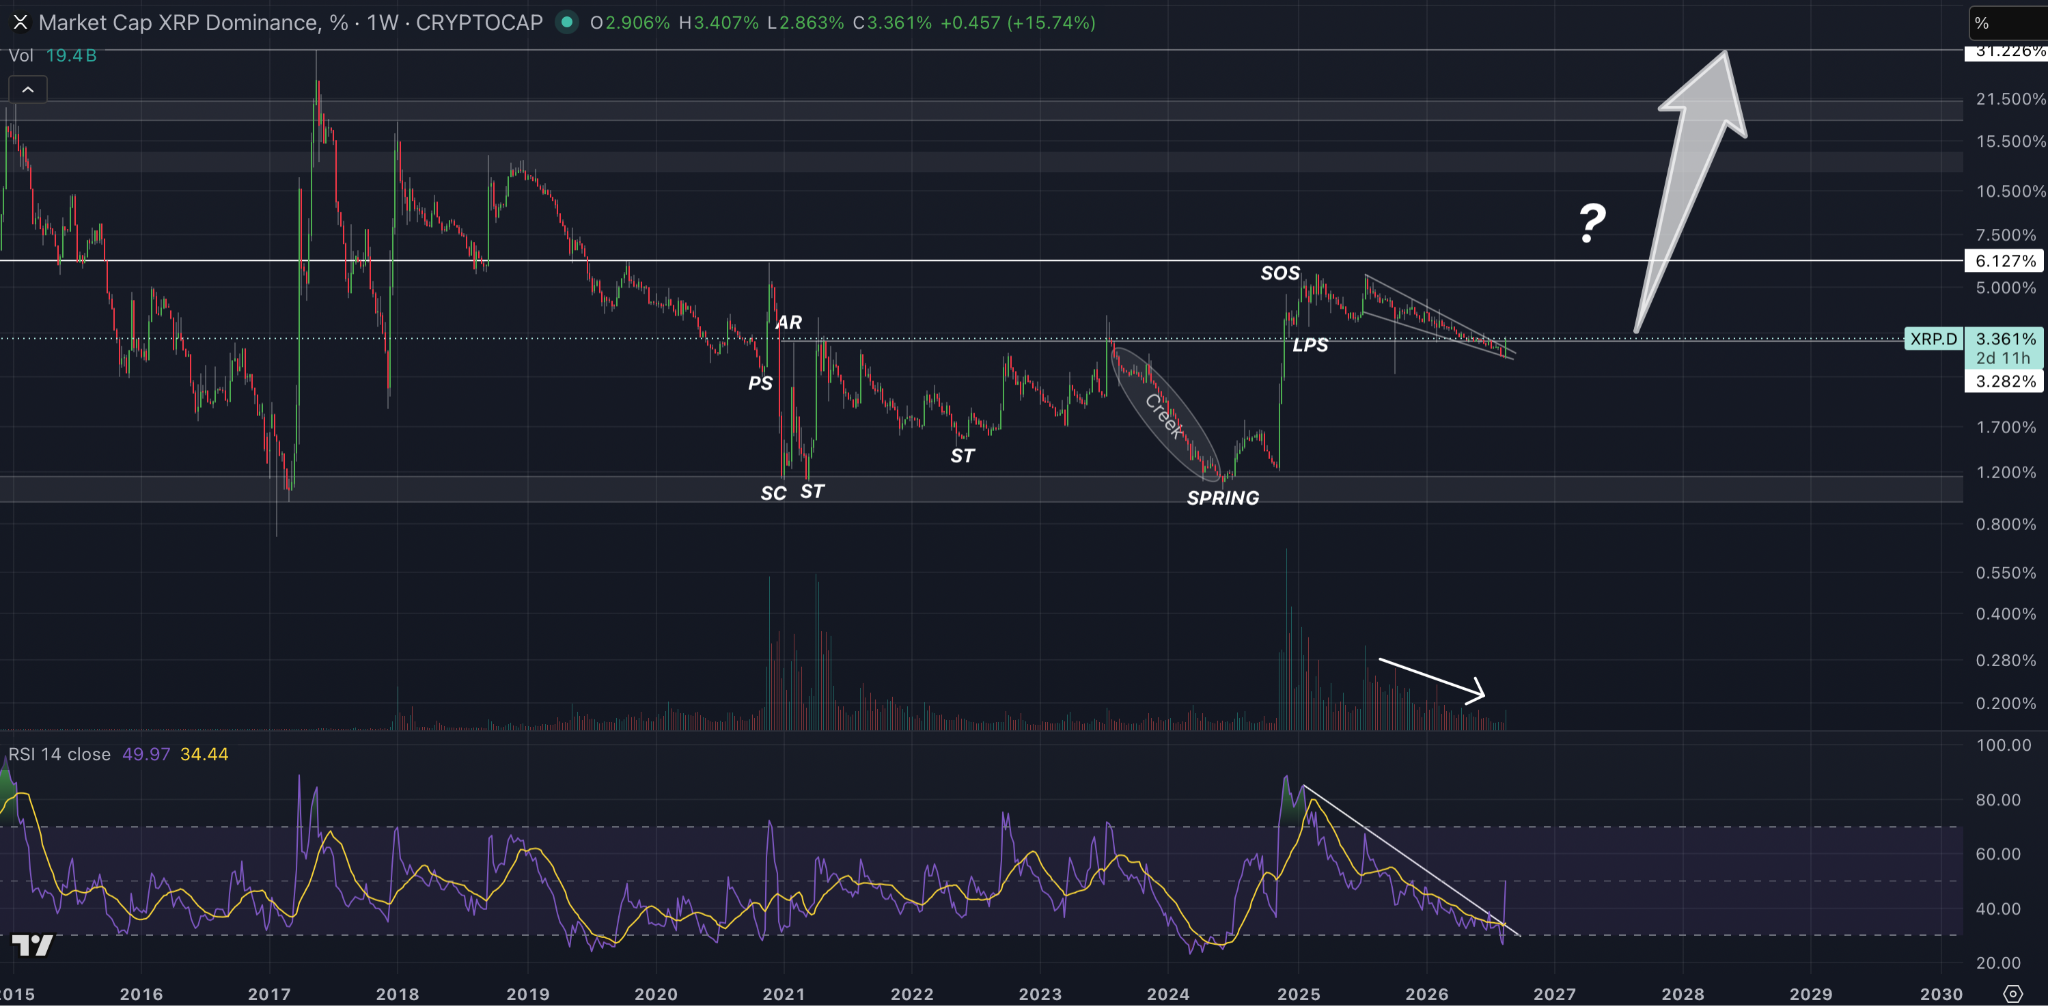
First off, the other cryptos, including ETH and Bitcoin, are also moving extremely well. ETH did a 20% daily candle the other day.
But the other one is that XRP dominance has really taken a bounce from the oversold area where, on the weekly timeframe, the last time we touched this area was the start of our first real leg up.
Now, why is that exciting?
Because that’s showing that XRP is outperforming the market here.
There’s still two days and 11 hours until the weekly close, but what we’re seeing is increased volume. If you look at the bottom of your screen, we’re seeing that increased weekly volume candle come in there. That’s a great starting sign.
If we can get a close here or higher for XRP dominance on the weekly, there’s an argument to say that the next leg up is coming. And that next leg, for me, targets at a very minimum around 6% of the cryptocurrency market share, if not towards 11 to 13%, and eventually targeting 31% of market share.
You can see the RSI has also broken out of its downtrend after consolidating for such a long time.
The signs are there to say that this could be exciting. I’m not saying, again, that it’s guaranteed, but I really am looking at this and thinking this is the most likely we’ve looked for a significant candle, for a significant price increase in XRP, for a long time.
Bit of a different one from me this week. Normally I go through a few charts and whatever on chain data I have been digging into, but I want to do something else instead. I want to do a long brain dump on Bitcoin and where I think we actually are in this cycle.
I did this back when Will and I first started writing this thing, all the way through 2021 and 2022, just to try and give people some idea of the timings. Where tops tend to land, how long the bleed usually takes. It seemed to help back then so I am doing it again.
Before I start. Do not take this as the answer. We try and do proper analysis here to the best of our ability, but this is not an exact science. It does tend to be roughly right, and that is about as strong as I am willing to put it. The market is maturing, the quality of what is in it is very different to what it was last cycle, and the whole thing deserves a pinch of salt. (not FA)
What the last two cycles actually did
Start with 2018 into 2019.
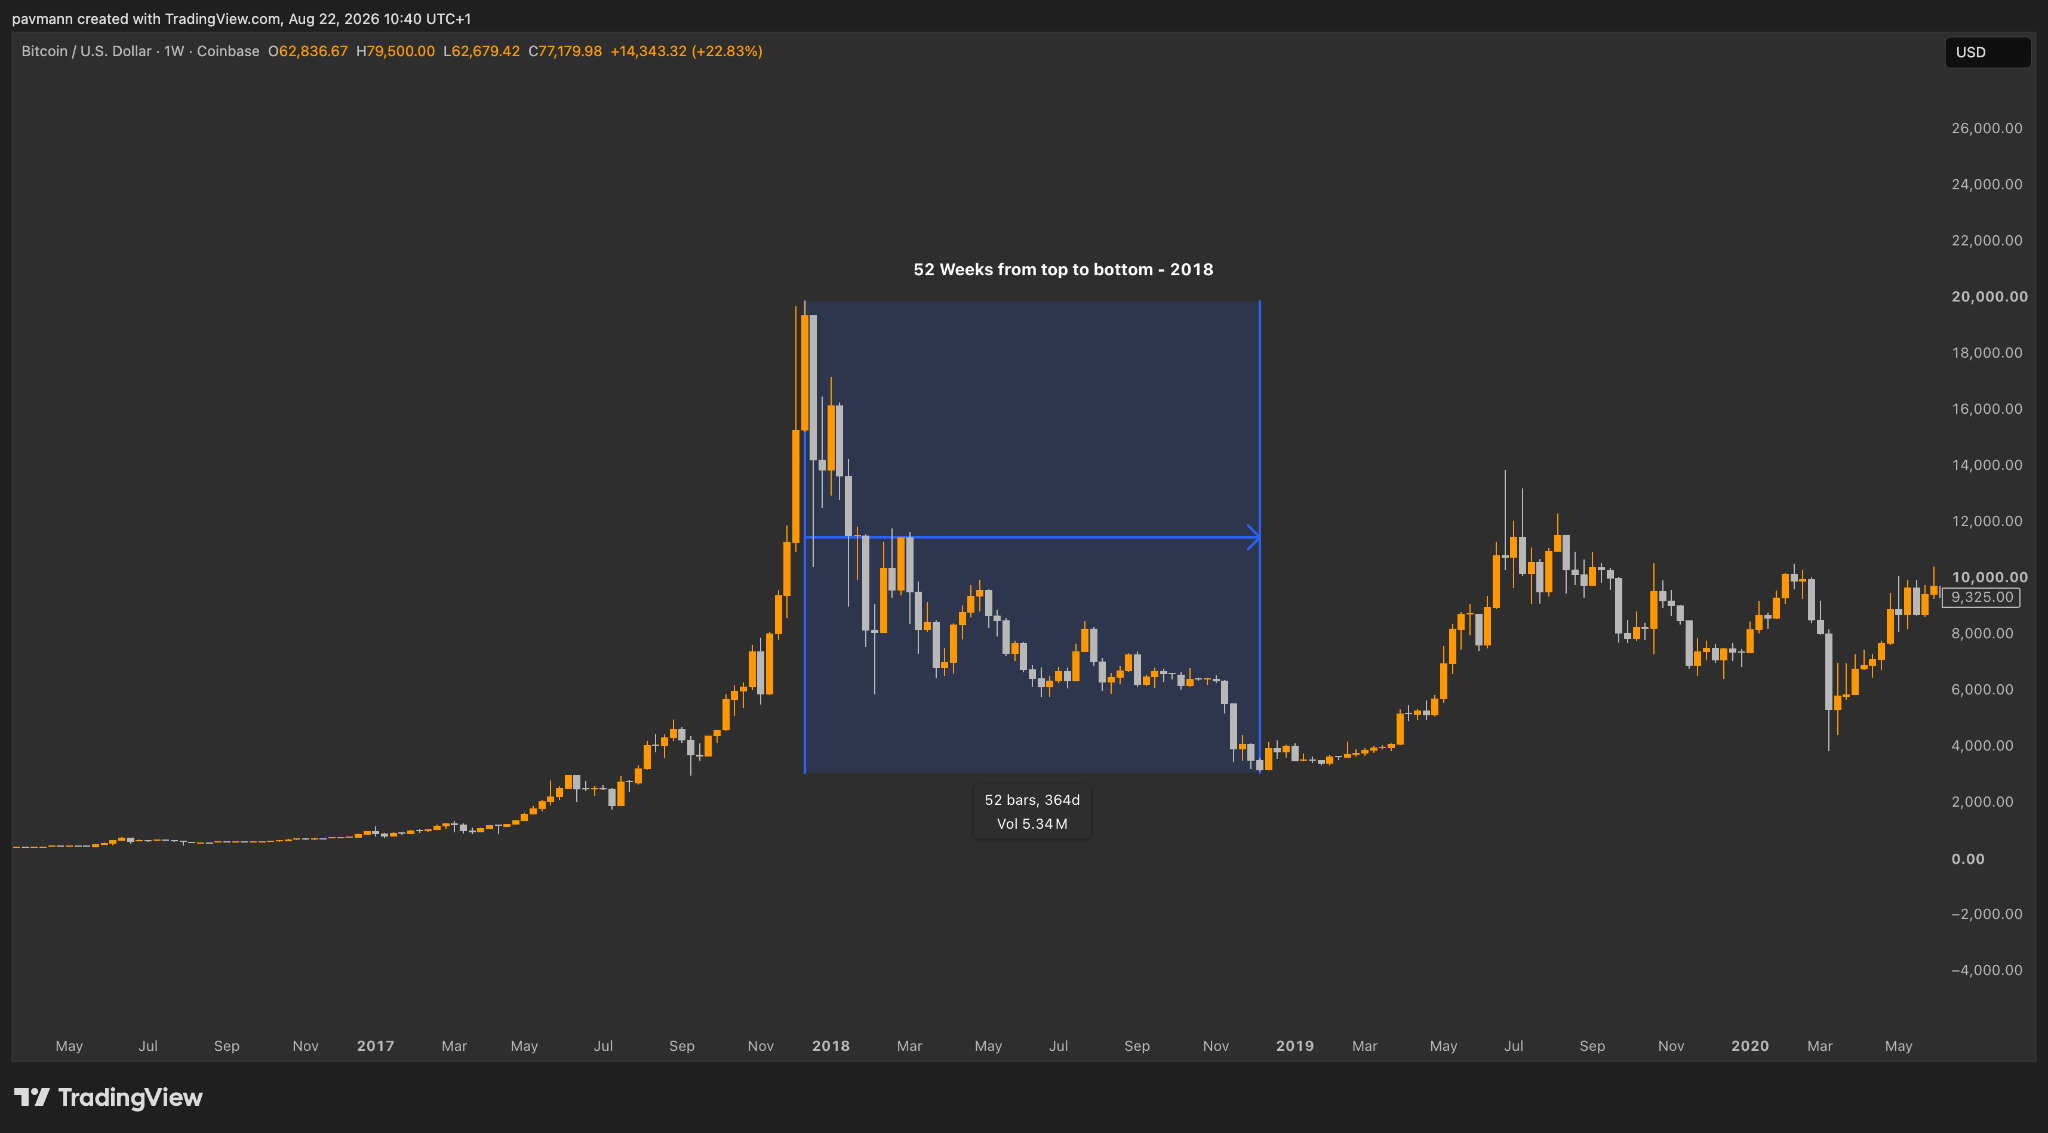
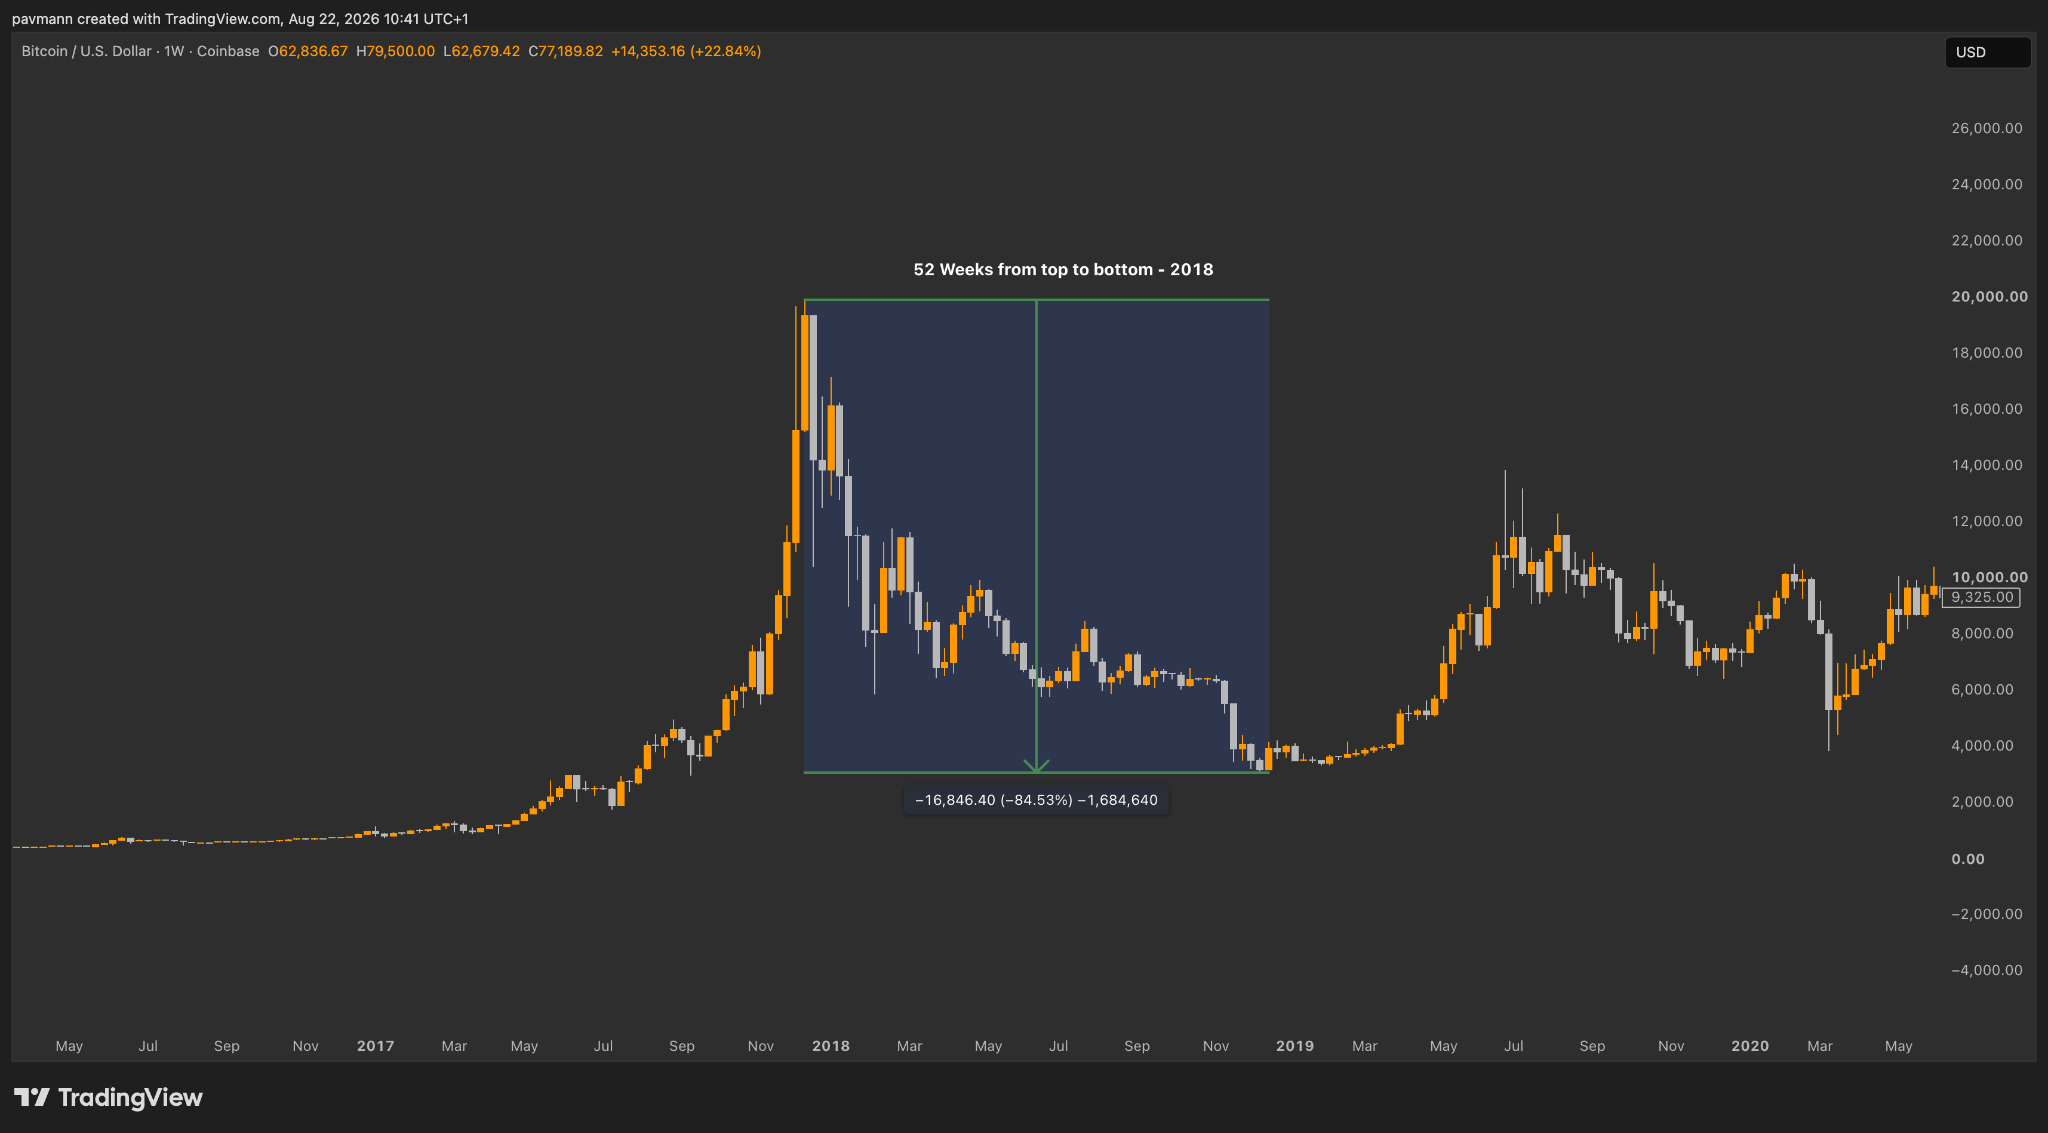
From the cycle top to the cycle bottom was 52 weeks. Inside that we got an 84.53% drawdown top to bottom, near enough. A year of bleeding, and if you held the whole way you were down about 85%.
Now look at 2021 into 2022. Top to bottom was 54 weeks. Almost identical. The drawdown that time was 78%, so slightly less pain than the cycle before it, but still comfortably in the same ballpark.
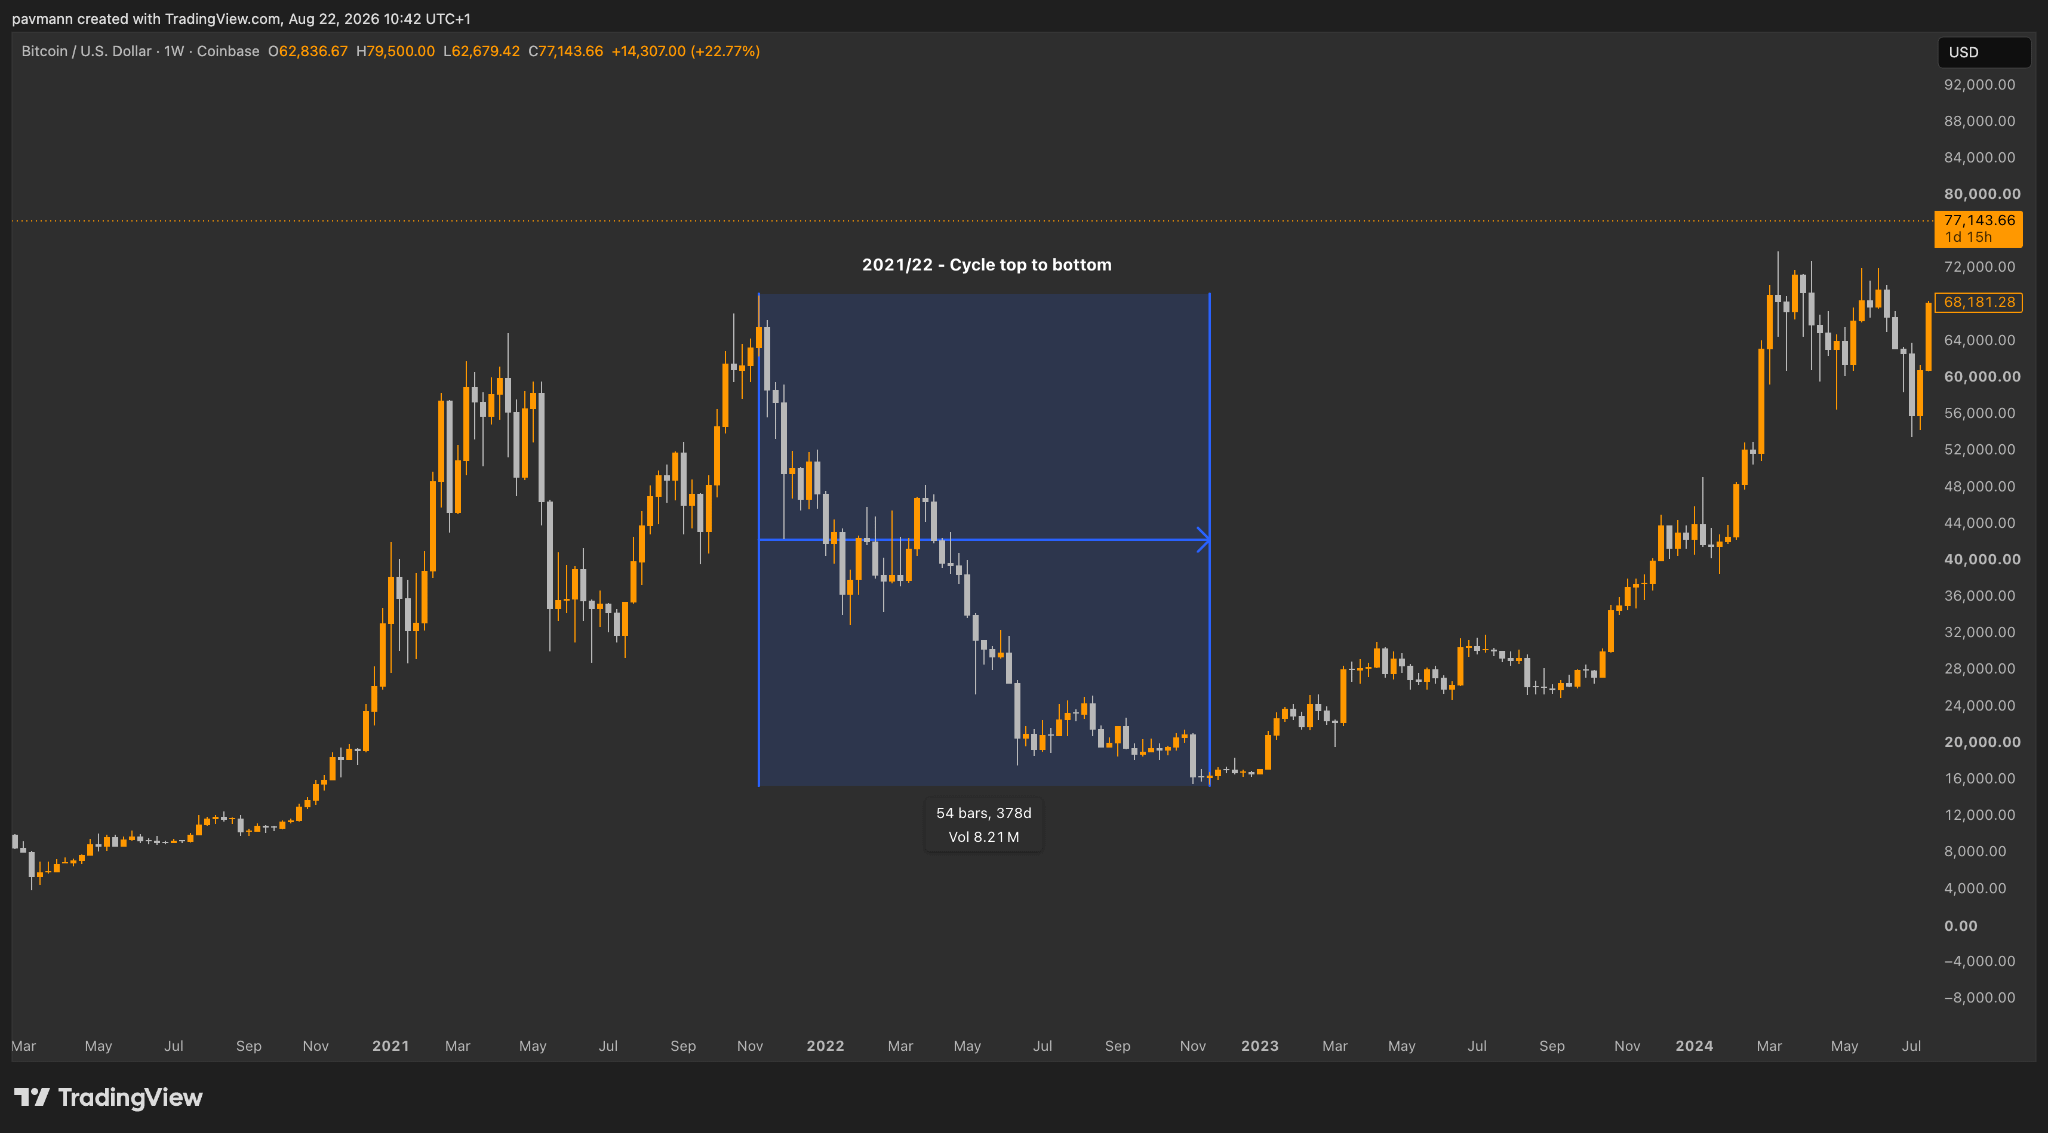
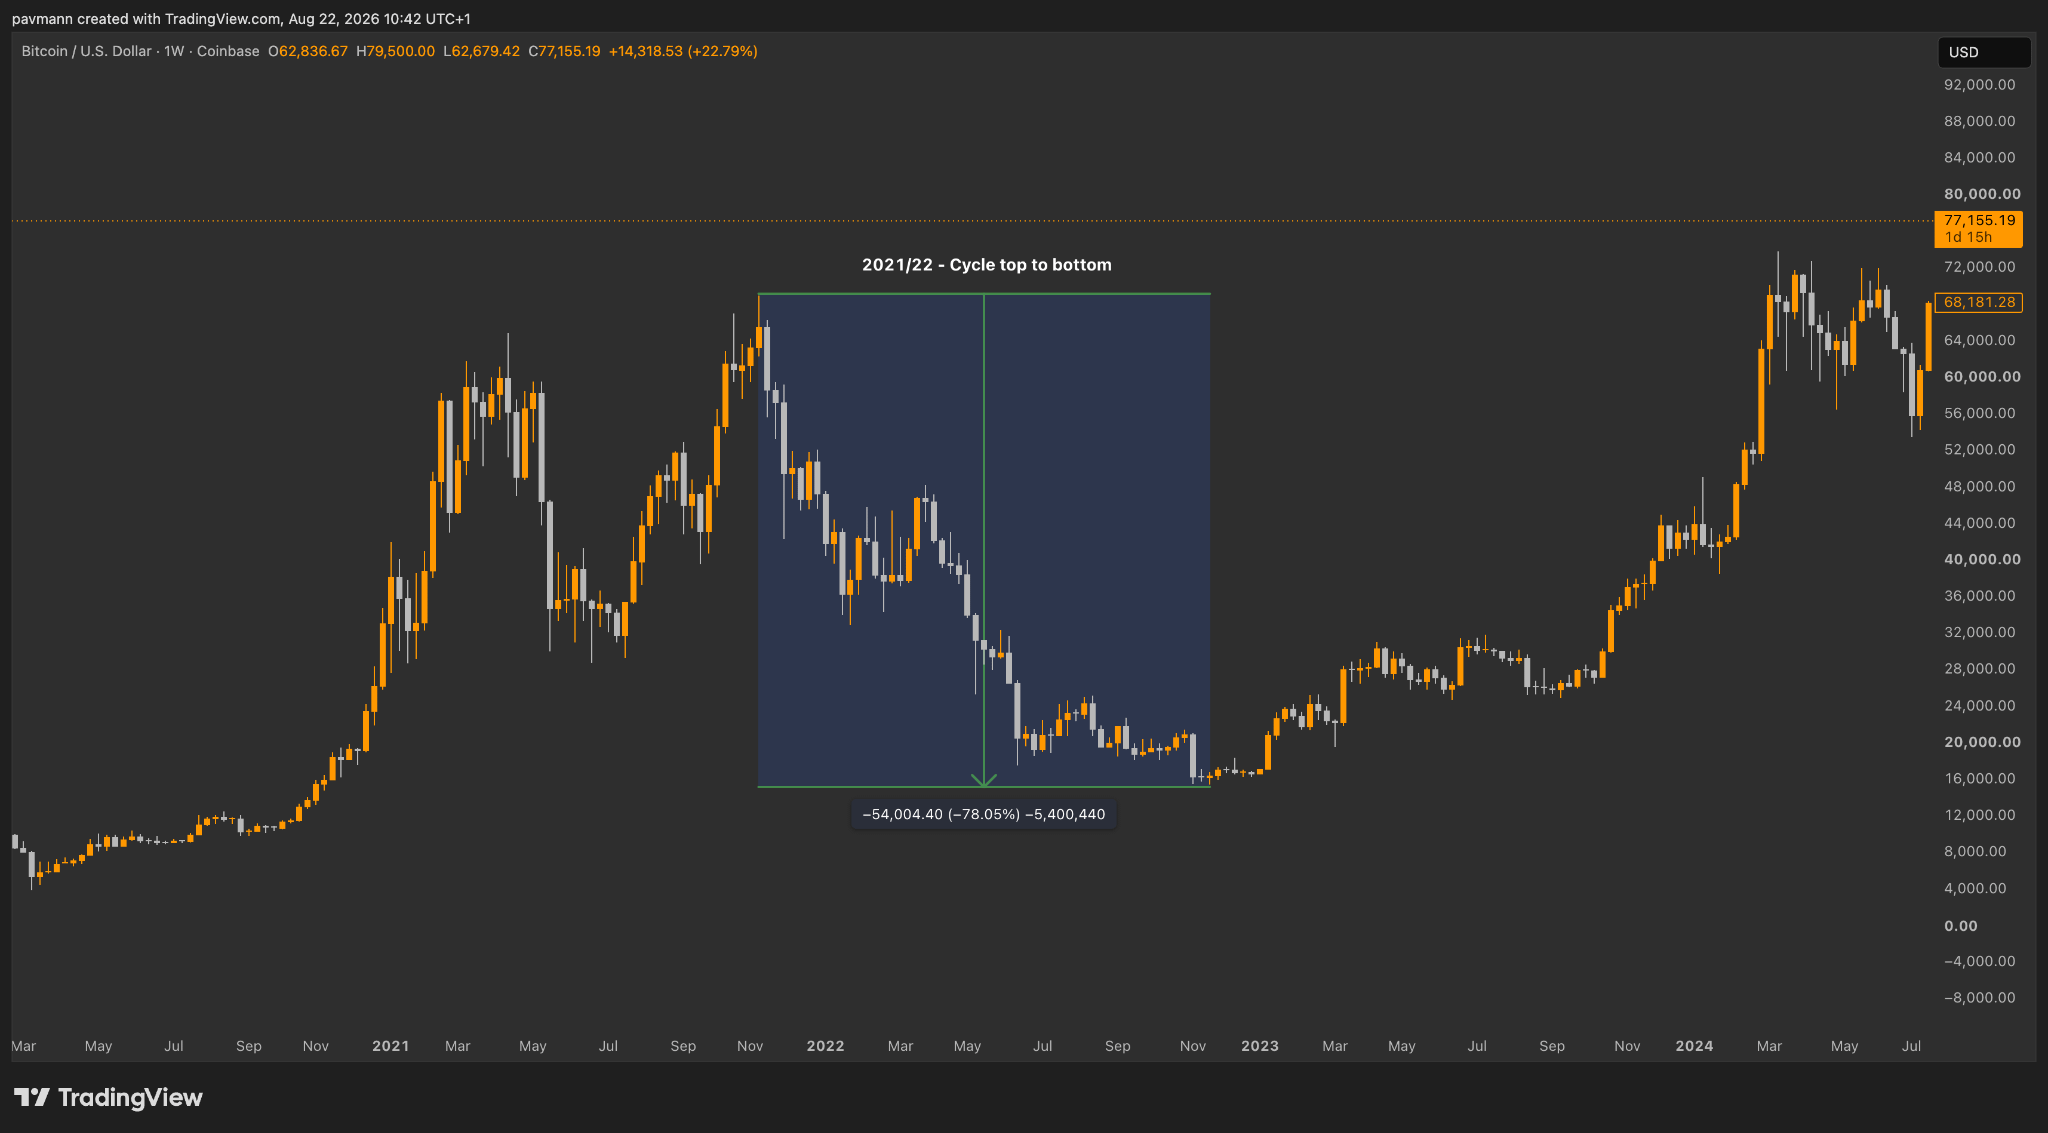
Two cycles, two completely different sets of conditions, and both of them took roughly a year and both of them took roughly 80% off the top. That is the bit I keep coming back to.
Where we actually are right now
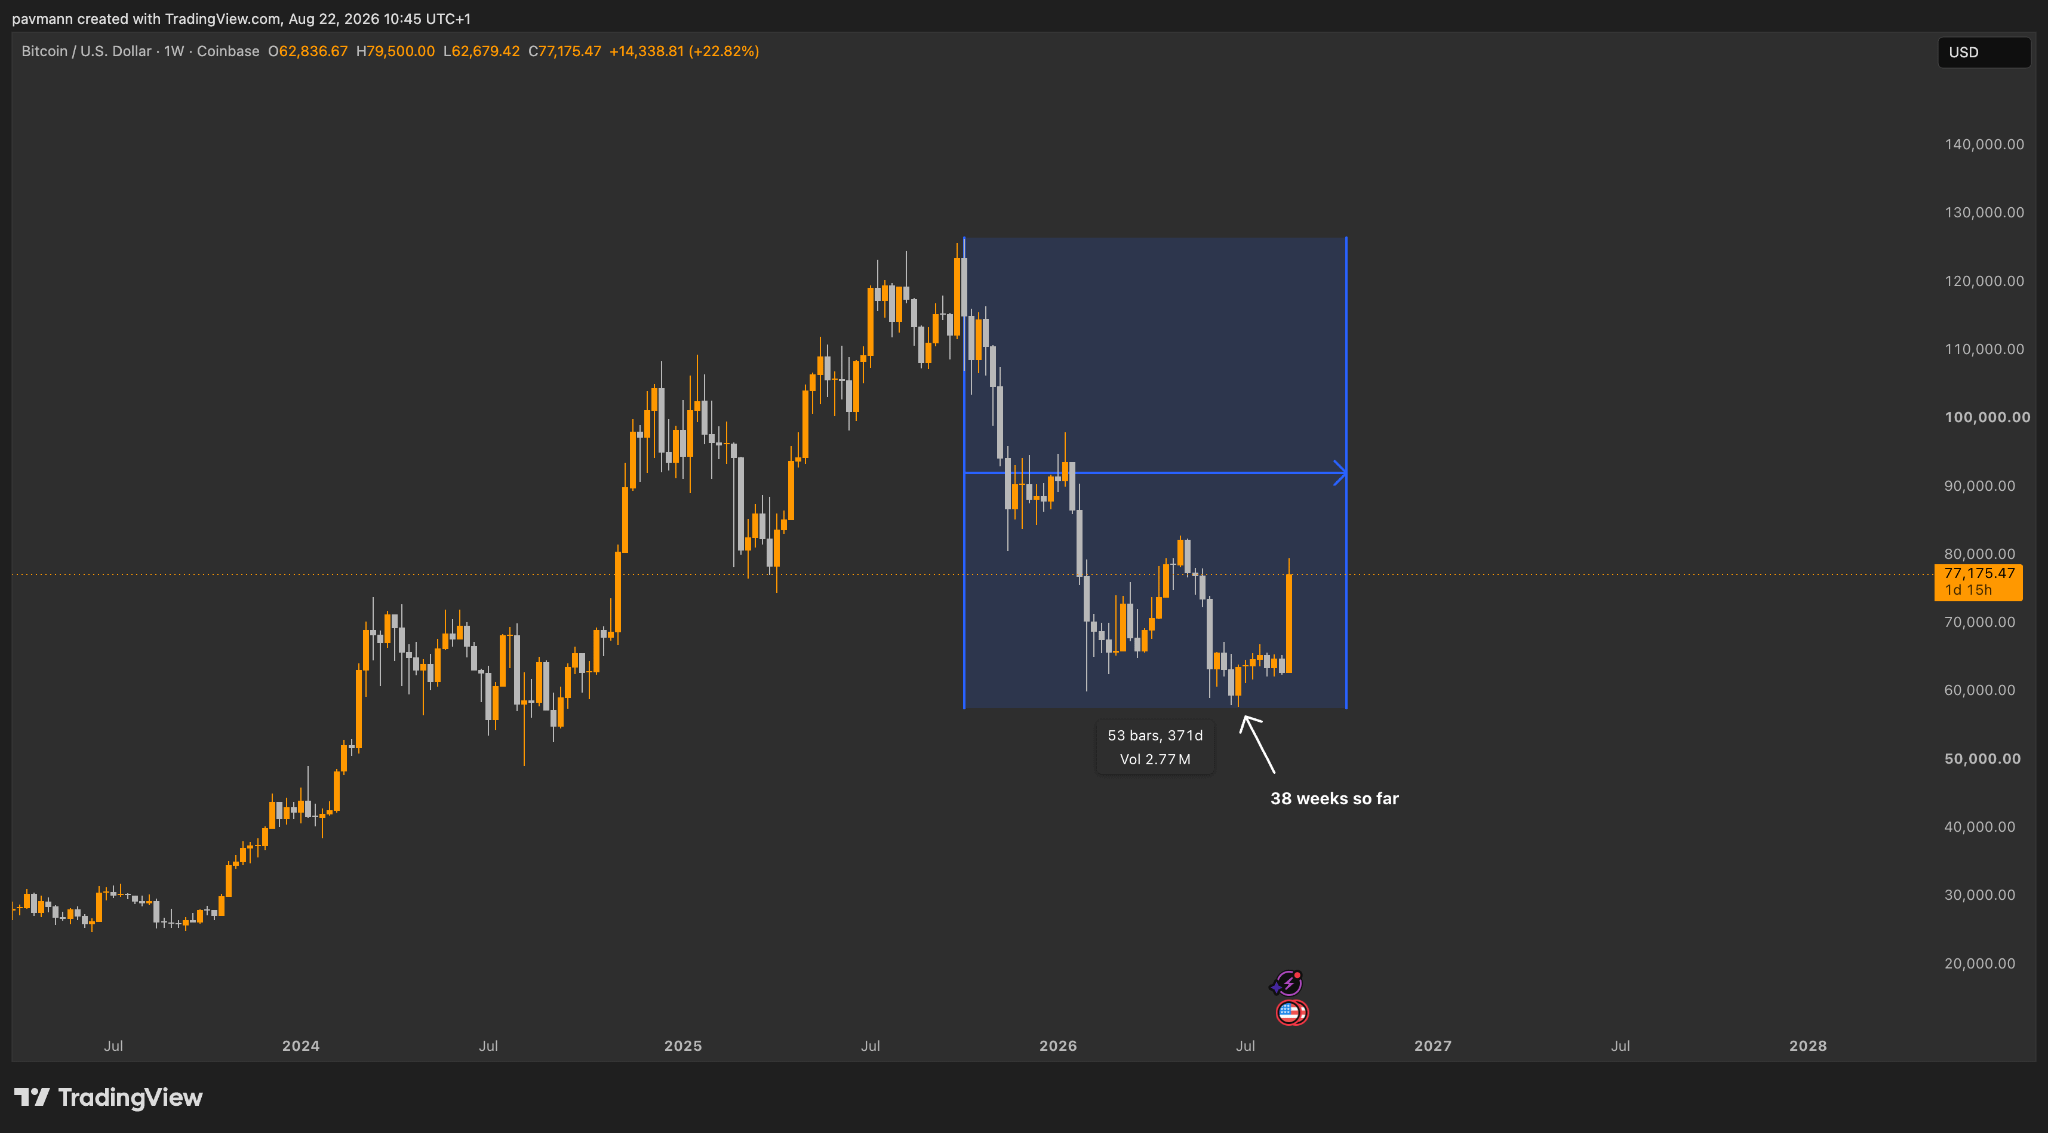
The low we have seen so far came in June. From the top, that is 38 weeks. Against a 52 to 54 week average, we are a long way short. Not slightly short. Fourteen to sixteen weeks short.
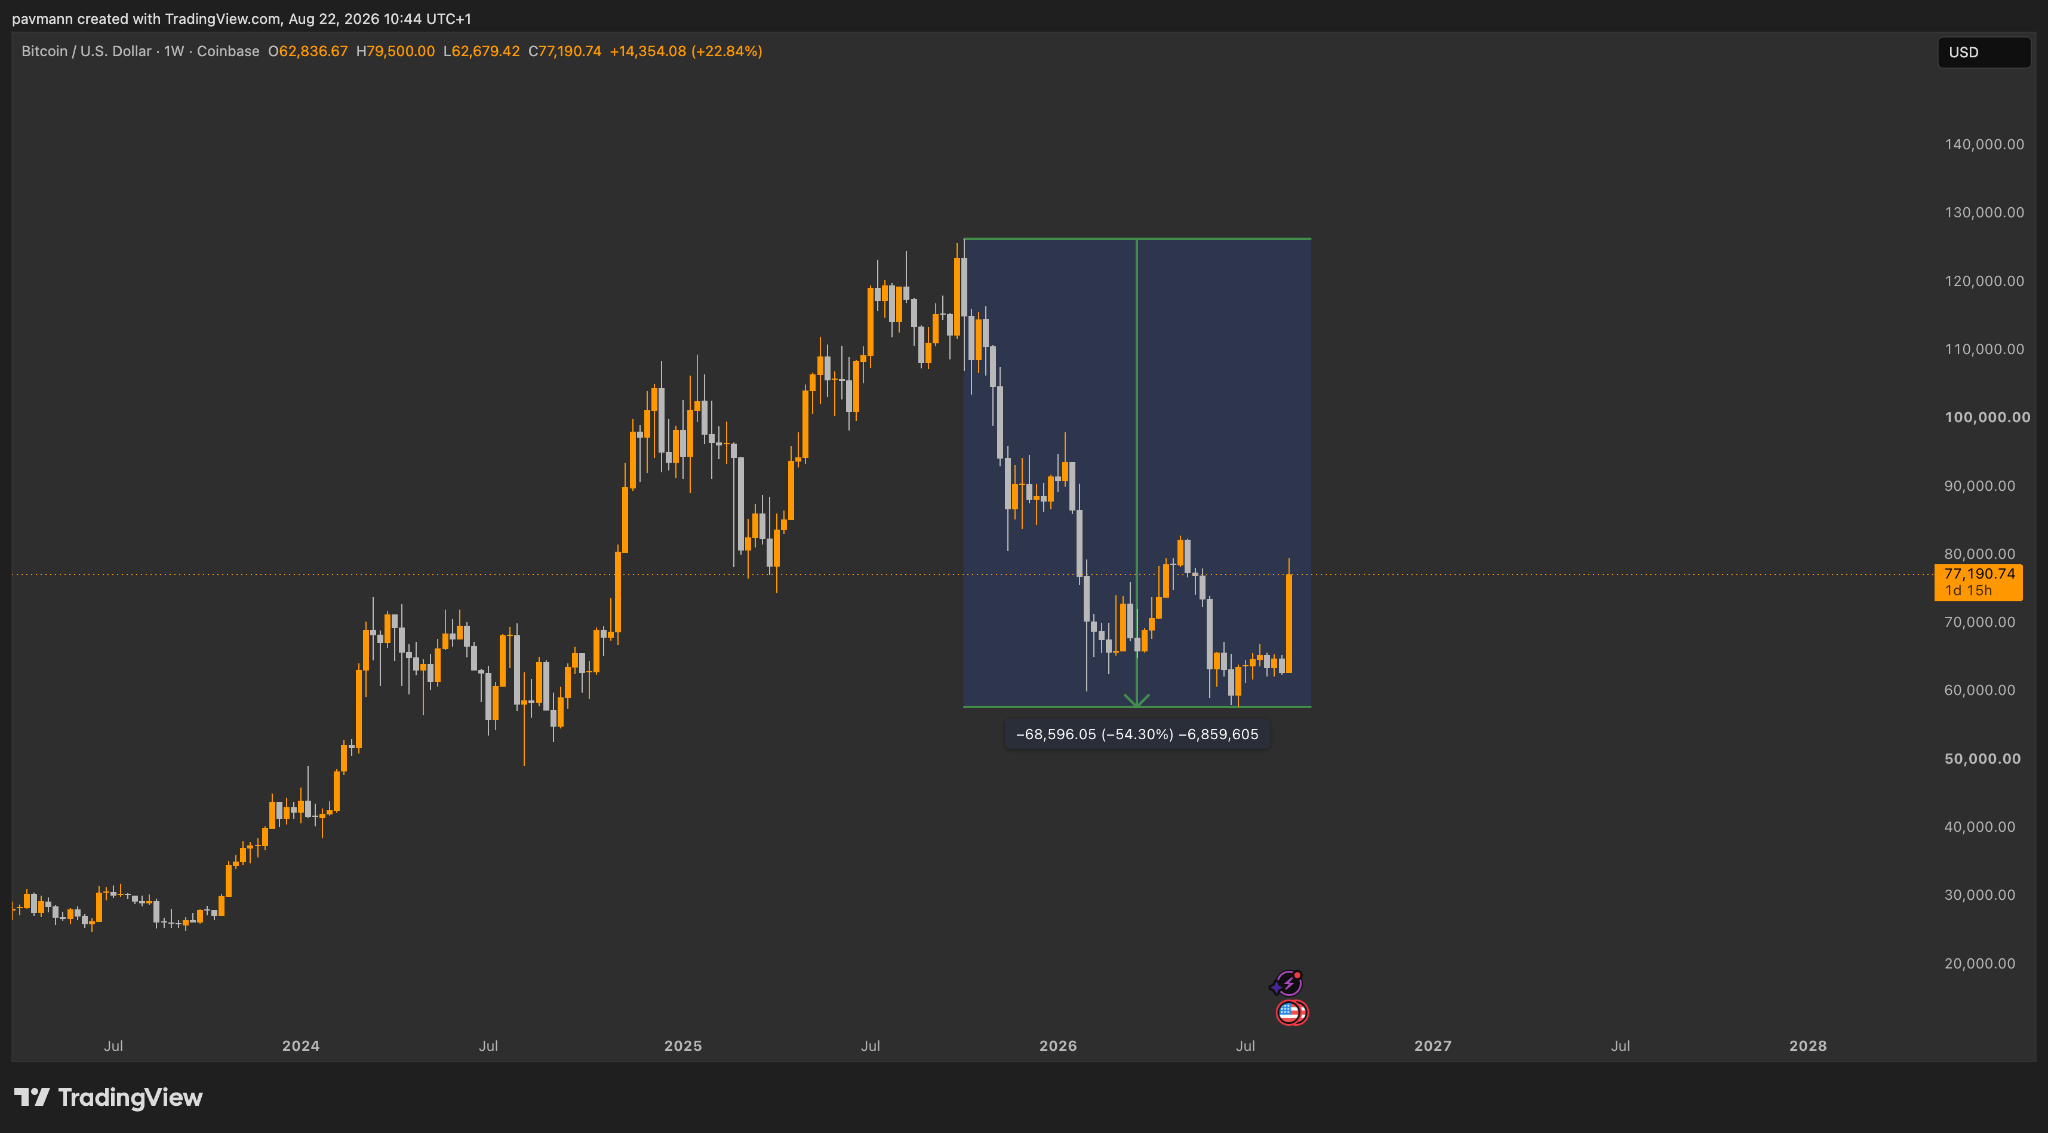
And the drawdown so far is 54%. Put that next to 84.53% and 78% and we simply have not been hit as hard as either of the last two cycles were.
If we assume this one runs to a similar timeline, you are looking at mid October before we get the low that actually counts. Possibly another low printed on the way there.
I want to be clear that I am not saying it has to go that far. It genuinely does not. Liquidity is different now, the legislation is different, the buyer base is different, the whole structure of who is holding this stuff has changed. I am not expecting a carbon copy.
But this is a game of probabilities and history rhyming, and it has proven itself out enough times that it is hard to look at 38 weeks and 54% sat next to 52 weeks and 84% and just decide it is finished.
Why I am not calling the bottom yet
I cannot sit here and tell you with any confidence that we have seen the worst of it, or that this rally is the start of the bull market. I think there is a real chance we get another choppy month or two, and choppy months are where traders get taken apart. Not investors. Traders.
The thing making me most wary is the liquidity. Long side liquidity below us is just stacking up, week after week. That is a pile of leverage sitting there waiting to be taken, and markets have a habit of going and getting it.
So no, this current rally is not something I am treating as the move that takes us out of the bear market. I think there are still a few tales to be told in this cycle before we are done with it.
Going to leave it there. Back to the usual format next week.
LINKS:
This newsletter is free because we love sharing our insights with the community. If you enjoy it and find value in our work, consider supporting Pav’s and Will’s Beer/Coffee Fund by donating $XRP to our newsletter donation wallet below. Cheers!
$XRP donation wallet: r3qf2nALyhFwC46QqZ5gJHpF3cjr5gRcoV
Trade XRP Memes here:
https://firstledger.net/?ref=6NRu4StwrImq
Trade on MEXC: https://www.mexc.com/register?inviteCode=mexc-1etb1
Trade on WEEX using this link: https://www.weex.com/login?from=https%3A%2F%2Fwww.weex.com%2FnewbieActivities%3Fid%3D520%26type%3DBEGINNER_TASK%26vipCode%3Duspf
Trading Different (Liquidity Map) - https://t.co/3ks3QMT5VJ?ssr=true
No posts
Comments
Nothing yet. Say the first thing.
Sign in to join the conversation.