
The content below represents the personal views and opinions of the authors. It should not be considered as investment or financial advice.
First off, this week, I want to say, we fucking nailed this call on the Japanese yen against the US dollar.
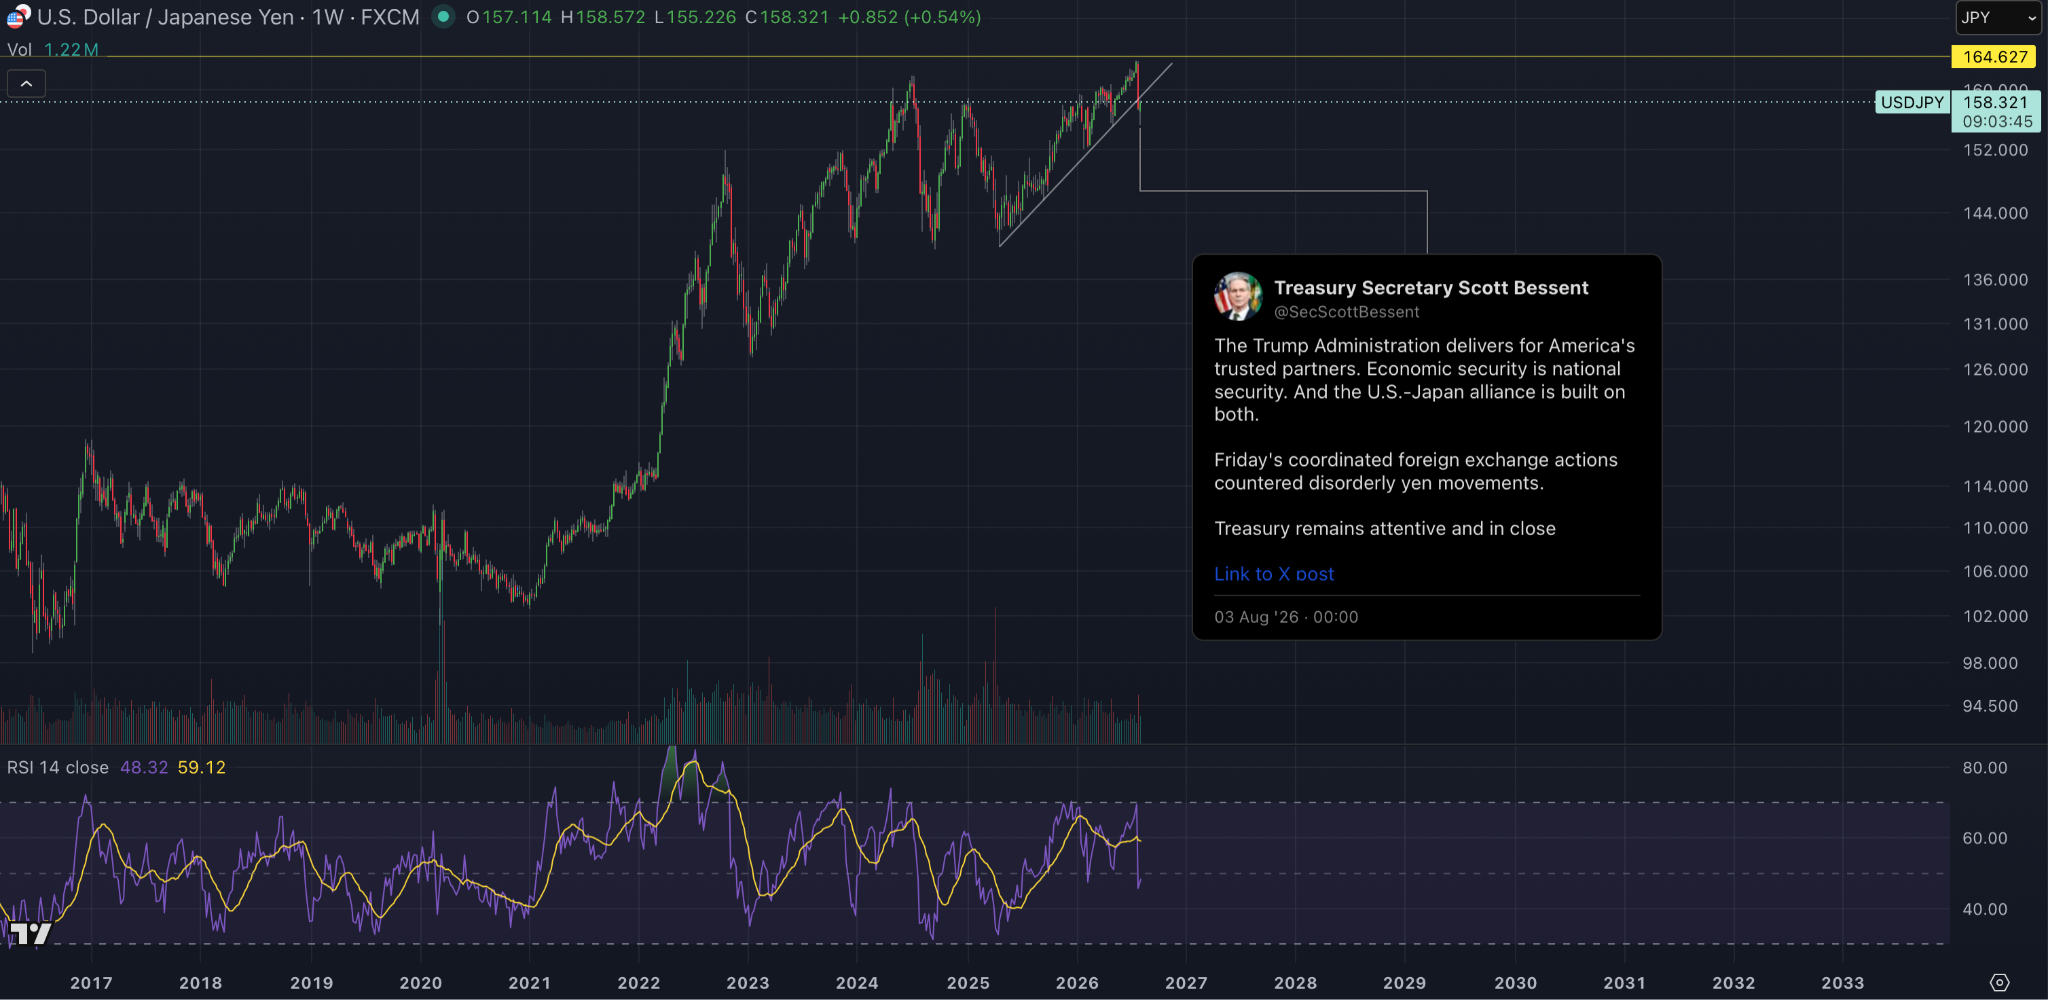
We literally drew our line in the sand at 164.627. Last week, we got to 163.938, and then we saw coordinated effort from the US and Japan, at least verbally coordinated effort to manage their FX market, if not intervention.
Now, obviously, there’s been a number of 6 trillion yen floated that was supposedly bought back to strengthen the yen, but we are yet to see massive confirmation. We also saw the Korean won be strengthened as well, or at least an attempt to strengthen it.
And essentially, this is everything we’ve been calling for.
Why is this important?
Well, it means that they’re not ready to let the system go yet, which means that inevitably, our thesis about being bullish on crypto at some point soon is probably starting to come into fruition. It’s showing that not only are they willing to pump money into the market, but they’re also willing to do it together.
And this is exactly what we’ve been looking for to say, look, is the system still backstopped by the same rules that it has been since the 2008 financial crisis?
And the answer is yes.
The answer is yes, meaning that we are going to get a big bull run, in my opinion. It’s going to be bigger than people expect at some point.
Does that mean there’s not any more short term pain coming? I personally think there could be some more short term pain for some crypto, but we’re very, very close to, if not already at now, the exact bottom.
I think crypto are setting up some different structures. Tokens like ETH and Bitcoin, I could definitely argue have their lows already in, whereas XRP and Doge, which we’ve discussed in previous newsletters, I could see having another flush down.
And it’s just so exciting that we’ve got everything absolutely bang on so far.
The other thing that we’ve been discussing recently is gold. And we said, look, I think gold lows are in. I said that about three weeks ago. And again, gold has started pushing out of this pennant pattern it’s found itself in.
Gold found a significant low and has started to pump in this last week. This last week alone, gold is up 7.68% from the lows.
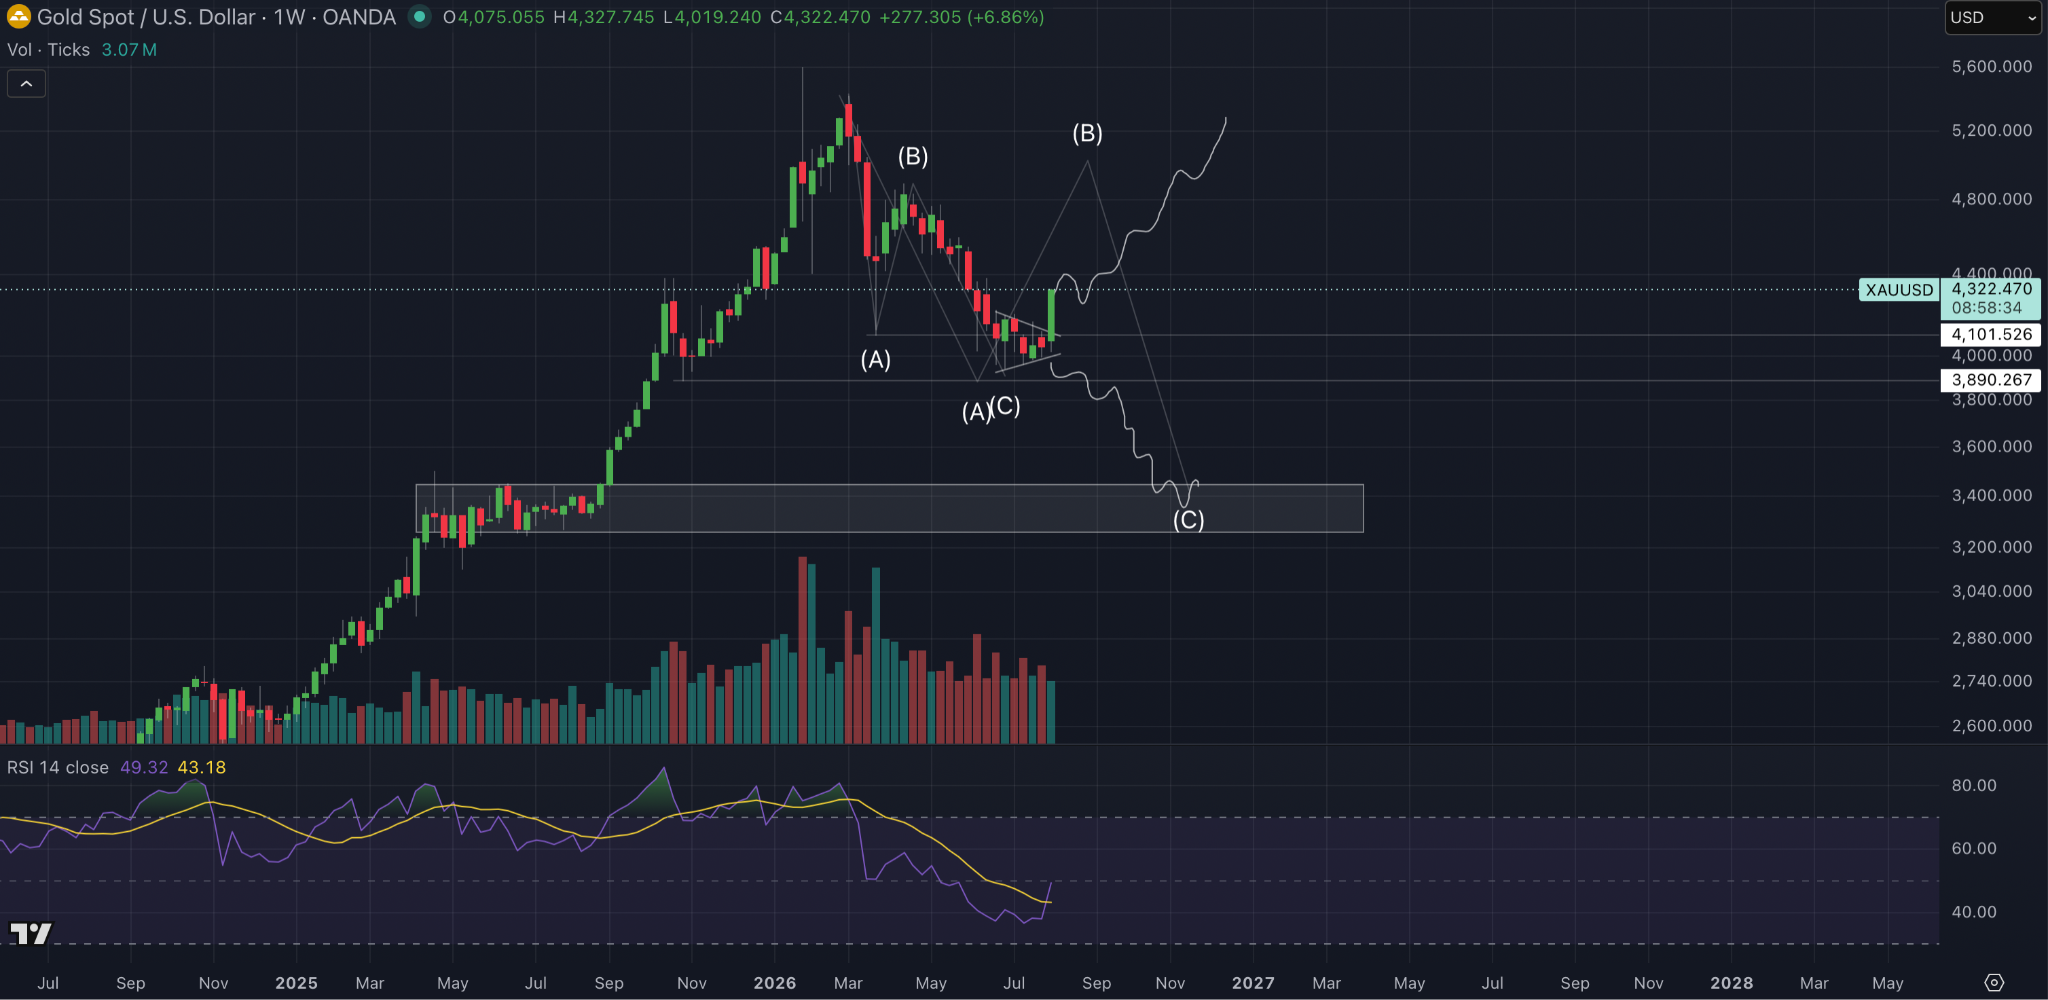
Now, are the lows in for gold? This is a question that I’m exploring myself at the minute. And what does this mean for the wider markets? We’ll get into that at a different time, but we’re just looking at this from a trading perspective only.
Are the lows in for gold?
There are two discussions to be had here.
I think the first discussion suggests, or could suggest, that we’ve completed an ABC correction after an impulsive move up for gold, and we’re ready to make another impulsive move higher. I think that’s a fair discussion.
Again, I haven’t done the macro work on this at the minute. It’s not my main focus. I’ve just been watching it from a technical level and seeing how it responds at the lows. We flagged some bullish divergences on the lower timeframes a few weeks ago, and that’s why I said I thought the lows could be in.
The other discussion is whether we’ve got a continuation, whether we’ve just completed an A leg of an ABC, and then we’re going to have a continuation down to what I think would be key support between $3,450 and $3,250.
Now, I don’t know which one of these plays out.
If the second scenario plays out, I still think gold probably rallies above to that $5,000 region. If you can see the first ABC that I’ve got drawn in, I think that if we’re going to play the second scenario where we have a deeper pullback, the B leg of this and this retracement leg will still go above those local highs. I think we’ll sweep that liquidity there before we maybe come down lower.
So that’s my first thought process here.
Again, though, this corrective period could be over. We’ve held a key swing low before setting our all time highs. We’ve currently held above that as support, so this is technically a higher low here.
So I could see gold rally into new all time highs here as well.
Interesting to watch, especially with the weekly bullish cross coming in on the RSI and the breakout of this pennant pattern at the lows.
Something we flagged three weeks ago was that I thought gold looked like it was going to get moving again, and it has, one way or another.
Again, no complete confirmation, but I just wanted to touch on that.
Moving on to crypto, I know that’s why everybody’s here, but I like to preface my crypto section with what I think is going on in the wider world.
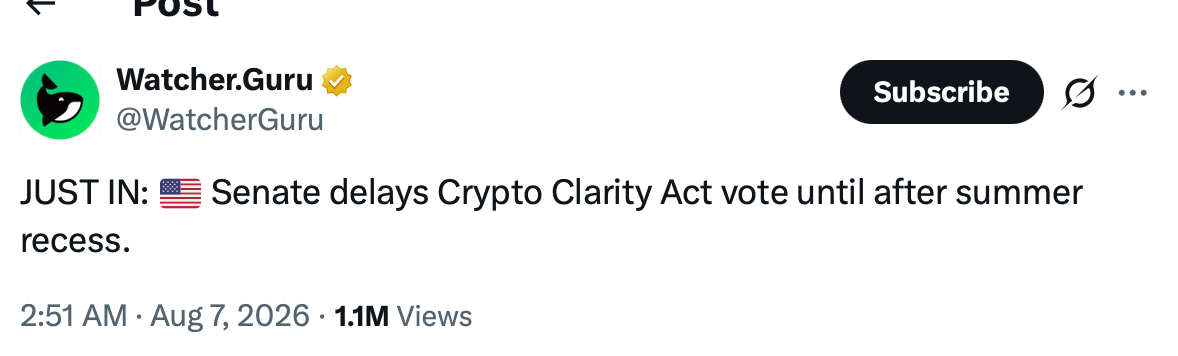
We just had confirmation that the Senate won’t be voting on the Clarity Act until after recess. Now, I think this decreases the chances of the Clarity Act passing by quite a lot.
However, when you get news like this at the lows, as I’ve been trying to explain on my YouTube, it does make me more bullish for the future. When you start to get these negative news stories coming in right when the price is at the lows, and the price responds positively, that’s something I pay attention to.
For example, today Bitcoin is up, and we’ve had that news. So is ETH.
Now, it’s Friday, and all the normal Friday antics are probably going to be underway with Trump and co., Iran, etc., so we can’t get ahead of ourselves. But these are the things that make me start to think we’re definitely closer to the bottom than people expect.
I think we may even already be there, as I said, for Bitcoin and ETH.
When you get this news and we see green candles, you start to look at it and think, well, what else could possibly flush the price down?
Potentially, sellers are exhausted.
If we look at Bitcoin’s structure, what do we see?
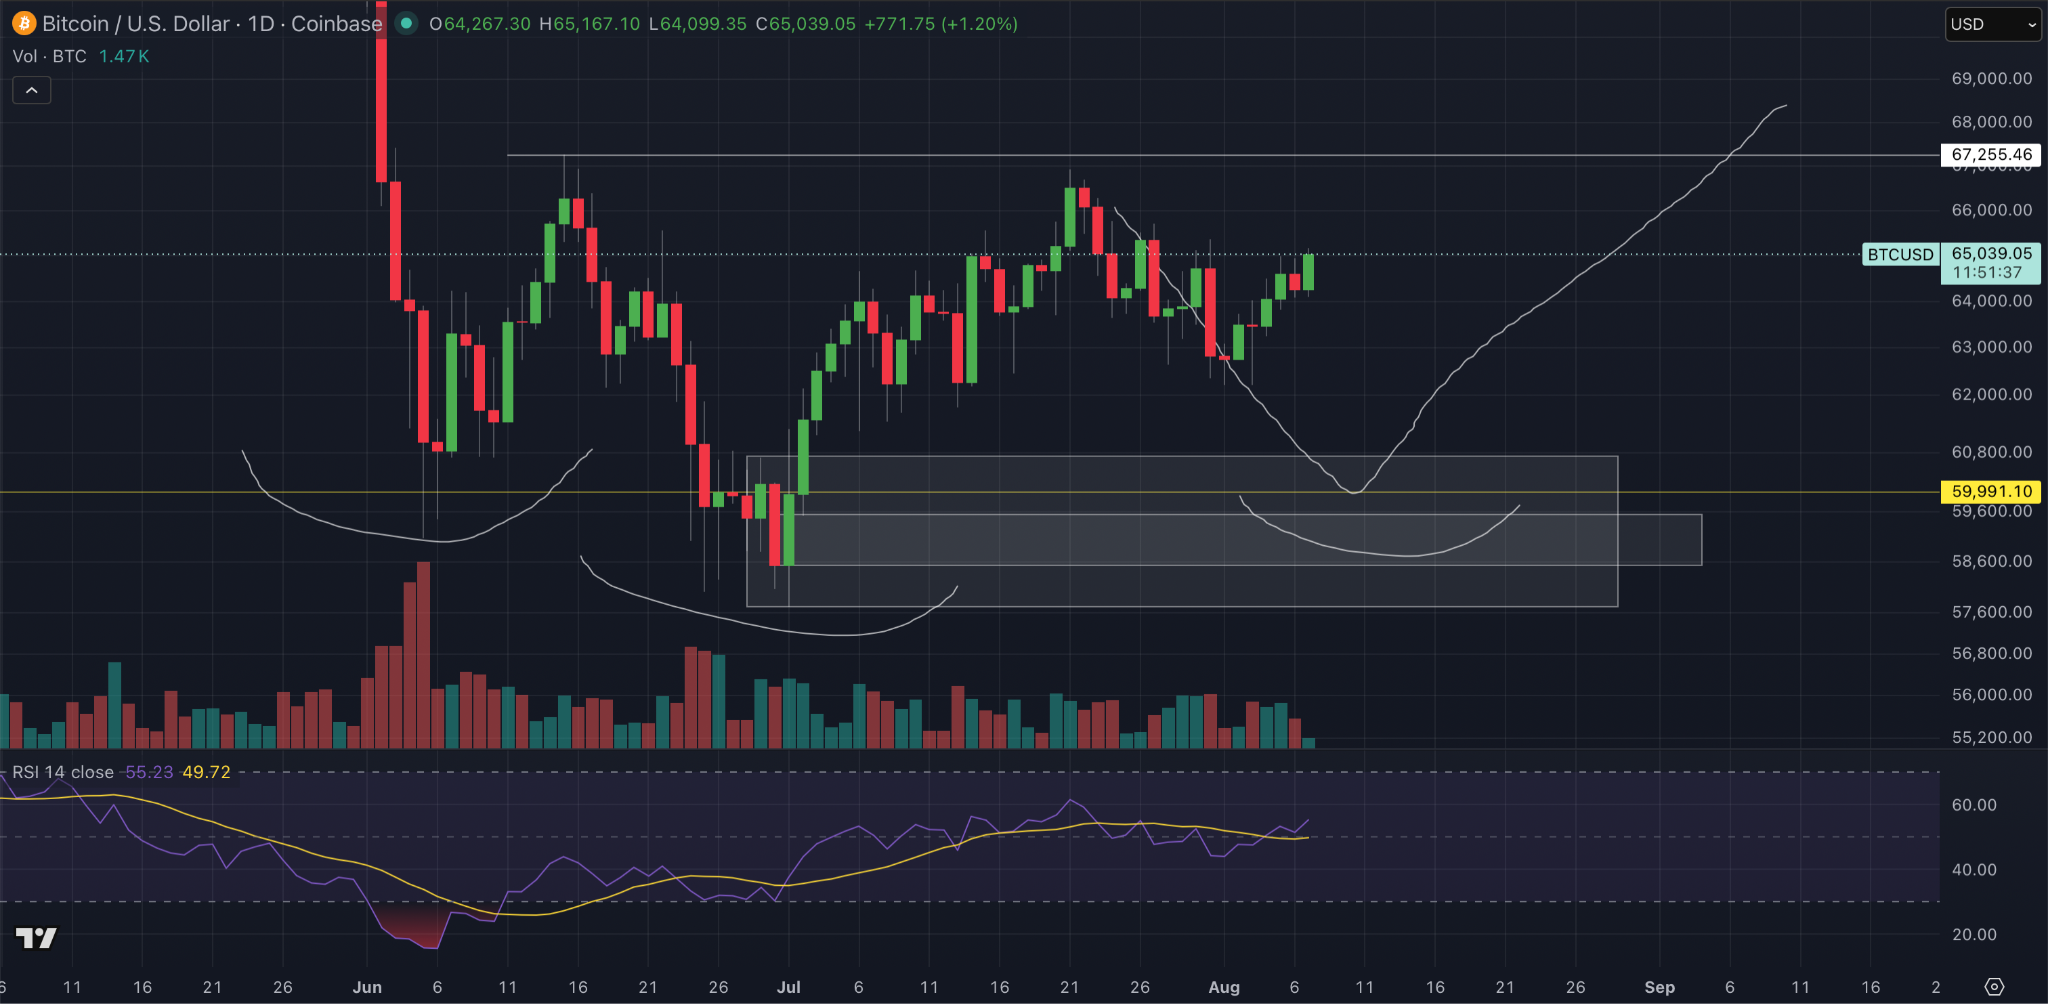
Well, I’ve been discussing a potential triple tap low. I did think, and still do think, Bitcoin comes below that $59K level to mark this bottom. I’m still in that camp right now.
There is definitely an argument now to be made that Bitcoin has made a higher low here and could continue to the upside, although I don’t think we’re seeing big supportive green candles yet. But that could just be while we work the range out. When we start to get towards $67K, we’ll have to see whether we start to see bigger candles coming in or not.
We have taken the majority of the daily downside liquidity on Bitcoin, and similarly on ETH as well. So I can see the argument to say the lows are in here.
Whether we are making a higher low here or we’re going to have to come down to where I’ve targeted, I still have to stick with my original plan. But I’m not going to say that we couldn’t have formed our higher low here around that $62,200 level and now be climbing up. There’s definitely a possibility.
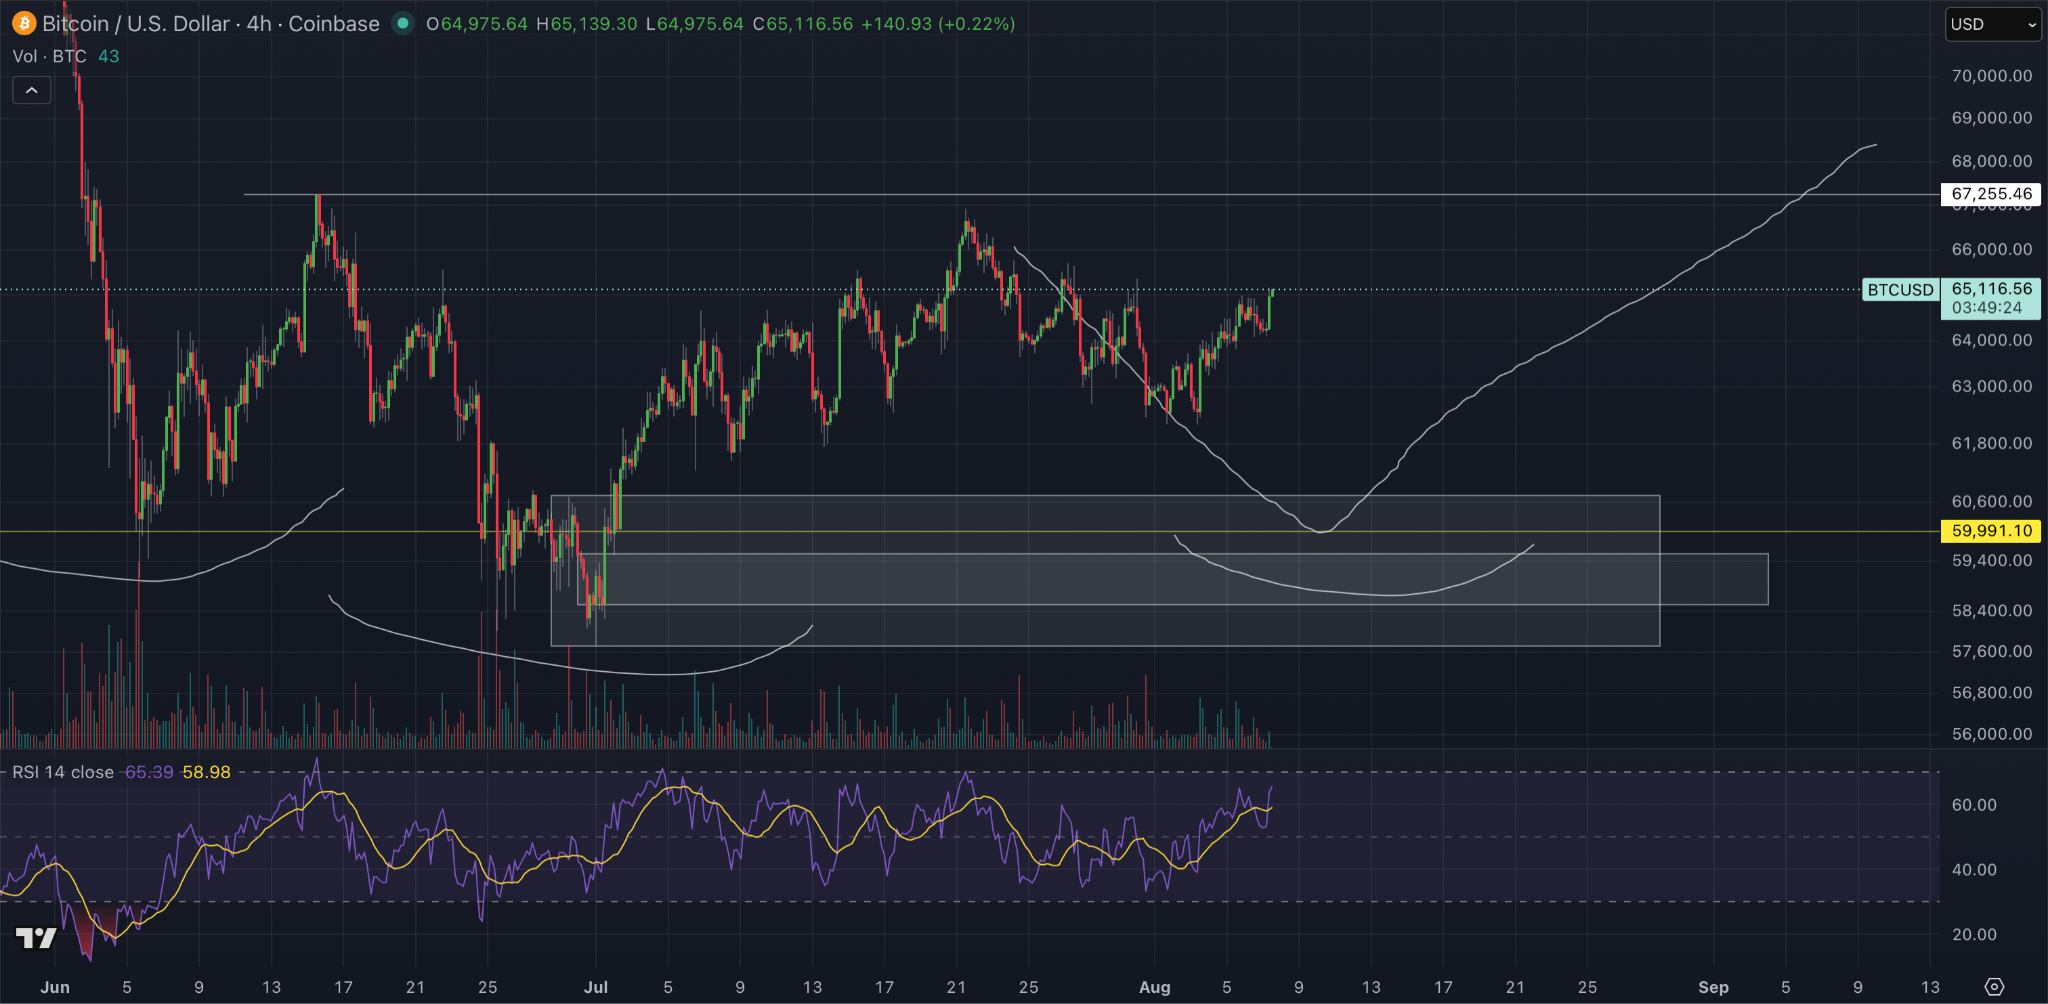
However, when we look at the four hourly, so looking a little bit more closely at this, when we start to get towards these overbought areas on the four hour RSI, as you can see at the bottom of the screen, we do start to get a sell off or a cooling in the move that prefaces a sell off.
And we are getting up towards that level again, and as I said, not with massive volume.
So let’s see what happens. Again, with it being Friday, it’s a difficult call to make. But I’m still expecting a potential retest of the bottom of this range for Bitcoin.
Although with the news around the Clarity Act and what’s happening in the Japanese markets, I can’t say for sure whether we will get that flush now.
I think that with this bad news and prices going up, these sorts of things coincide with bottoms sentimentally. It’s just whether price action follows, or whether we’ve already had that sentimental flush out for Bitcoin.
On a technical level, there’s a very similar story here for Ethereum. Ethereum broke out of its range lows, broke the high of that range, and has been holding above that as support, as you can see on this chart, at about $1,850. It’s been holding as support since the 15th of July.
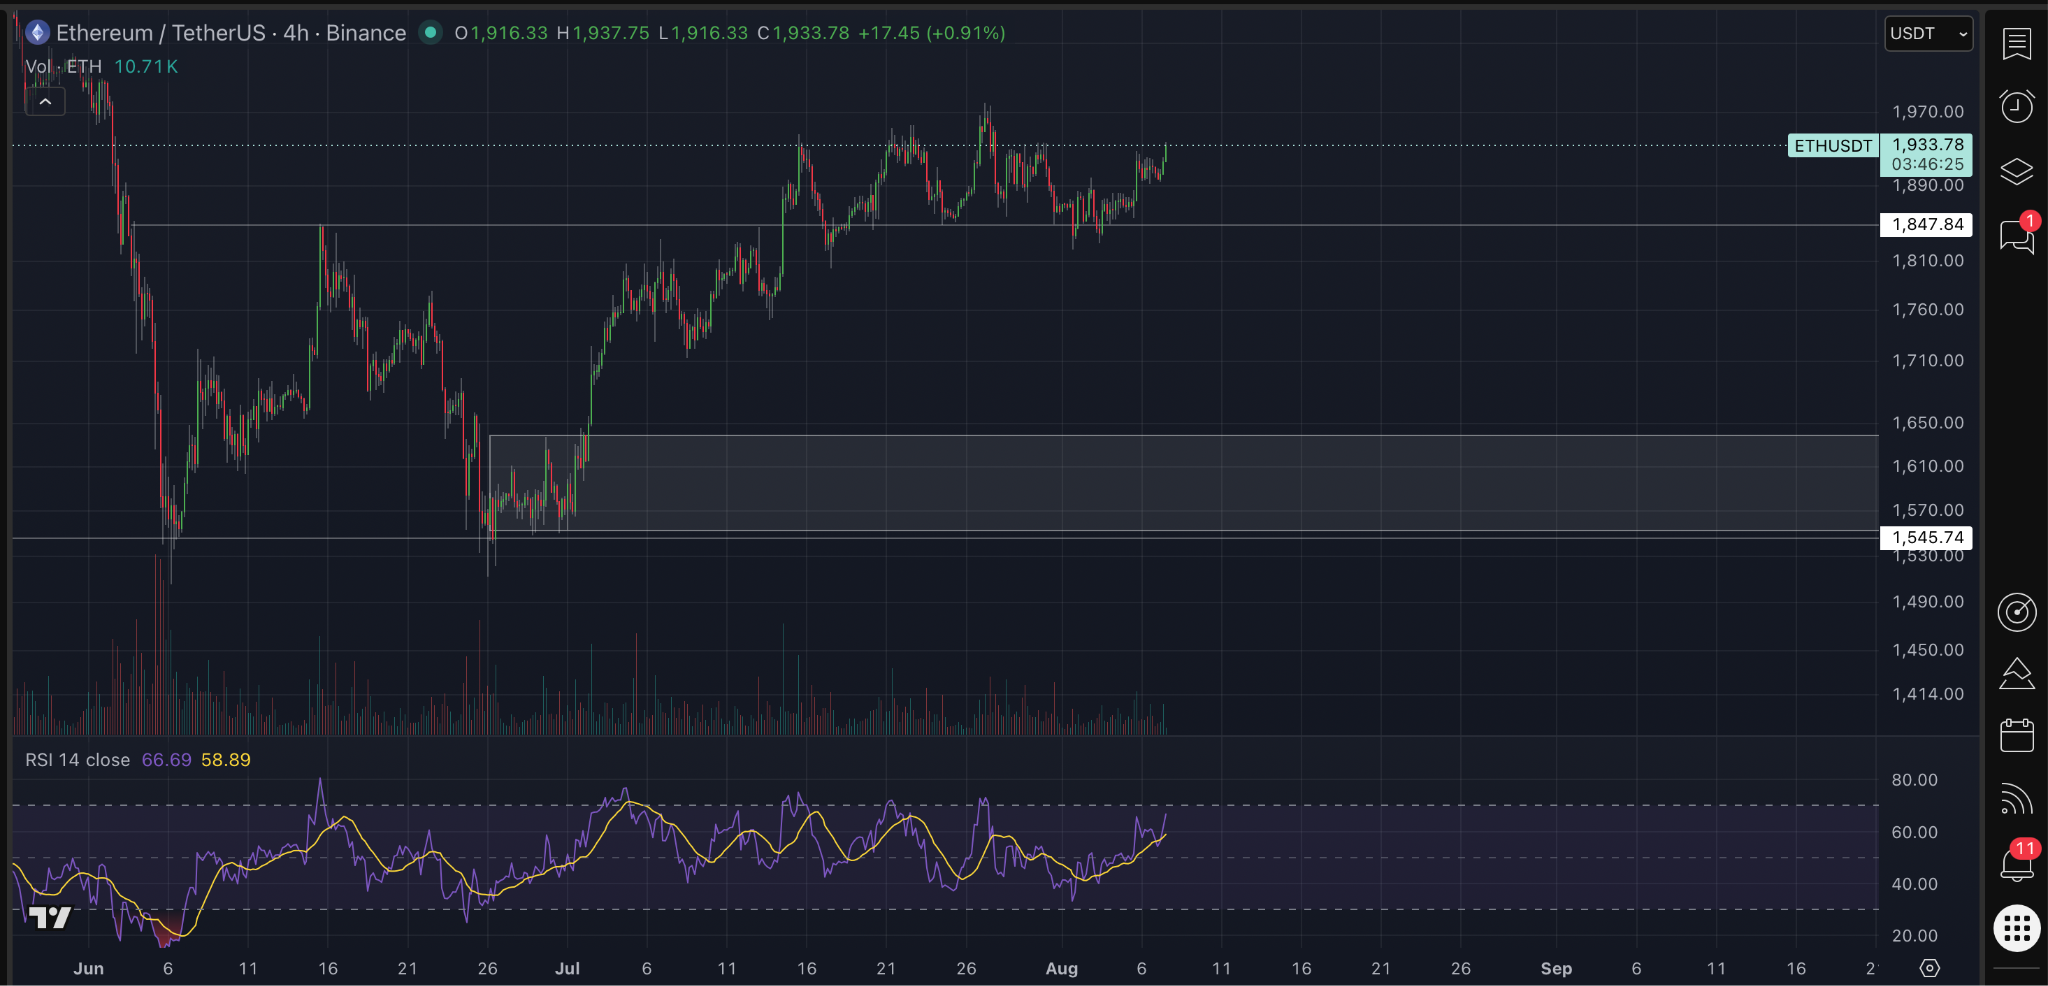
However, since then, if you look at the RSI, it’s slowly making lower highs, and that indicates to me that momentum is running out.
Now, today, we are actually rechallenging our local highs, as in our potential lower high, to potentially break through and make a higher high here, indicating that ETH could have some strength into the weekend.
But I still have to lean towards the fact that every single time, if you look again at the bottom of your screen at the four hour RSI, that we get to the overbought area, ETH has a pullback, or at least cools down a bit.
And we’re very close to that right now, again, as we approach this $2,000 range for ETH, which I think is going to be a bit of a psychological target to see whether bulls have strength or whether it’s just a bit of a relief rally.
Now, again, for ETH, I still probably sit in the camp that we do pull back to the grey box at the bottom of your screen, sweep the liquidity below us, convince everyone again that ETH is going to go lower, and then potentially head higher from there.
Could I be proven wrong? Of course. We have held support above a range and have chopped around here for a while.
Is this accumulation or distribution?
The answer is, we will know when we start to get daily closes either above that $2,000 level or below that $1,820 level.
This discussion is significantly different for XRP, unfortunately. I know we’re all big XRP holders here, including myself. It’s my main bag by a country mile. But we’ve got to be realistic with what we see on the XRP chart.
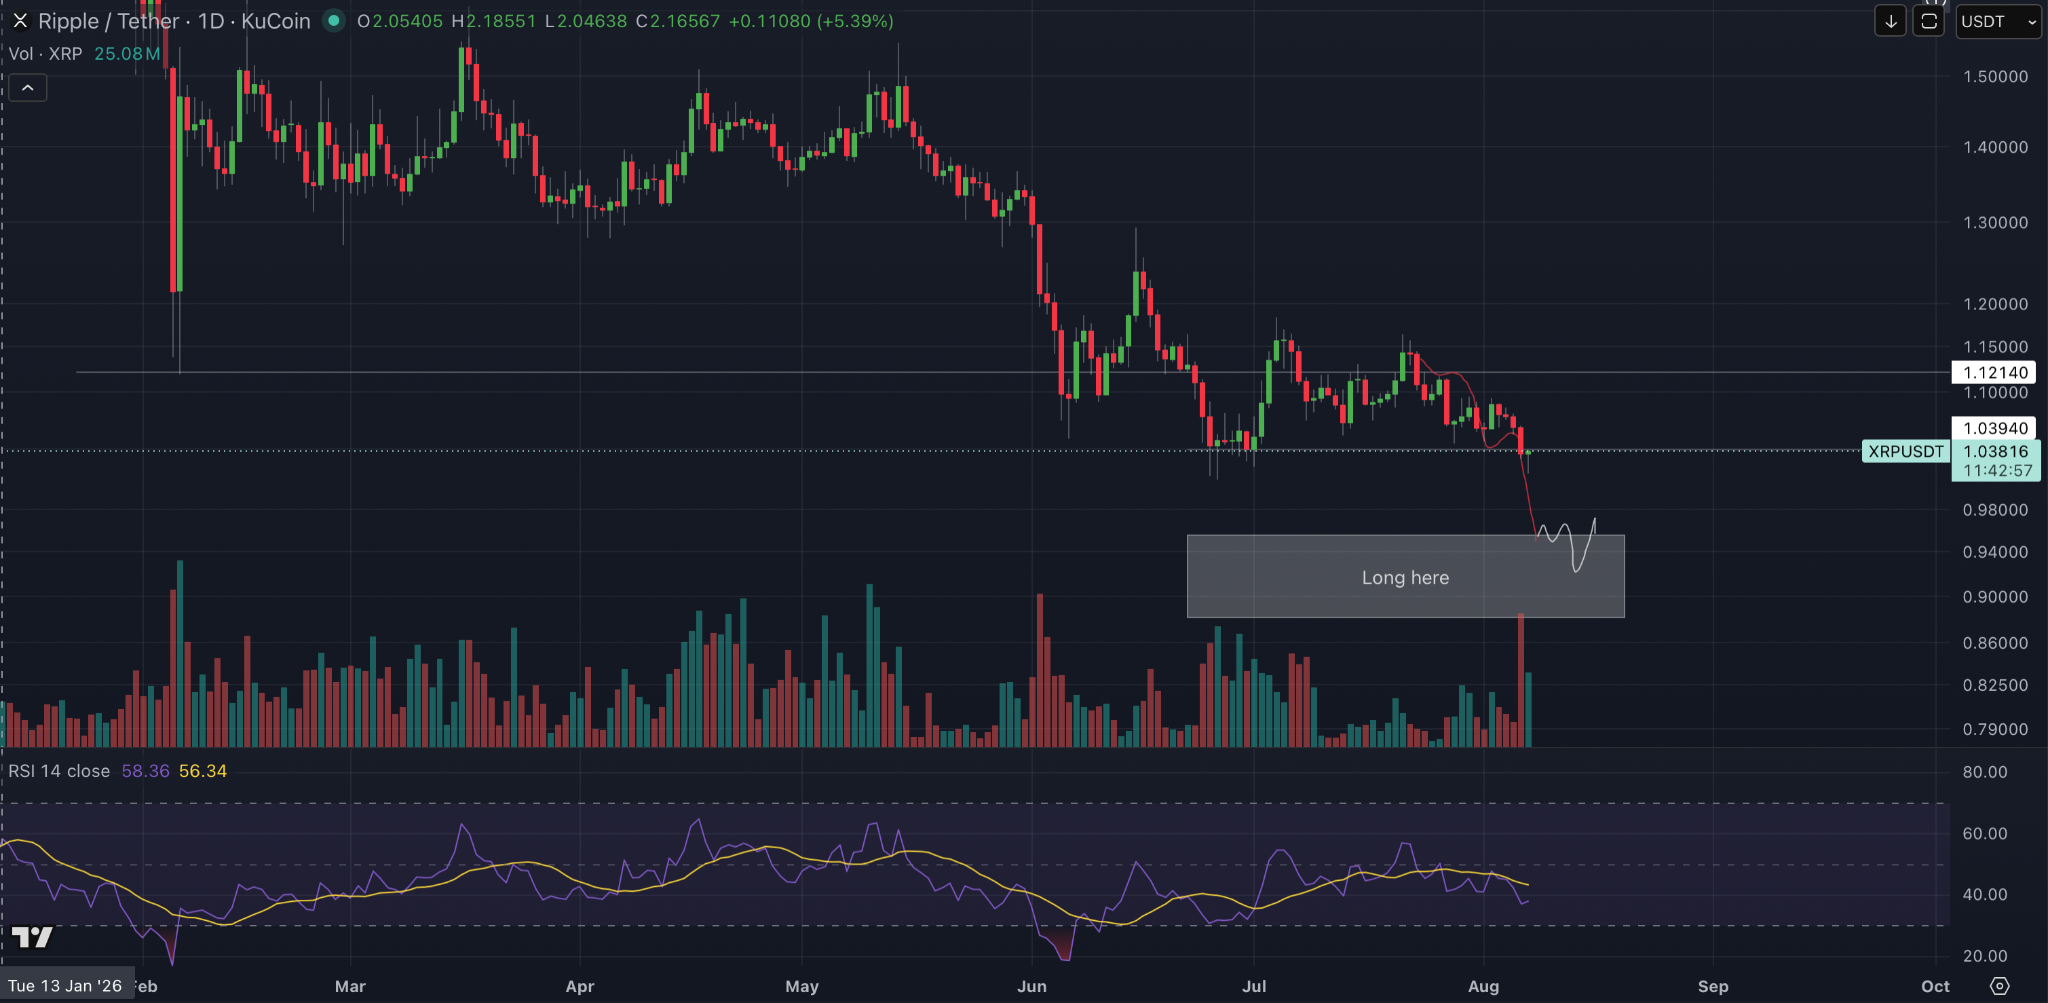
Yesterday, the XRP daily candle was the lowest daily candle close since our move up in November 2024. So XRP, to me, is signalling there’s still downside to come here.
As ETH and Bitcoin, as I’ve argued, could potentially be setting higher lows and are trying to push range highs, XRP is pushing range lows here and closing below these range lows and key levels.
I’m still targeting this long here box, which is between $0.88 and $0.955, for my potential leveraged longs. I will be going leveraged long there.
The reason for that is essentially liquidity, but also, as you can see structurally here, price is continuing to fall while the RSI is trying to pick up. It’s trying to create what could be bullish divergences. However, you can also argue bearish divergence on the daily, as price is making lower highs and the RSI is making higher highs. That’s a hidden bearish divergence there for XRP.
I still think the push down makes more sense than a push up here for XRP.
And that is also what I’m putting into that box with Bitcoin and Ethereum. Could they come down to their higher low levels at the grey boxes that we’ve discussed above because XRP is indicating that there’s downside to come, or a new low for XRP? And with that, would that mean that Bitcoin and ETH are going to have a pullback within their ranges?
That’s what I expect.
Whether that definitely happens or not, and whether XRP is losing strength or not, I don’t know with the Clarity Act news coming in today. The fact that XRP has already got legal clarity kind of makes for a bit of a weird environment, but those sorts of environments are also where bottoms can be found.
So I’m not saying this is a definite. I’m just explaining where I think we are.
Especially with yesterday’s daily close supported by volume, I think we’ve got further down to come.
And now let’s have a look at liquidity to see if that backs up my thought process.
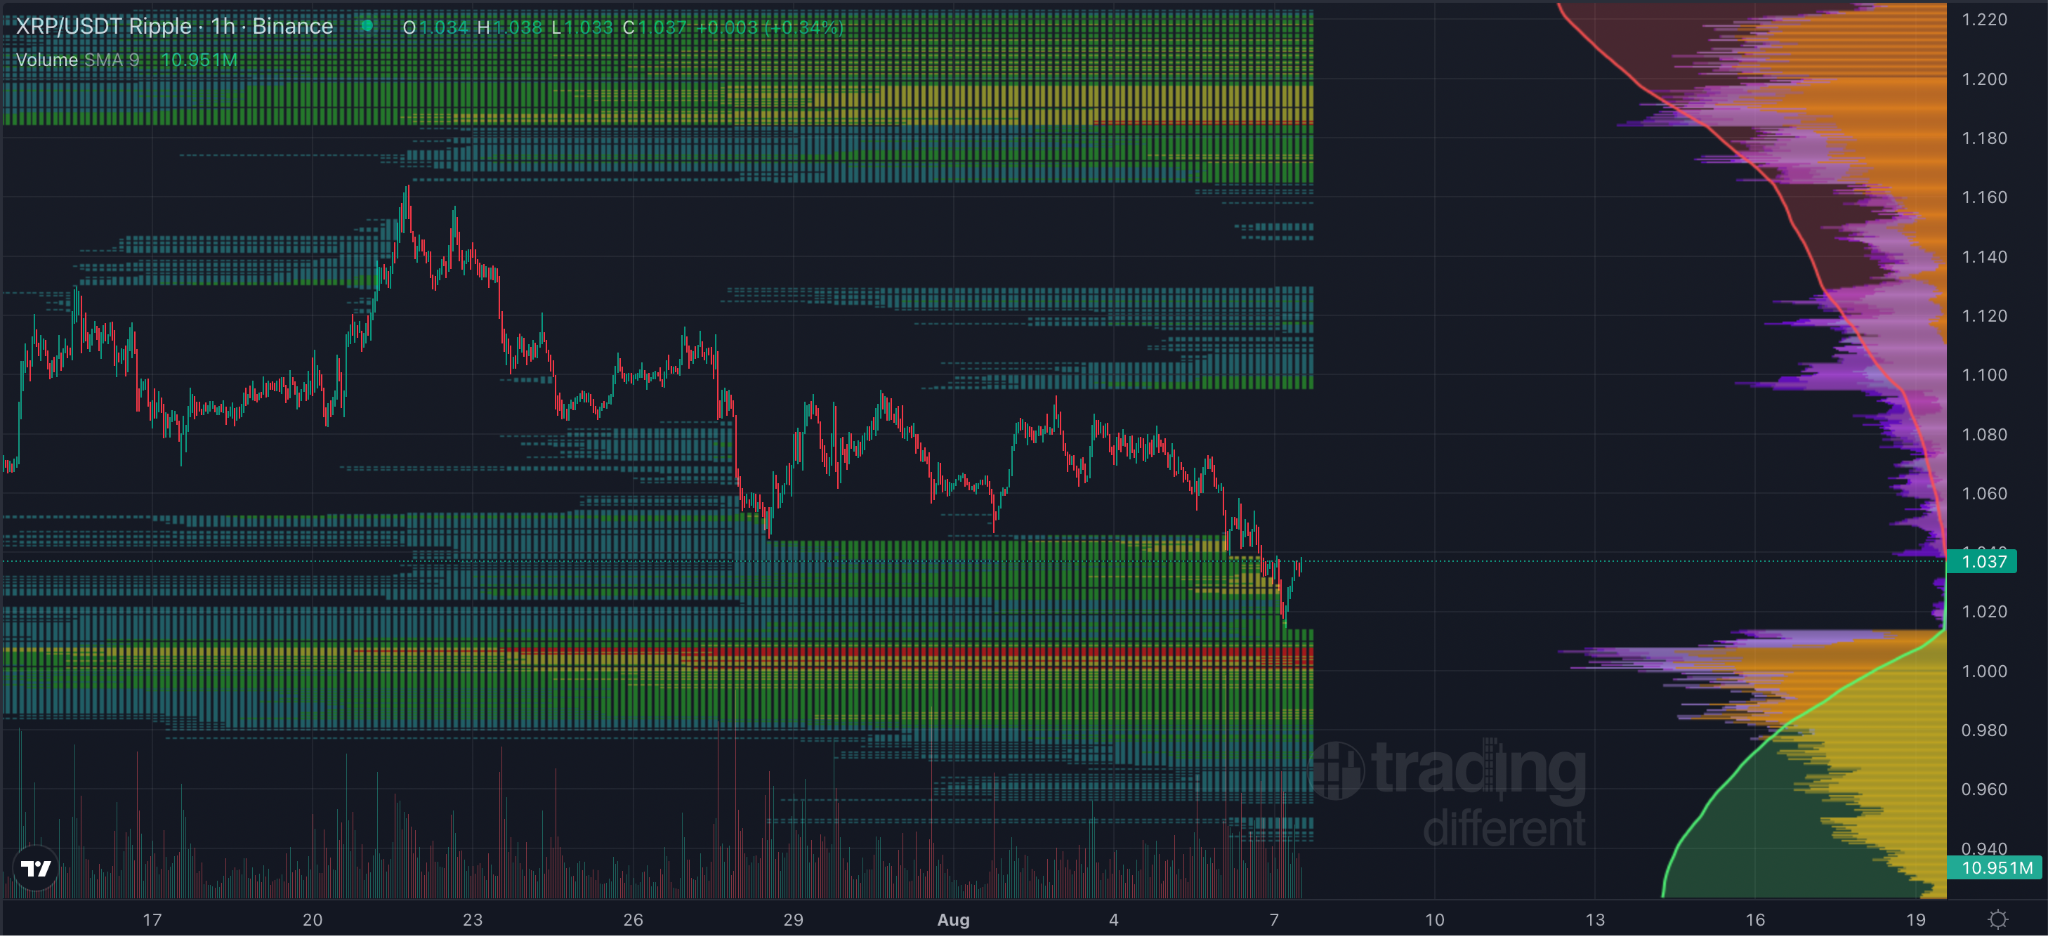
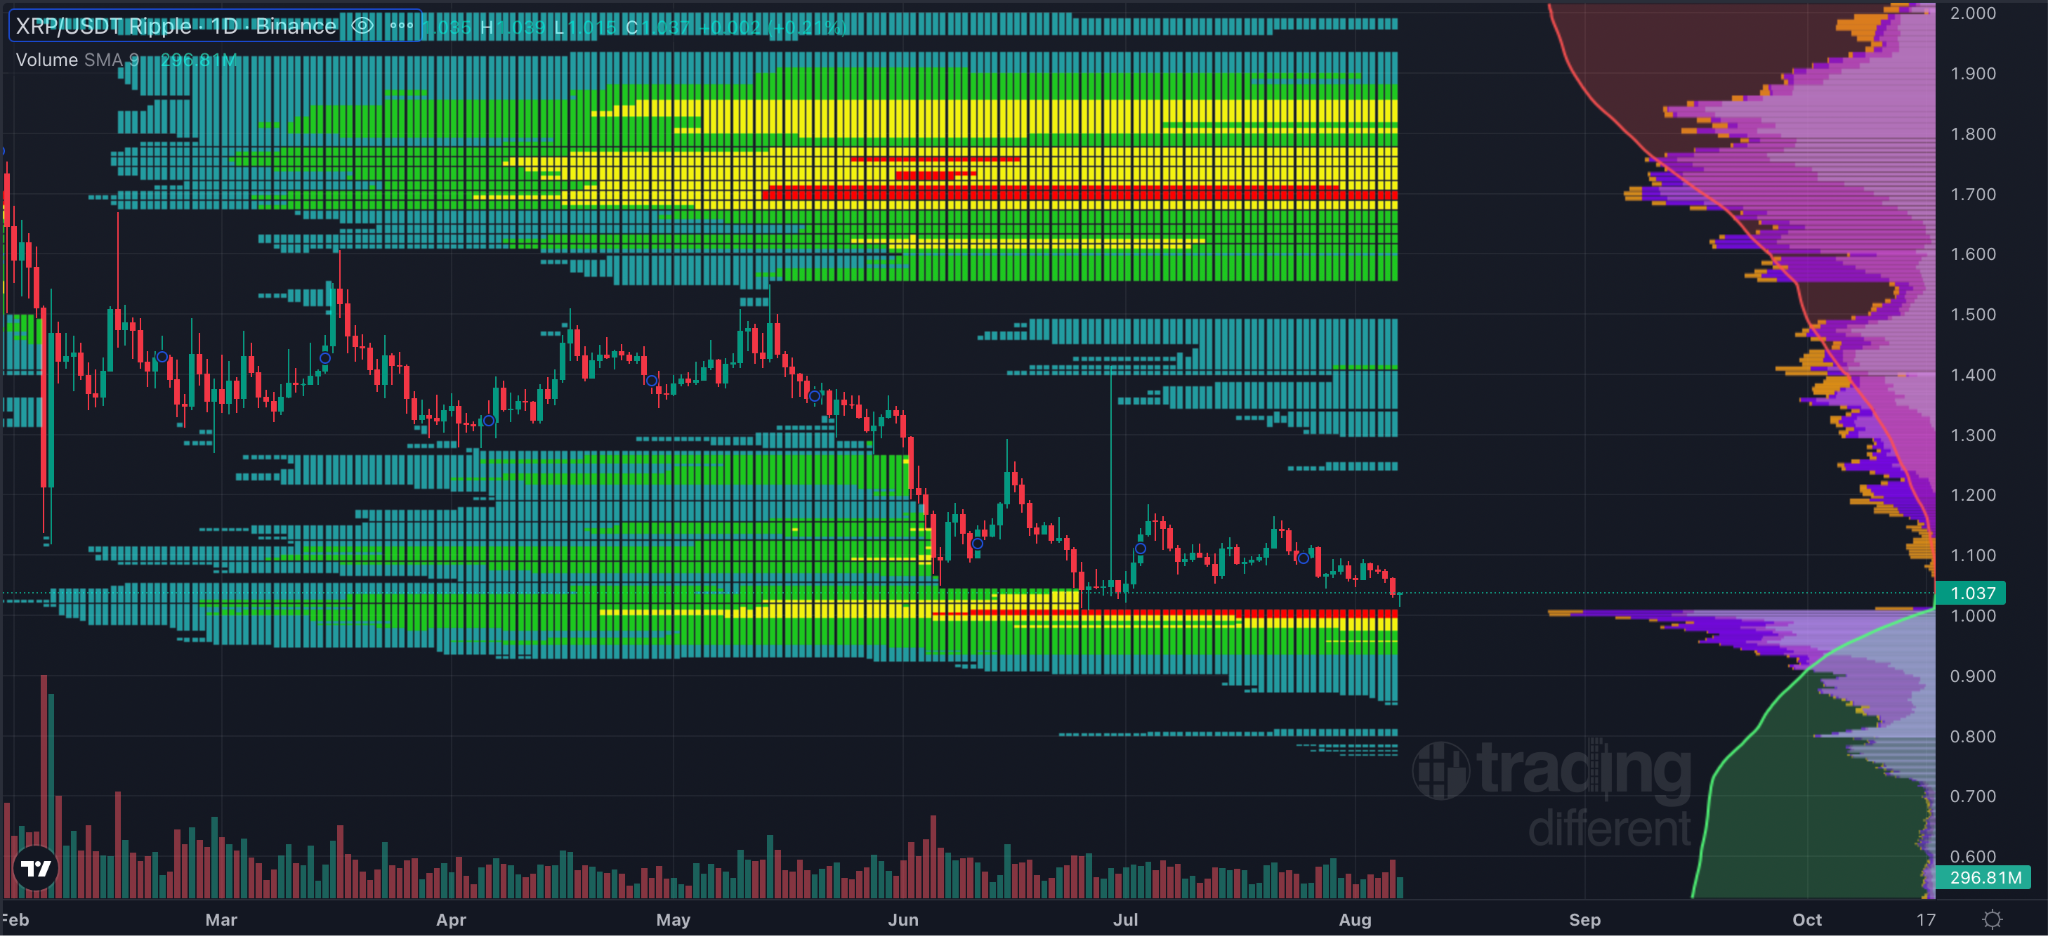
Okay, liquidity. I’ve posted both the hourly and daily charts here.
What we can see is, on the hourly, we still have a big band of liquidity at the $1 level, with growing liquidity since we’ve got towards these lows. That’s people trying to jump in long just as we get to the lows.
Does that have to be taken? No. But do I think it will be taken? Is it a magnet for price? Yes.
Would it make me feel better if we take that too? Yes.
If we look at the daily liquidity, again, we’re right next to that deep, deep liquidity. Have we swept it yet? No.
So, would I want that to be taken? Yes.
Otherwise, it’s going to be a repeat of that $106K Bitcoin level from the summer. I think it was around August of last year. I said, look, the $106K is an important level here. There’s liquidity just below us, and we can’t seem to get it.
Then, as soon as there was a catalyst that made us take that liquidity, which was October 10th, we had a liquidation event.
And that’s what you want to avoid.
If we take this liquidity now, then I think we avoid a liquidation event in the future, personally, for XRP specifically, if we’re looking at these charts.
So, does it have to take these levels right now? No, it doesn’t, of course. It can rally up to $1.80, and then we can just be sitting there like, well, was that a relief rally? Was that just to squeeze some shorts out of the market? And are we going to come back and take that dollar?
That will be the question that I will be asking if that happens.
However, if we sweep this $1 level now, all I’m going to be saying is the bottom is in here, or just about, and we’re going to march up higher.
Because look, the only liquidity that we’ve got left is above us, and that’s where I want to be in a week or two weeks’ time.
I just wanted to throw in Doge again this week, but with liquidity.
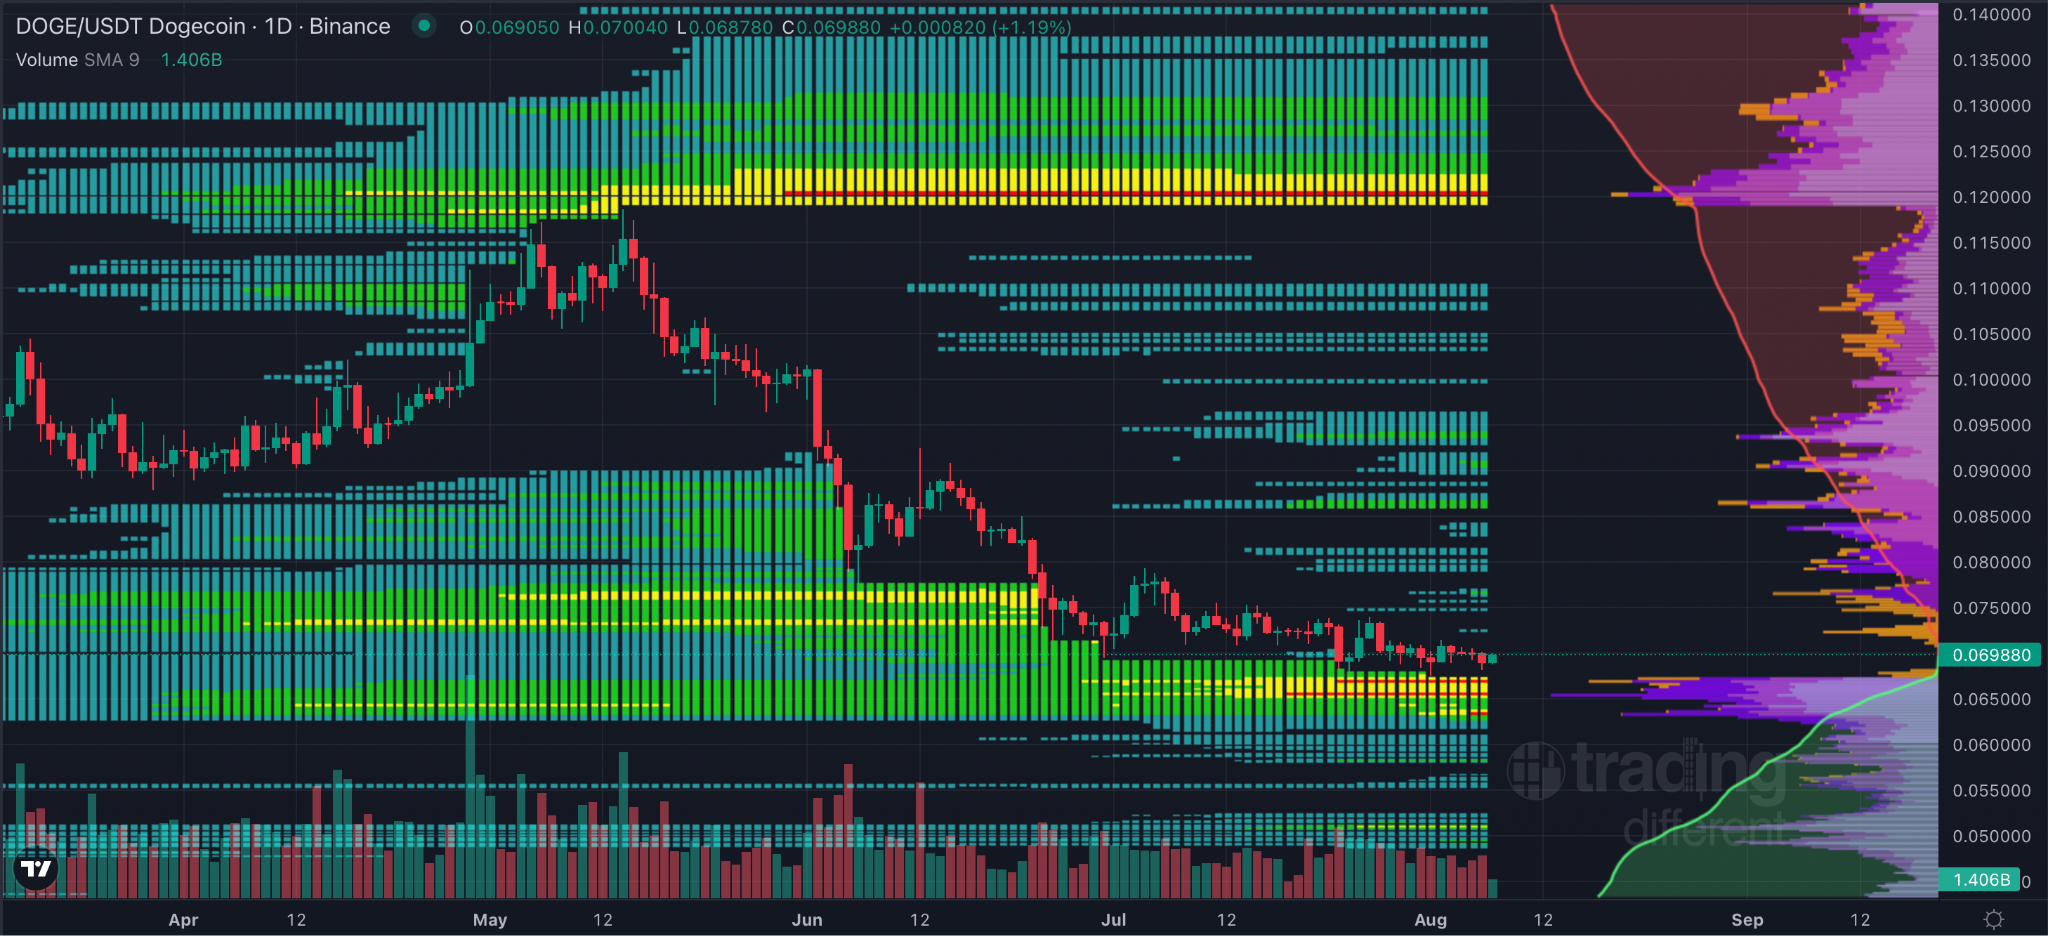
I showed you the Doge structure two weeks ago in the newsletter. Go and check that out because I really deep dived into why I think Doge is a good buy at these levels.
These liquidity pools on the daily reinforce what I was saying. I think Doge comes down to around the 6 cent level, between 6.5 and 5.5 cents, and that’s what this daily liquidity chart is showing.
Then we probably get some sort of relief, at least up to 12 cents, which would be around a double. Realistically, I actually think we go much higher than that if we can sweep this daily liquidity.
I think that could be the local low. It would make a higher low on the overall structure, which is what I’ve been discussing, into a great accumulation range.
Then you’re probably targeting, at the very minimum, the 30 cent level, if not new all time highs.
But that’s a discussion for if or when we get this rinse of the lows and what we start to do after that.
Last week I was looking at stablecoin reserves sitting on exchanges. This week I want to go one level up, because it is not just the exchange balances shrinking. The supply itself is going.
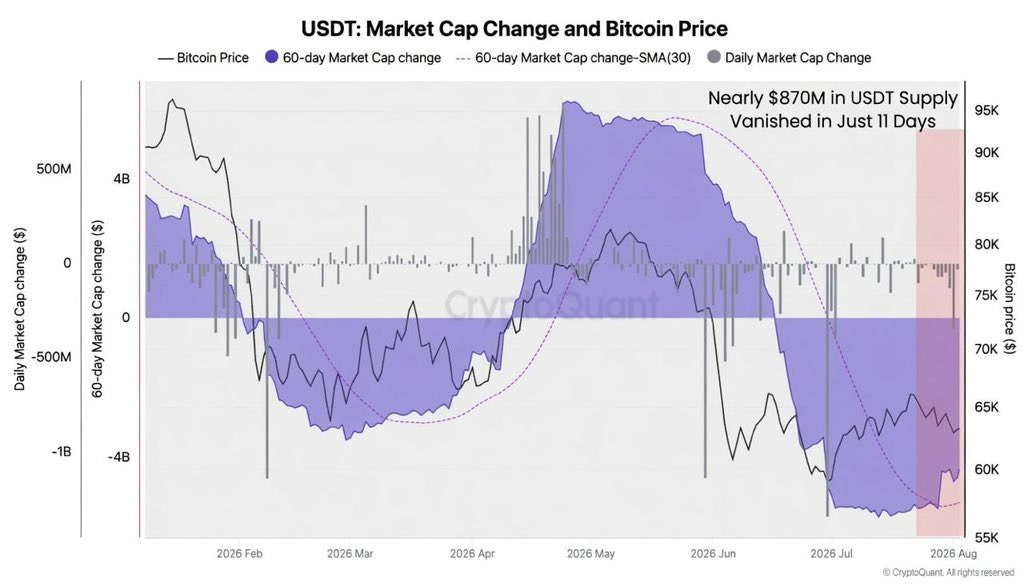
The purple band is the 60 day change in USDT market cap and the black line is bitcoin. Nearly $870 million in USDT came out of circulation in eleven days. That band has been under water since the start of June and it is still under water now.
You can argue this both ways.
The bear case is the easy one. Stablecoin supply is the fuel. Tether burning tokens means people are redeeming, taking their dollars off the table and going home. Less supply means less bid, and it lines up with what I said last week about bounces getting sold into rather than continuing. If you want to be negative on this chart there is plenty here for you.
The bull case takes a bit longer to explain but I think it is the better read. Supply does not contract at tops. It contracts after people have already been hurt. The last time it did this properly was through 2022, from around $83 billion in May down to the mid sixties by December. That was not the beginning of something worse. That was people giving up. Supply turned back up in January 2023 and did not stop.
So for me this is another box ticked on the “we are near the bottom” list rather than a warning. Redemptions are what happens once the marginal seller has already sold. And look at the right hand edge of that chart, the 60 day line has started to curl up off the low. It is not positive and I am not going to pretend it is. But the bleeding has slowed, and that tends to come before a turn rather than after one.
On its own it would not convince me of anything. It convinces me because of what everything else is doing, which brings me to the chart I actually want to spend time on.
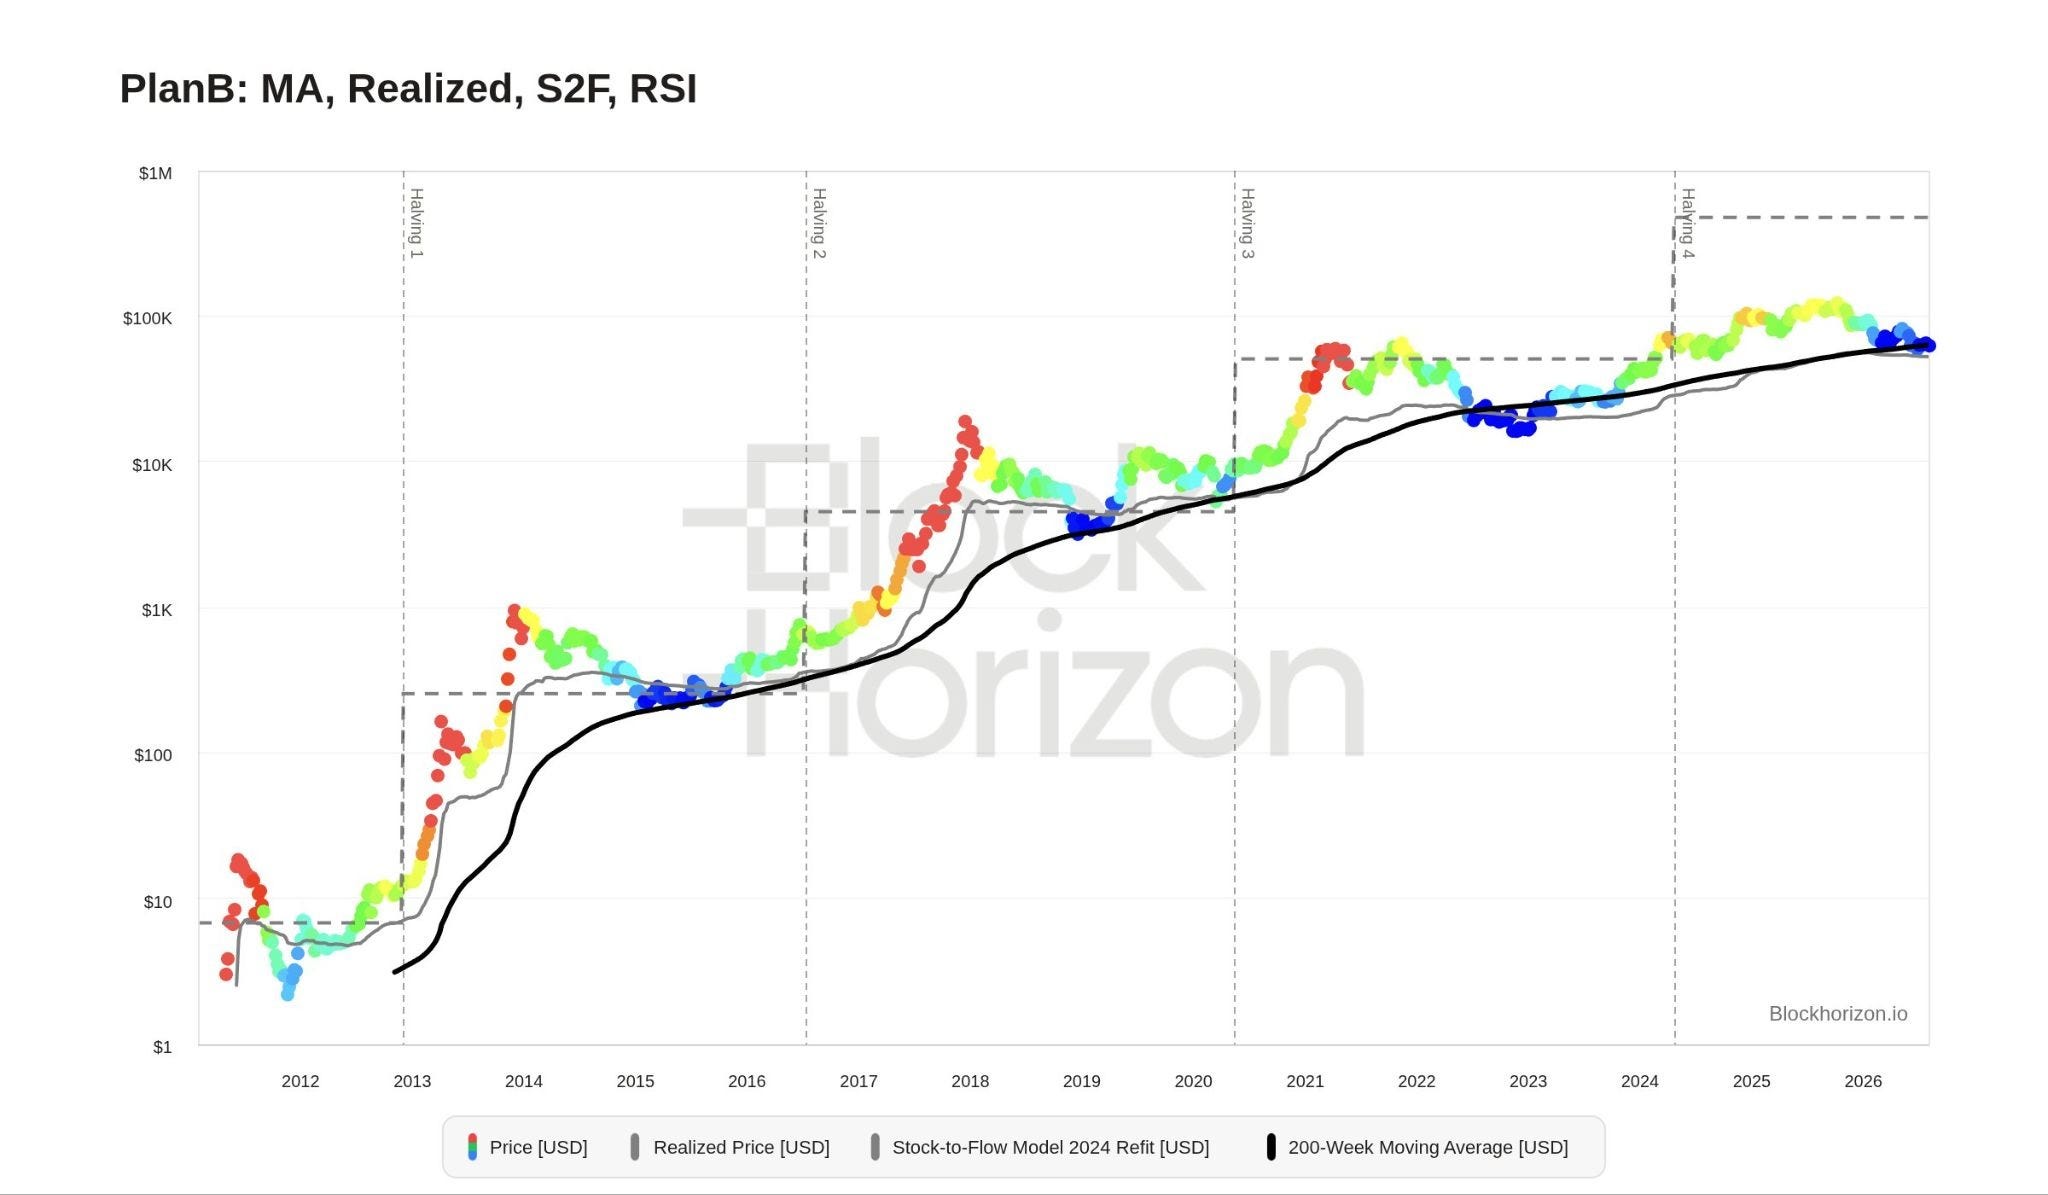
Four things in one image: price, realised price, the stock to flow model and the 200 week moving average. It saves me writing out about six paragraphs.
Bitcoin closed July at $62,818. The 200 week moving average is sat at $63,000. Realised price is $52,000 and still falling. Monthly RSI is 43, so still under 50.
The line I want to talk about is the realised price. That is the average price at which every coin in existence last moved, so think of it as what the market actually paid. Right now that is $52,000 and we are trading roughly 25% above it.
Every cycle bottom has involved price going underneath that line. January 2015. December 2018. Briefly in March 2020. And again in November 2022, when we traded down at $15,500 against a realised price closer to $19,700. It never lasts long. It is a few weeks of everybody being underwater at the same time and then it is done.
So if we do get a flush into the low fifties, that is what it would be. It would be fast, it would be violent, and it would feel like the end of the world while it was happening. I am not calling for it and we may not get it at all. Realised price is still dropping, so that line is coming towards us as much as we would be going towards it.
What I will say is that nothing on this chart looks like a top. Price sat on the 200 week moving average, monthly RSI in the forties, realised price underneath us and closing the gap. Thats what the bottom of a cycle looks like while you are stood in it, which is to say slow and mildly irritating rather than obvious.
On timing, I think the next couple of months stay quiet. If we are getting a capitulation candle it probably arrives in that window. By the time December comes around I think we are talking about the start of a lift off these lows rather than the back end of the bleed. That is not something I would bet the house on. It is where I am positioned though, and it is why I am not in any rush to do anything clever right now.
LINKS:
This newsletter is free because we love sharing our insights with the community. If you enjoy it and find value in our work, consider supporting Pav’s and Will’s Beer/Coffee Fund by donating $XRP to our newsletter donation wallet below. Cheers!
$XRP donation wallet: r3qf2nALyhFwC46QqZ5gJHpF3cjr5gRcoV
Trade XRP Memes here:
https://firstledger.net/?ref=6NRu4StwrImq
Trade on MEXC: https://www.mexc.com/register?inviteCode=mexc-1etb1
Trade on WEEX using this link: https://www.weex.com/login?from=https%3A%2F%2Fwww.weex.com%2FnewbieActivities%3Fid%3D520%26type%3DBEGINNER_TASK%26vipCode%3Duspf
Trading Different (Liquidity Map) - https://t.co/3ks3QMT5VJ?ssr=true
No posts
Comments
Nothing yet. Say the first thing.
Sign in to join the conversation.