
The content below represents the personal views and opinions of the authors. It should not be considered as investment or financial advice.
To start with this week, we have to look at this chart again. Now, this chart is obviously the USD versus the Japanese yen.
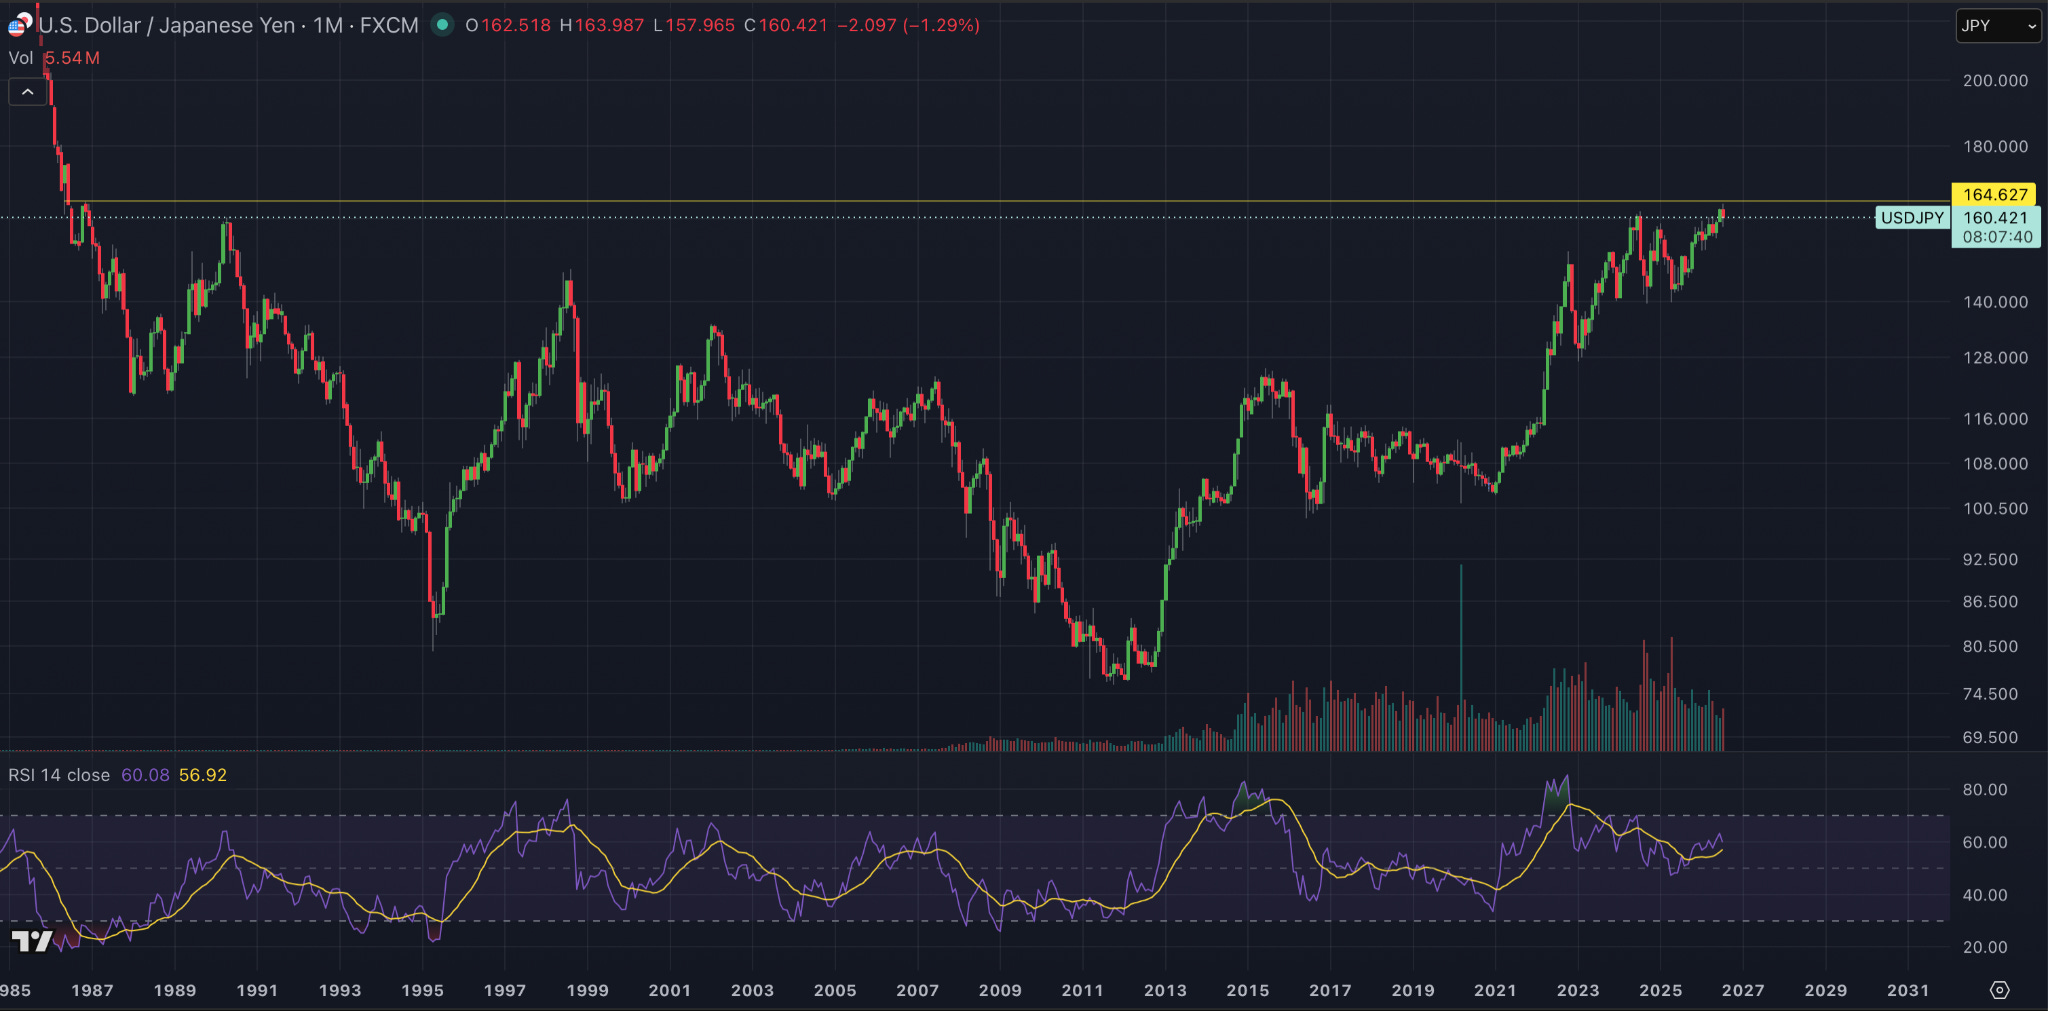
If you look to the right hand side of your screen, we’re on the monthly chart right now. But that little red blip that you can see, or maybe not, is actually the first sign of Japanese government intervention on this chart that we’ve seen in the last couple of months.
It’s estimated that they sold 6 trillion yen worth of dollars in order to buy back the yen to strengthen the currency. That resulted in a 3.4% drawdown in the pair, but currently, from that low, the price has bounced 1.5% again.
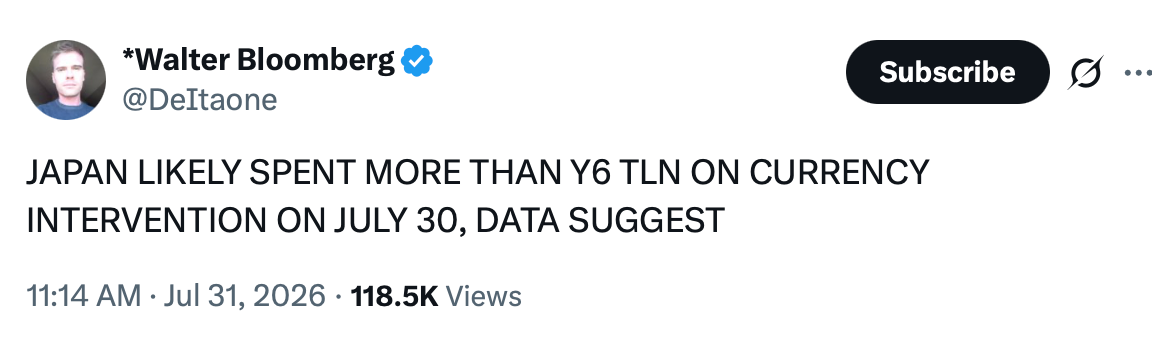
So what I’m saying is, pretty much, for the Japanese government to strengthen the yen by around 1.8%, just for discussion’s sake and nothing else, they’ve spent $34 billion. Obviously, this can’t be a long term solution. This is what I’ve been discussing for a while. It cost $34 billion to move the price around 1.5%, essentially.

So what’s coming next to make this a longer move? Or what is the next move generally for the government? And is there going to be an intervention, or a coordinated intervention between other governments too? Because we’ve seen Korea this week also try to defend the won against the dollar. We know that China kind of need to as well.
The other thing I will mention, though, is if we look at this monthly timeframe at the RSI, the RSI is just losing strength. It’s almost at 50, meaning that the RSI is really pulling back, but the price is still right at that resistance level.
This does scream to me that something quite large is going to happen somewhere in the markets. The technical mismatch between the RSI on the monthly timeframe and the price action is not something to turn your nose up at. It’s indicating that something is coming, and it doesn’t need to be bearish, as I’ve said.
The result of leaving everything alone could be bearish and could be catastrophic for the financial system, but it could also make way for the new financial system. That’s a different discussion.
I do think they won’t let that happen. I mean, the Japanese government is already showing their hand and saying, look, at this level we’re starting to get a little bit worried, and we’re willing to spend $34 billion on it just to kick the can down the road, even if it’s only for a week or two.
So what are the next steps? Probably a shitload more money, and that’s basically what I think.
But at what point does that come? That’s been the discussion for the last few months with us. We have now started to see the first signs of the Japanese government’s hand this week.
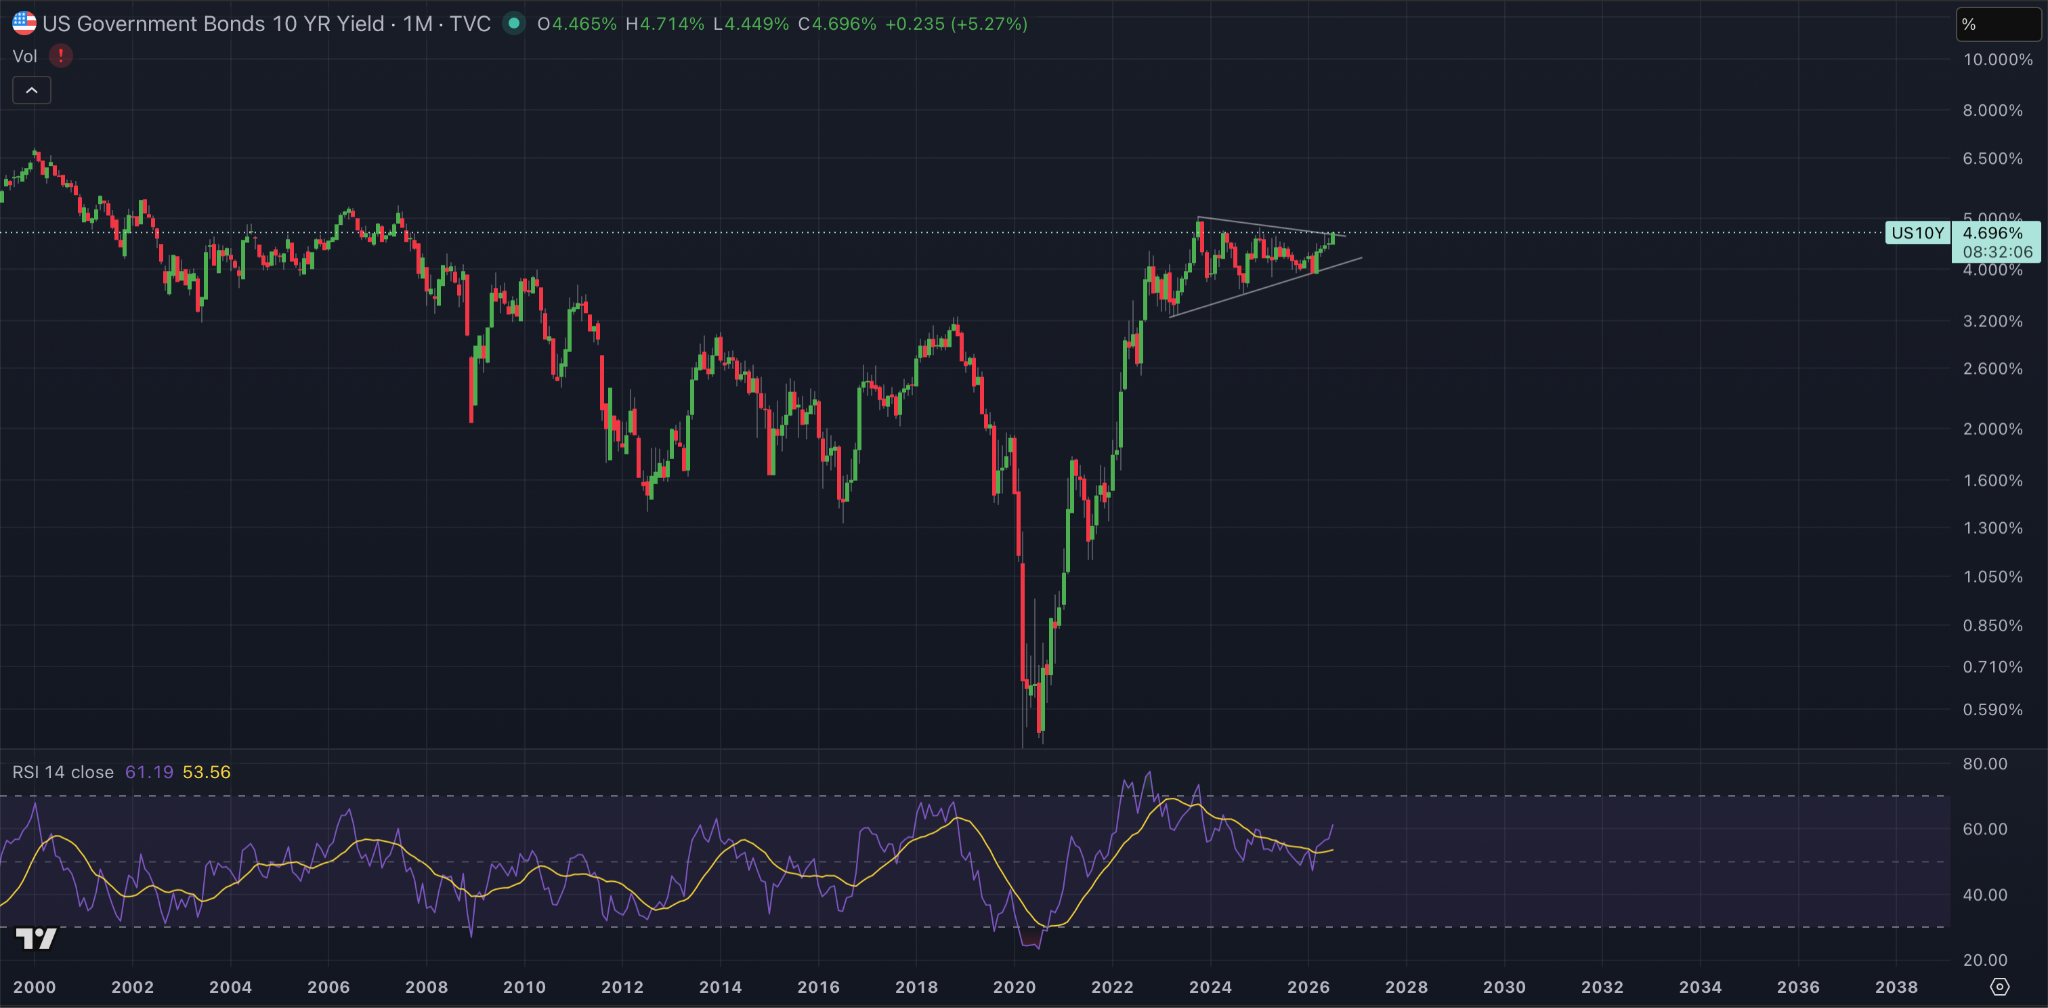
To this, probably the most important chart in the world right now, and another chart we’ve been continuing to discuss in this newsletter, is the US 10 year Treasury bond, which, if you look at this from just a technical perspective, looks like it’s about to break out higher.
When we’ve got to this level historically, this 4.5% to 5% level, with 4.7% where we’re at right now, we have seen a verbal cool off from someone in the Trump administration. Somebody comes out and tries to cool the markets by saying, look, we’ve got our eye on it, etc. But this time we haven’t seen that yet. Or, with the global issues, it might not work.
We might, and I think we do, need to see intervention of some sort, or let the bond markets sort things out. If we let the bond markets sort things out, I think it will cause significant problems in the financial industry. What those problems might be, again, I don’t know.
For example, just with Treasuries, Japan are one of the largest Treasury holders. They’re going to be selling down Treasuries in order to get dollars, in order to sell those dollars to buy back the yen. All of those things are negative for the US if done on their own. If Japan starts to go into full crisis mode to save itself, it’s going to massively impact the US economy.
Similarly with Korea, we’re seeing some cracks there. The same applies to China too, on top of all the conflict issues, etc.
But if we also take a step back and think, okay, bonds are the backbone of the US economy, and they start to rip higher, what does that mean for faith in the US? What does it mean for the future of the US economy?
They’re questions that will have very different answers depending on who you ask, but they’re not questions that you want people asking when you’re running into the midterms as Trump, and then looking towards re election two years after that.
The solution to these issues is coordination and, ultimately, the printing of money. You can either buy back bonds and implement yield curve control in the US, or you can push money into different markets abroad, give people different options, offer free swap lines if they buy Treasuries, or whatever these hundreds of potential solutions might be.
But all of these solutions involve liquidity.
We’re getting to, or we’re at, a tipping point now. I’ve said this for the last few weeks. It’s a tipping point, and now we’re starting to break through that tipping point.
We’ve already started to see the Japanese government show its hand. At some point soon, the US is going to have to show its hand as well. They’re being stretched by conflict, finance, and international relations linked to finance. They’re trying to secure energy, and they’re trying to look to the future. But at some point, they have to deal with the present.
And the present is basically saying we need some liquidity input.
Before that, though, you can see things starting to crack and break, and those cracks and breaks can catalyse that liquidity injection. That’s basically what I’ve been trying to say.
I think there’s going to be a crack or a break, and I think we’re seeing the early signs of that because even $34 billion can’t really save the yen. It only kicks the can down the road for maybe a week.
So as soon as we start to see a significant crack, that’s when I think we’ll see some sort of liquidation event. Maybe crypto gets flushed like I’ve been looking for. Maybe Bitcoin triple bottoms and sets a slight new low, or XRP trades below a dollar like I’ve been discussing.
Then I think we’ll see global intervention.
That’s what I presume.
The alternative is a full blown crisis, and I don’t presume that will happen, and I don’t wish for that either. I hope we get intervention and some really exciting risk on rallies once we start to see those cracks appear and, in turn, the reaction to them.
To start with, we have to look at Bitcoin, which we’ve obviously been tracking for a while now and discussing the potential of a higher low.
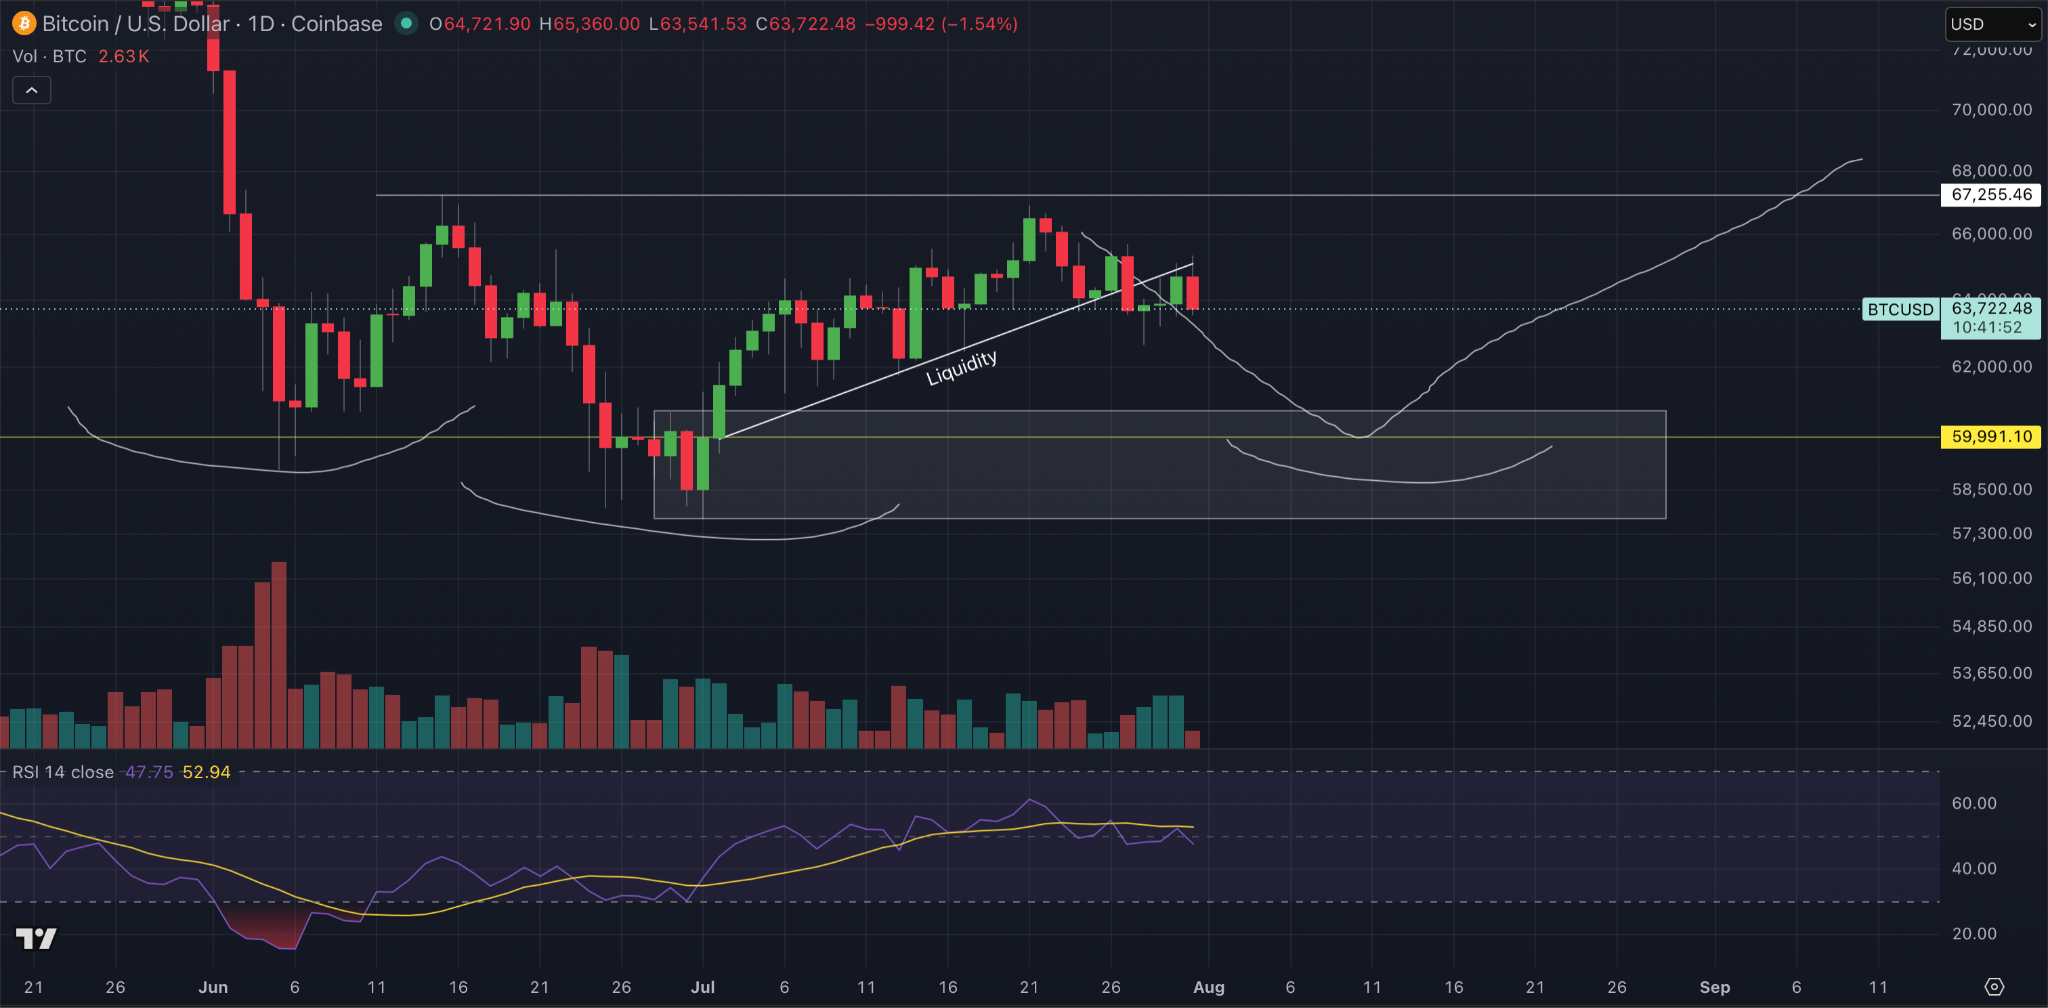
Well, what can we notice this week?
This week we lost that liquidity trendline that I’ve been discussing, and that’s why I think we’re going to hunt for liquidity below it. That’s why I have that liquidity line marked on the chart.
What else can we take from this?
We also now see a bearish daily RSI, with the RSI looking like it’s losing strength. It’s lost the moving average and is, so far, below the 50 level, indicating bearish price action and bearish momentum.
With all this being said, it is Friday, and markets aren’t yet open at the time of writing, so anything could happen between now and tomorrow when you guys read this newsletter, especially with the conflict in the Middle East.
I’m going to stop saying Iran and just say the Middle East from now on because I think it’s getting broader than just Iran. So take all of this with a pinch of salt.
But I also want to look at the monthly timeframe here as well. And remember, when I’m discussing all this, keep everything that I’ve said above in mind.
I do think that there is a reversal coming soon. Exactly when, I don’t know, but I want to show you the monthly chart.
The monthly candle closes today.
First off, what I want to say is that I think we’re still clearly trending down on the monthly. Until we recapture that $66,617 level, I don’t think we can say that this downtrend is completed.
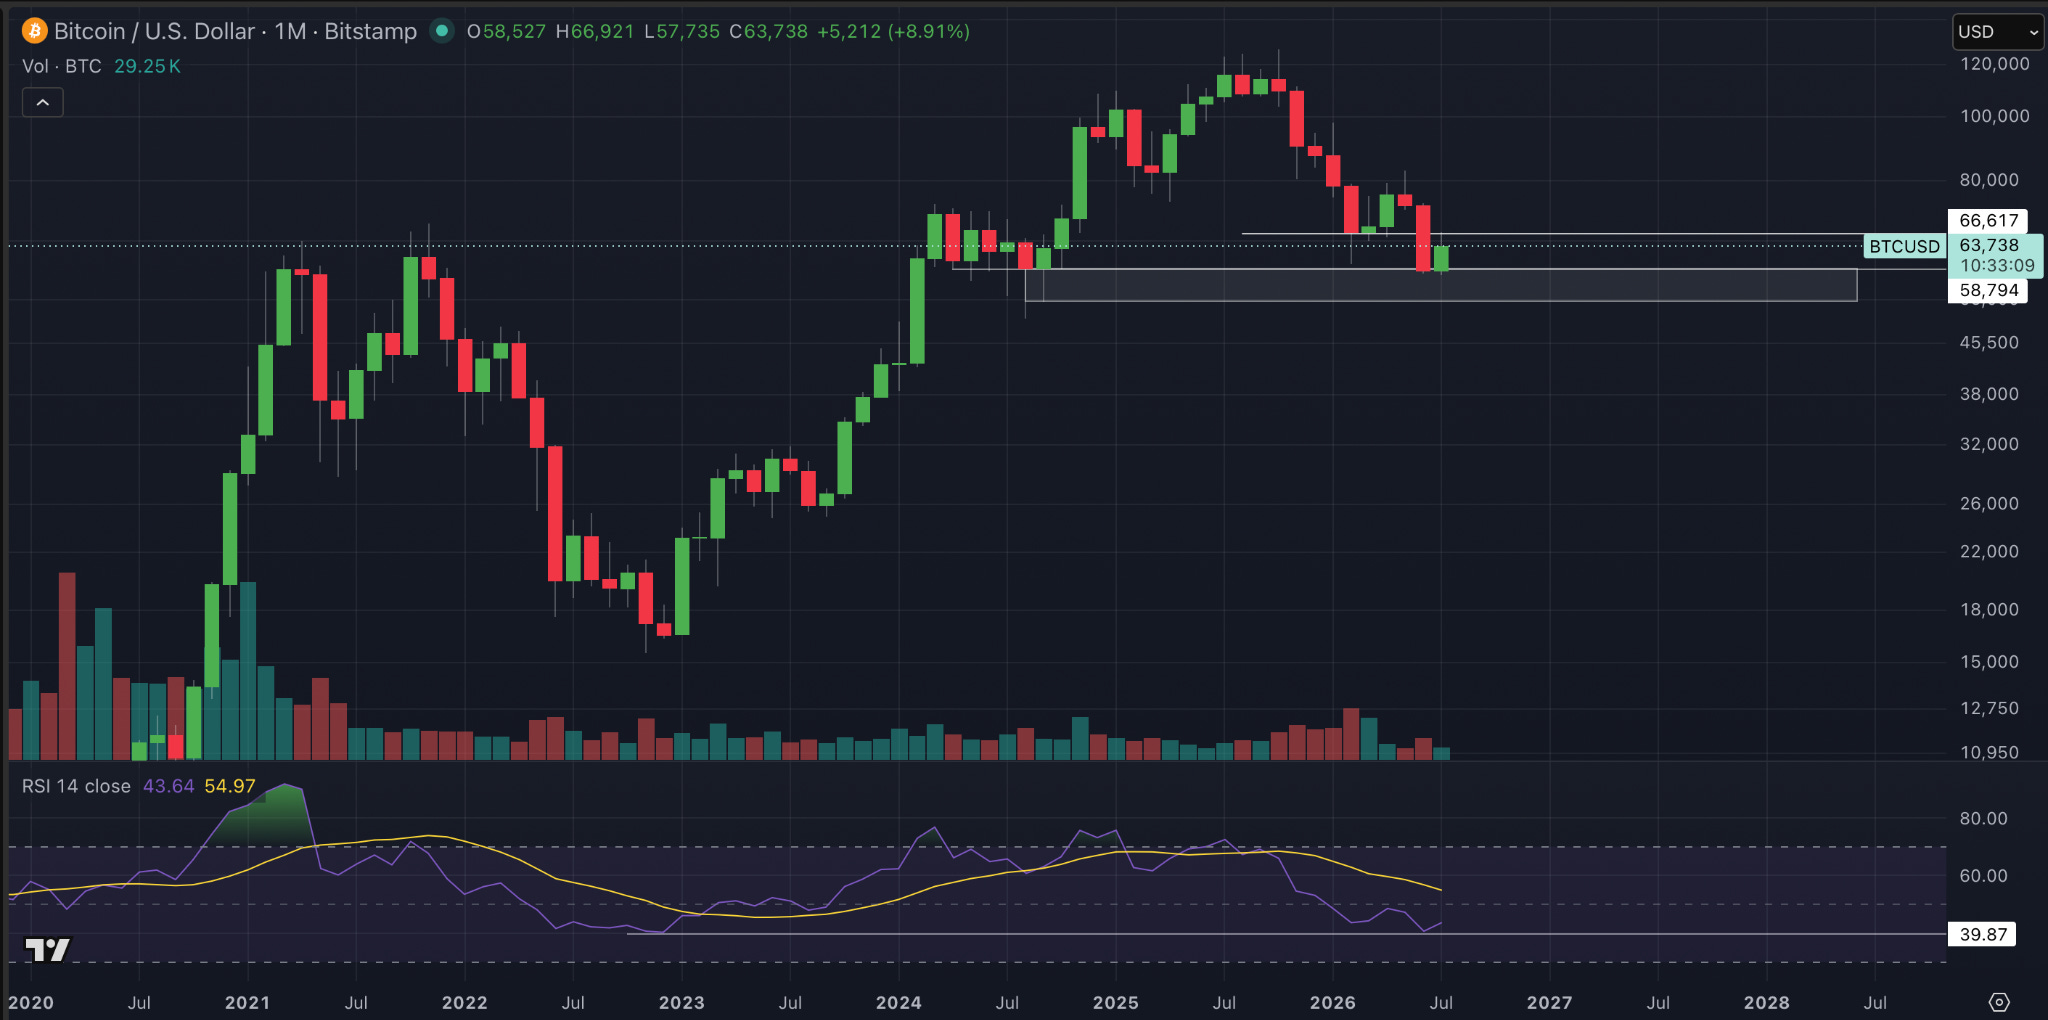
With that being said, the monthly RSI has nearly bounced off its lowest ever reading at 39.87. So the bottom is probably close, and this is what I’m trying to say to people.
Whether we have to whip around here or not, I don’t know. Whether we have to wick into the grey box you can see below, where the current monthly price action has closed, filling what might be some sort of fair value gap, I don’t know.
Whether we even come lower than this, if there is a wider global issue, and have to come down to the $45K region, again, I don’t know. There’s a lot of fair value below us that has never been retested as support.
But I don’t think we come much lower than where we are, to be honest. I can see the technical argument that says we could, but I think something would have to be very broken more broadly in crypto if we came much below the grey box that we’ve got drawn in.
We’ve never been that low, or lower than that, on the monthly RSI. We’ve also never really revisited much below previous all time highs in any other bear market.
If you look at where we currently are in terms of price, we’re still roughly bouncing on previous all time highs. Not quite, but roughly. So this is where key support is for Bitcoin.
Key support is showing up at the same time that the world feels like it’s on the edge.
I think that’s a good indication that crypto is probably going to perform pretty well if we see some sort of intervention, or if the world doesn’t tip over the edge. Even if it does, there is still the argument that maybe crypto then takes the forefront.
But there will probably be some pain first.
So what I’m trying to say is, look, even on the larger timeframe, no matter what I’m saying on the lower timeframe, even though we can’t say this downtrend is over because we haven’t got the technical close back above the $66,617 level yet, what we can say, in my opinion, is that this low is very close to being in, if it isn’t already.
XRP’s monthly chart.
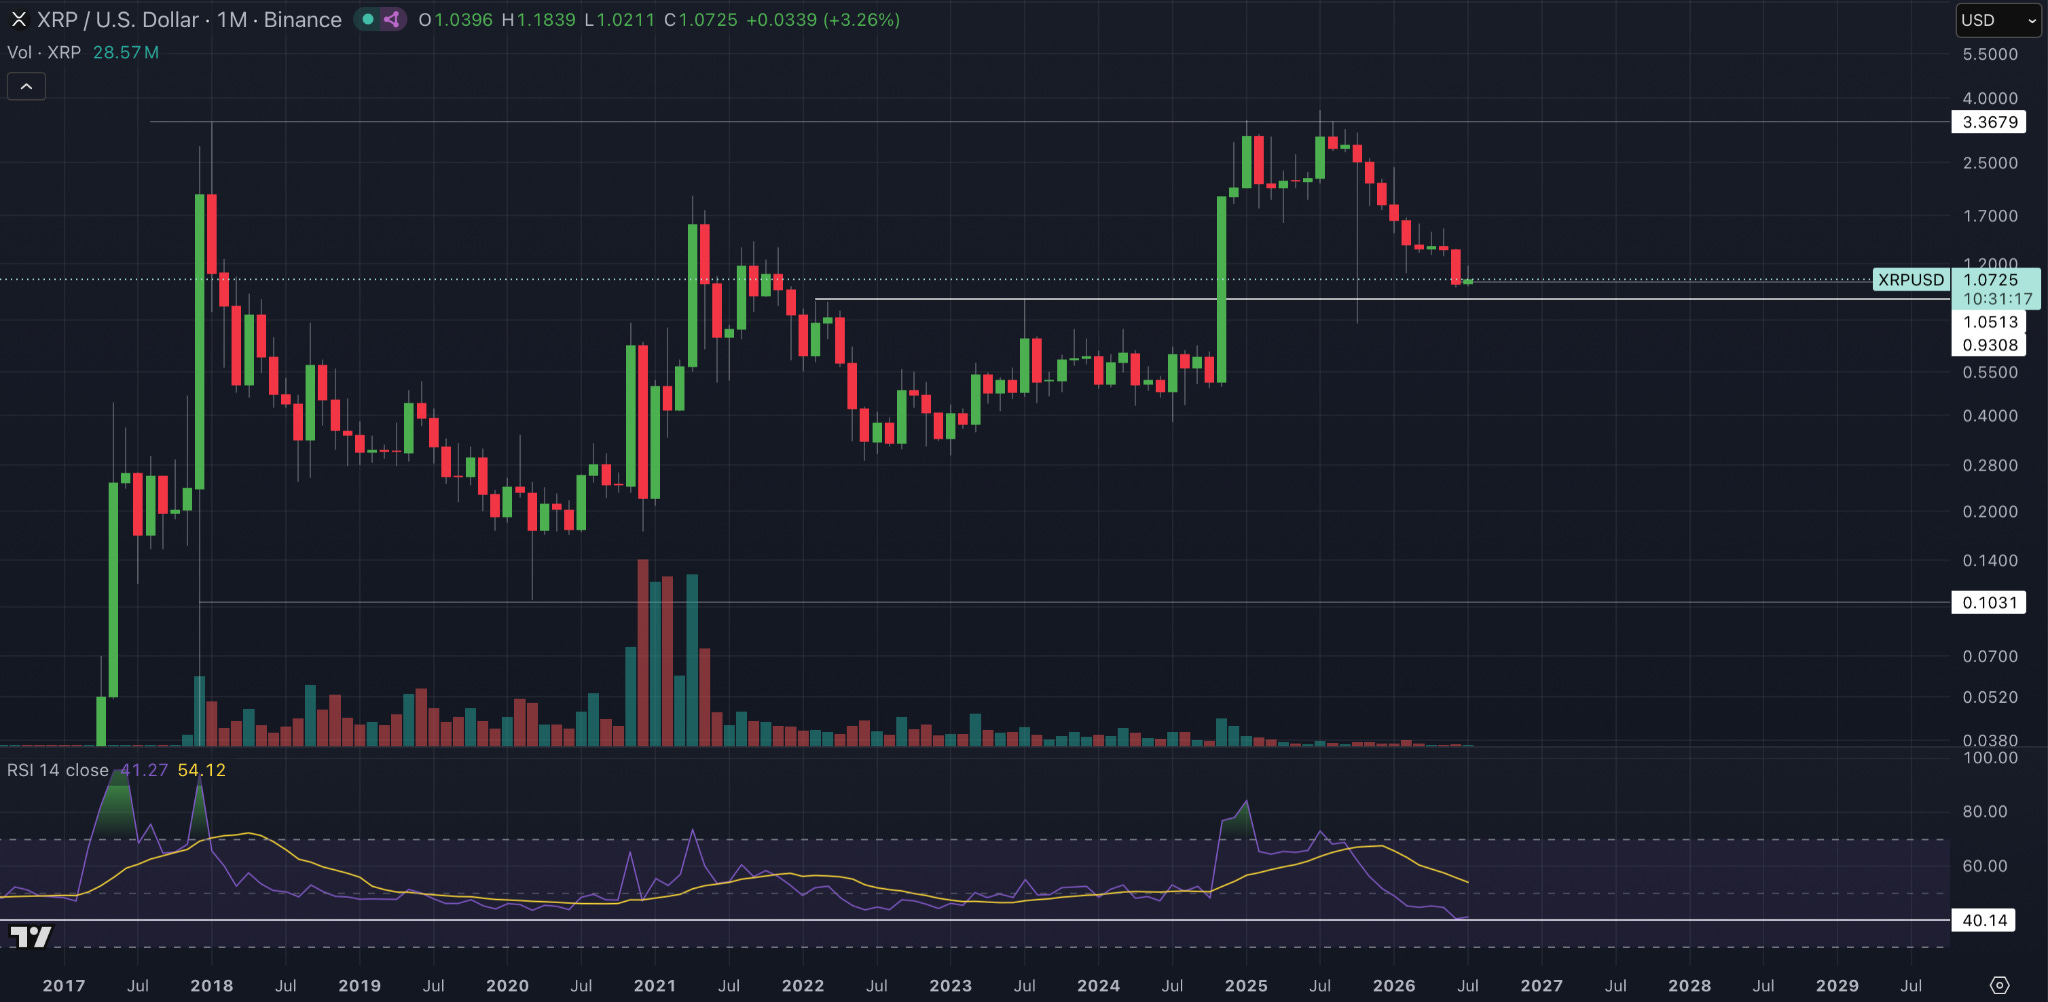
We can see some similarities, but also some differences to Bitcoin. A major difference is that XRP’s monthly is already at its lowest ever RSI reading of 40.14, or at least it hit that last month.
Similarly, I would say the lows are close, if not already in, but I don’t think they quite are. I think that the main horizontal white line you see in the middle of your screen is the most likely area for us to bounce.
Why do I think this?
Well, that line is actually below a dollar, even though you can’t quite see that right now. It’s around $0.93. As you can see from July 2023, when Judge Torres announced that XRP was legally not a security, that’s the line where we found resistance. I think that would act as such a logical area to backtest as support.
Many people in the XRP community right now believe that we’re not going to go below a dollar again, just like everybody, when we were below a dollar, said we’d never go back above it.
I think we can, and very easily will, go below a dollar again. I’ve written about liquidity over and over again, and I’m going to show you the daily liquidity chart and the hourly liquidity chart as to why I think the technicals back up this thesis.
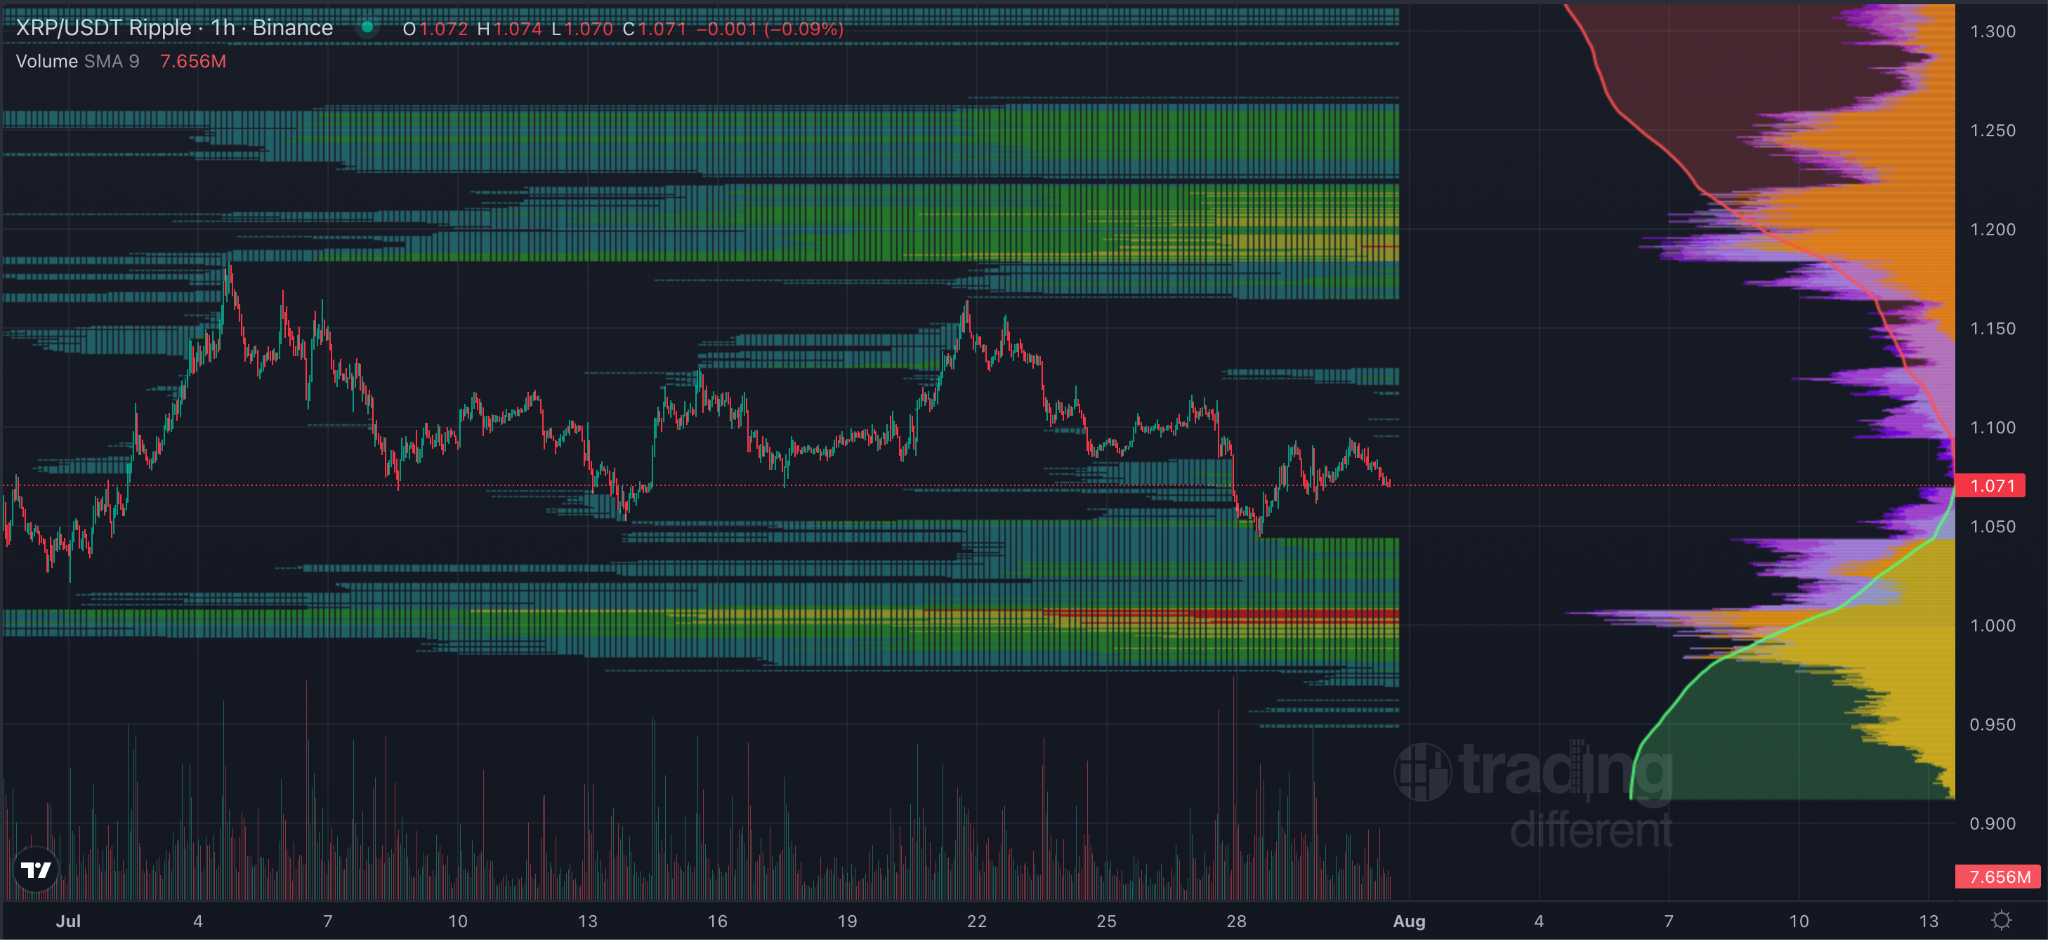
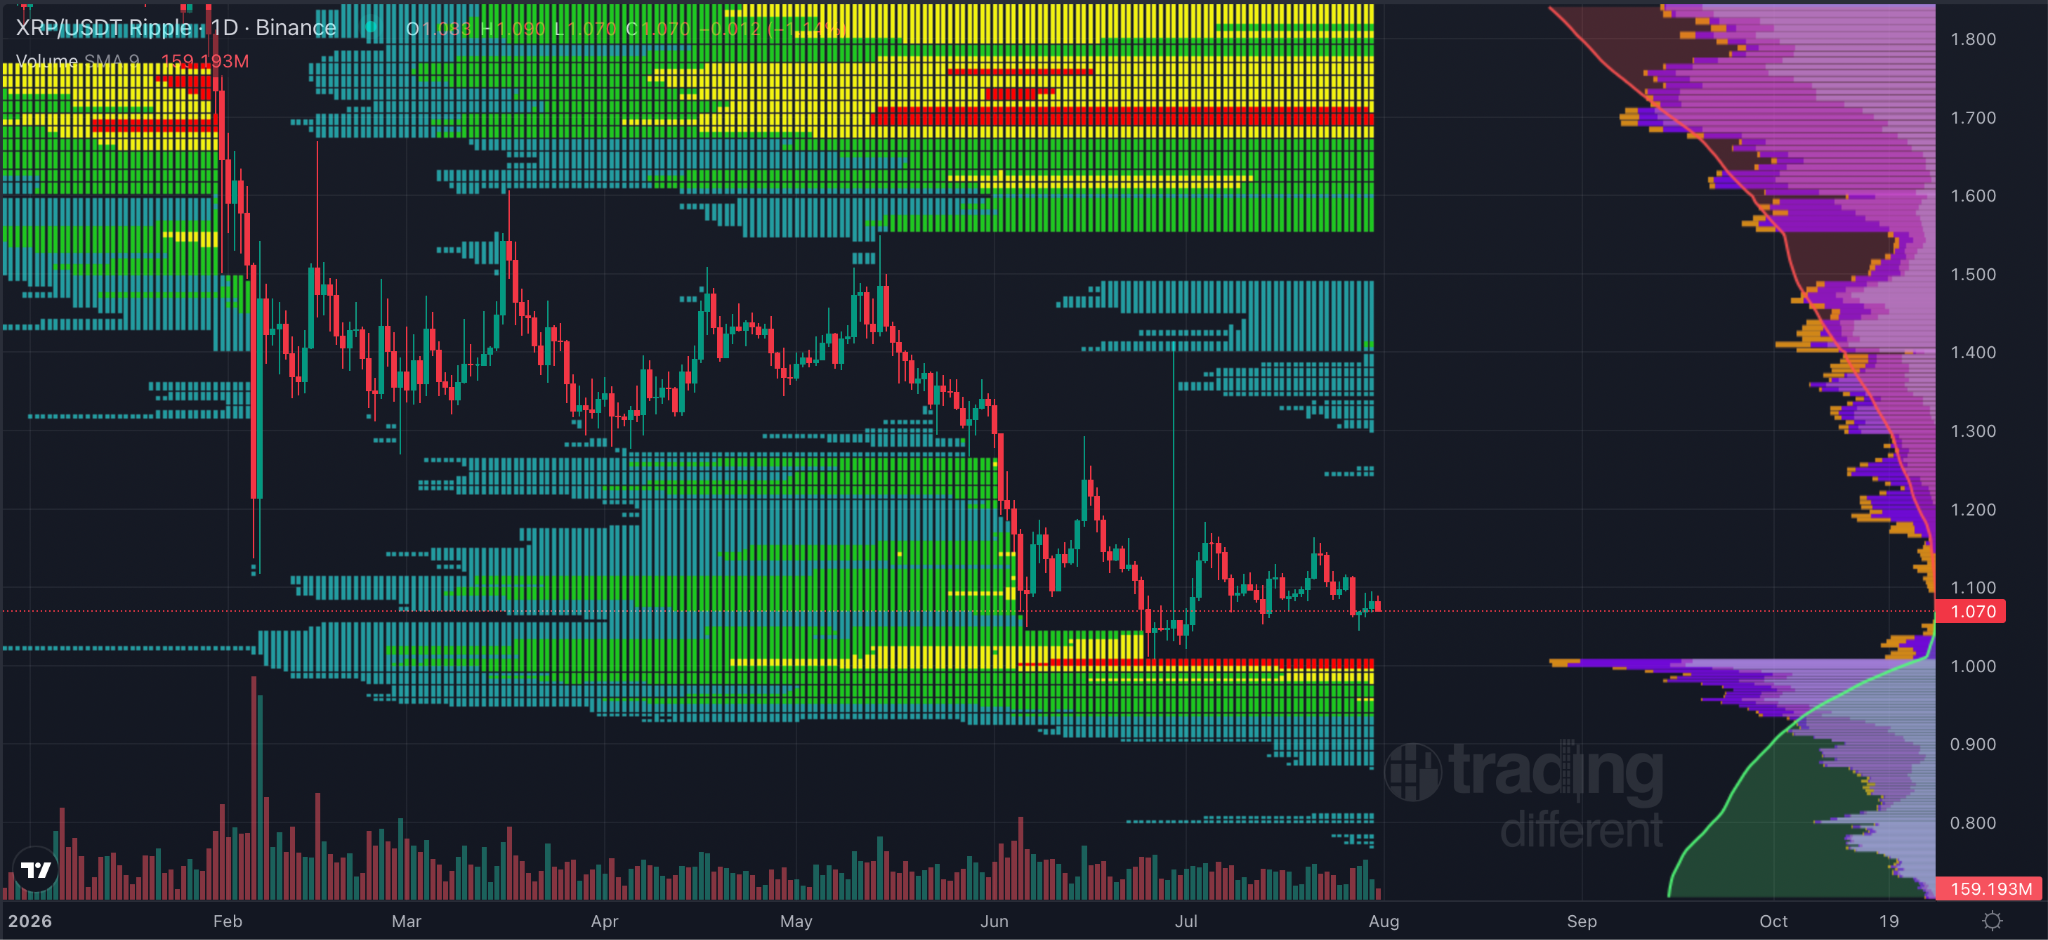
I think that once we do break a dollar, if we start to plunge into the dense area of liquidity that is only a little bit below us, people will start to throw in the towel on XRP. They’re going to start thinking, “Now we’re definitely going down to the $0.60 level,” maybe even towards the bottom end of this range. As I’ve marked, people might even start throwing out targets as low as $0.10.
If we start to see that, then I think the bottom will be in.
Not when people are trying to preempt and front run what could be the bottom, but when people are actually in despair and capitulating, we’ve lost the round number of a dollar, and everyone’s looking around blaming each other.
That’s when I think we’ll see the lows.
It would also make sense, especially with the Clarity Act tiptoeing through Congress right now. Is it going to pass? Is it not going to pass? It would be such an ironic support level to bounce from.
The only asset that we’ve seen gain legal clarity, obviously aside from Bitcoin, which is almost a given, is XRP. That legal clarity announcement becoming the support level would almost feel like the simulation itself is showing you what’s happening before your very eyes.We’ve had this plan for a while. Whether it comes into fruition or not for XRP, it is my plan, and it hasn’t changed.
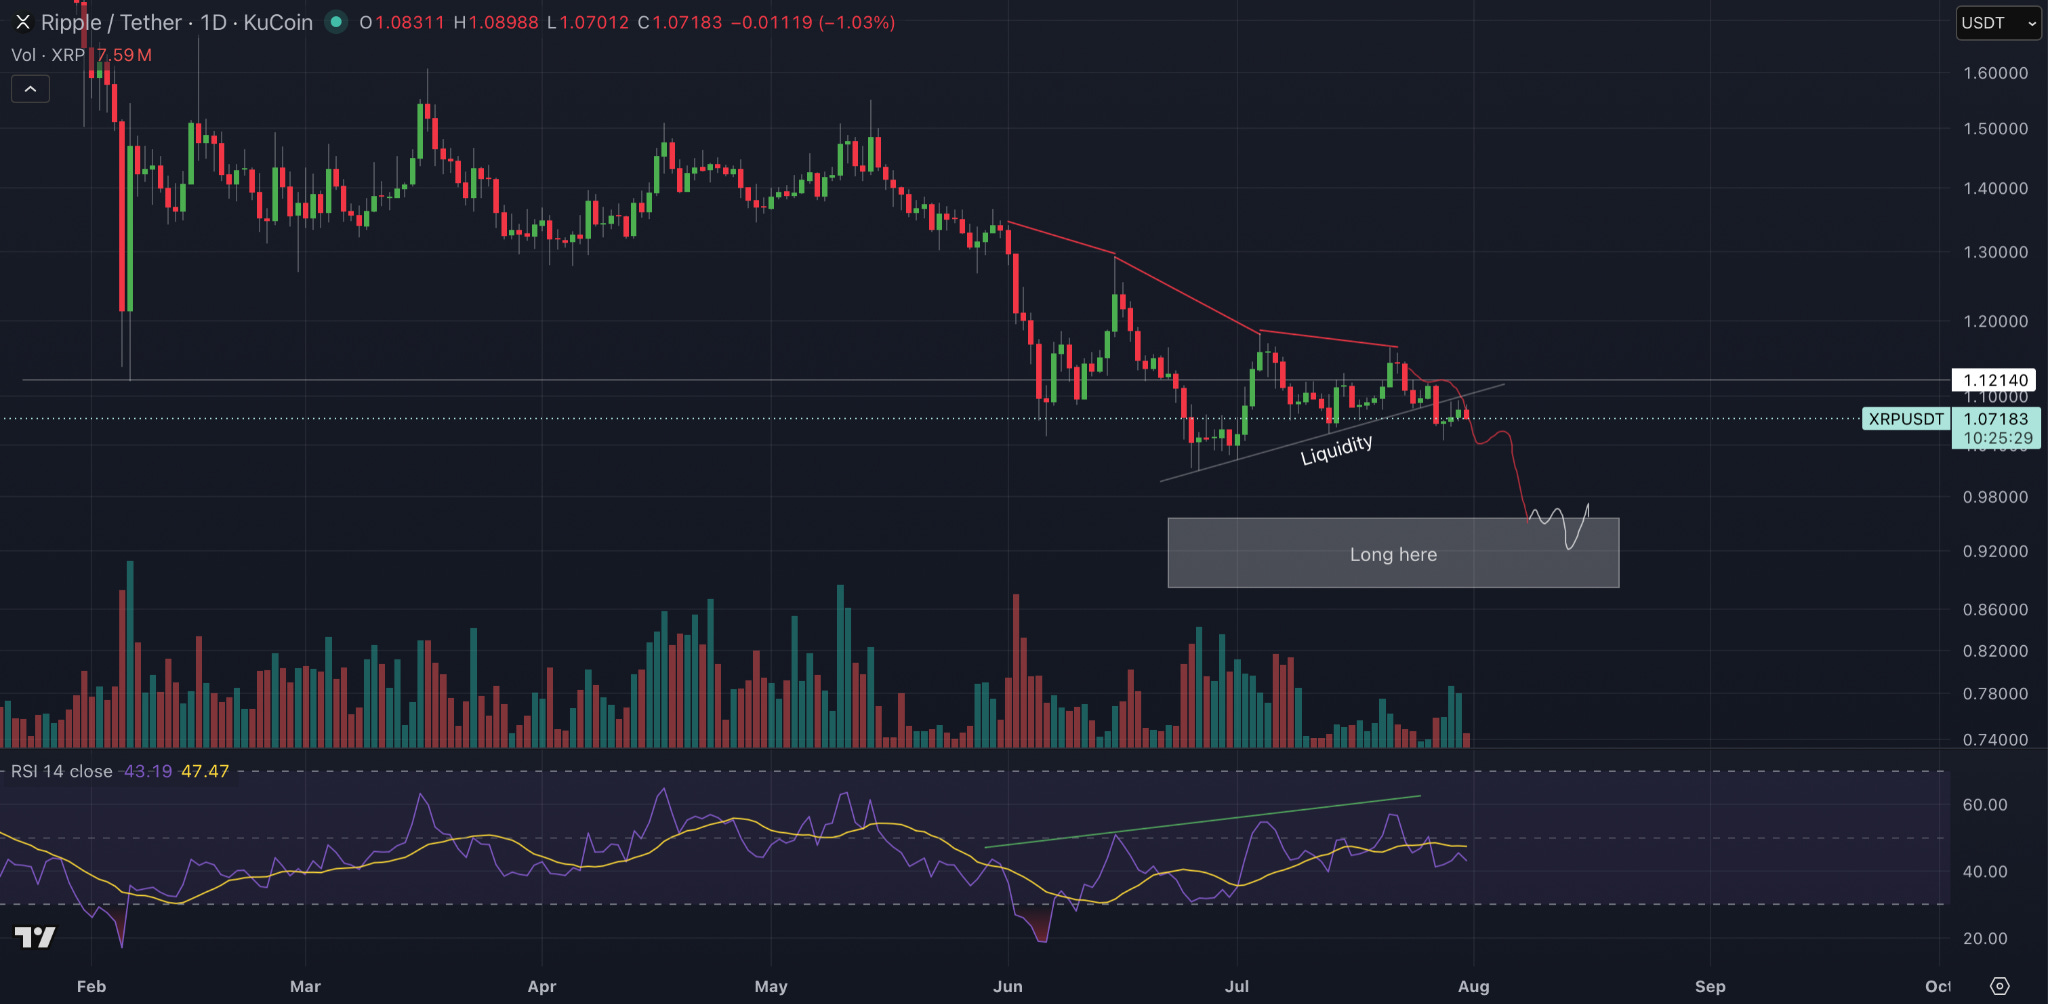
With the triple hidden bearish divergence on the daily, I think it’s probably likely that this does come into fruition.
This white box that you see below matches up with the liquidity and the discussion that we’ve had above, and it’s where I’ll be entering leveraged long positions with the last little bit of my cash into this market.
Quick housekeeping before I get into it. Gold still has not tagged the $4,400 I was looking for, we are sat around $4,045, and DOGE has done absolutely nothing, up 0.7% on the week. Neither one has gone against me badly enough to drop it, but neither has paid either. So this week I have gone digging a bit further down the curve instead, and I have spent most of my time in on-chain data.
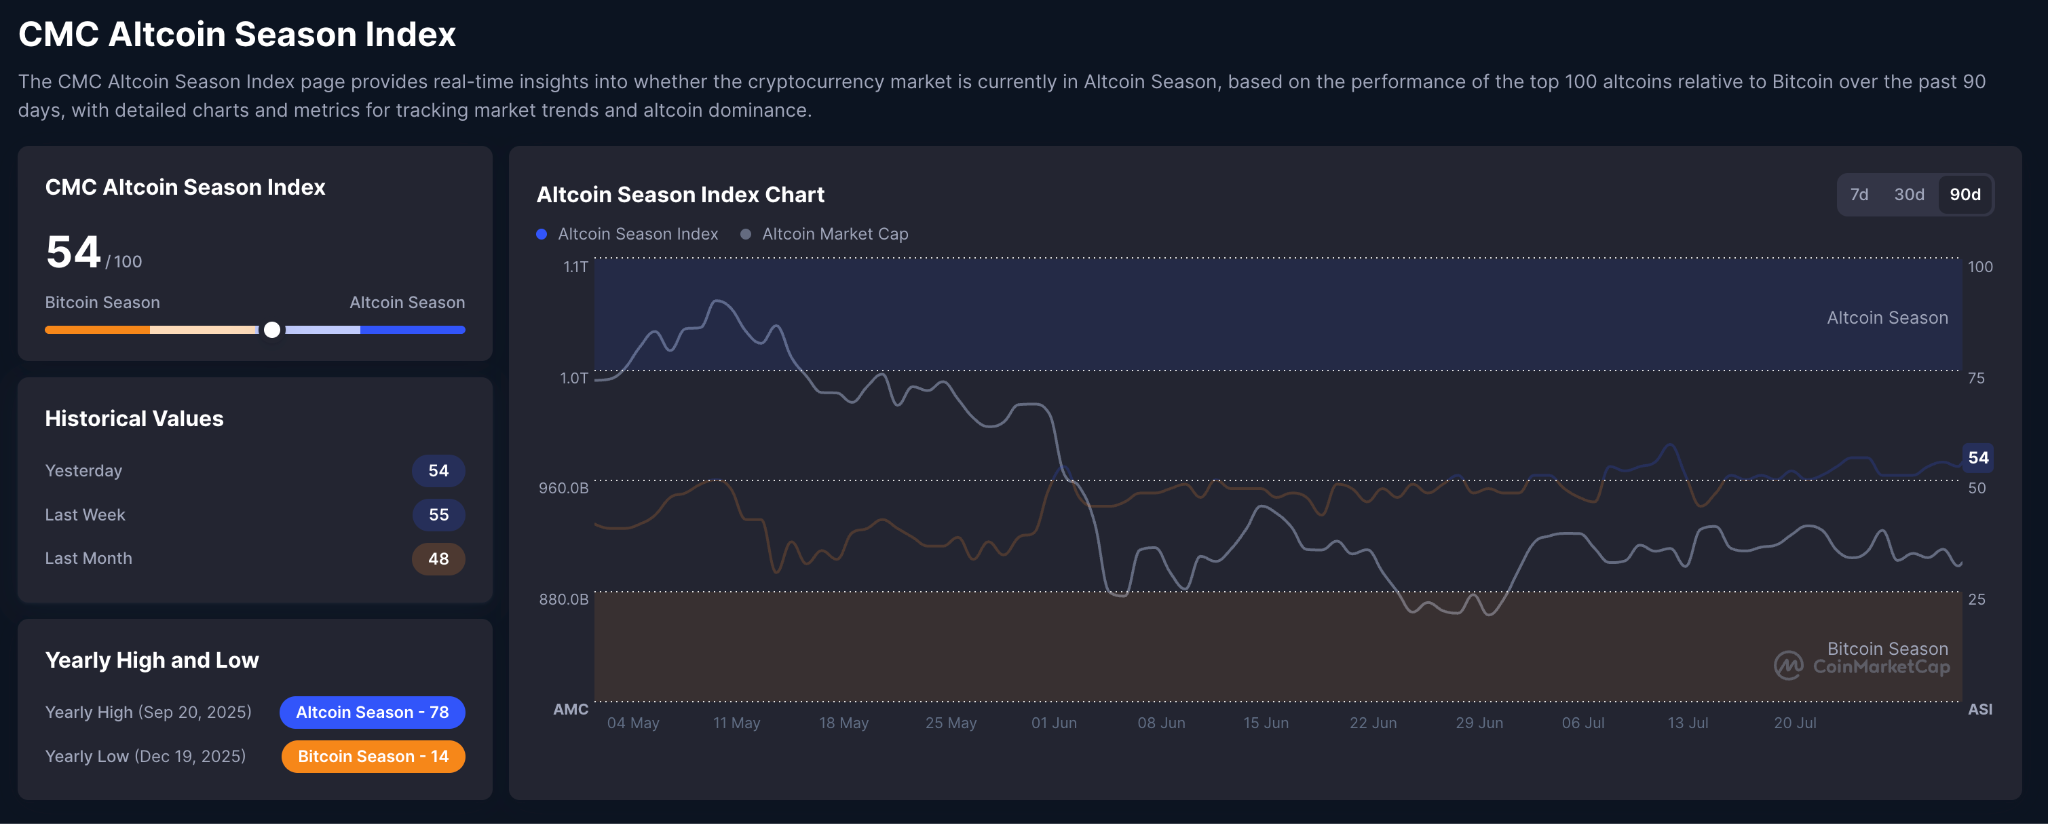
One thing I want to say. If you are seeing people tell you alts are running, they are not. Of the top 300 coins, only around 60 were green over the past week. 240 were red. The altcoin season index is sitting at 53 out of 100, and the line for an actual altseason is 75. This is three or four things running hard while everything else bleeds, and that matters for how you size.
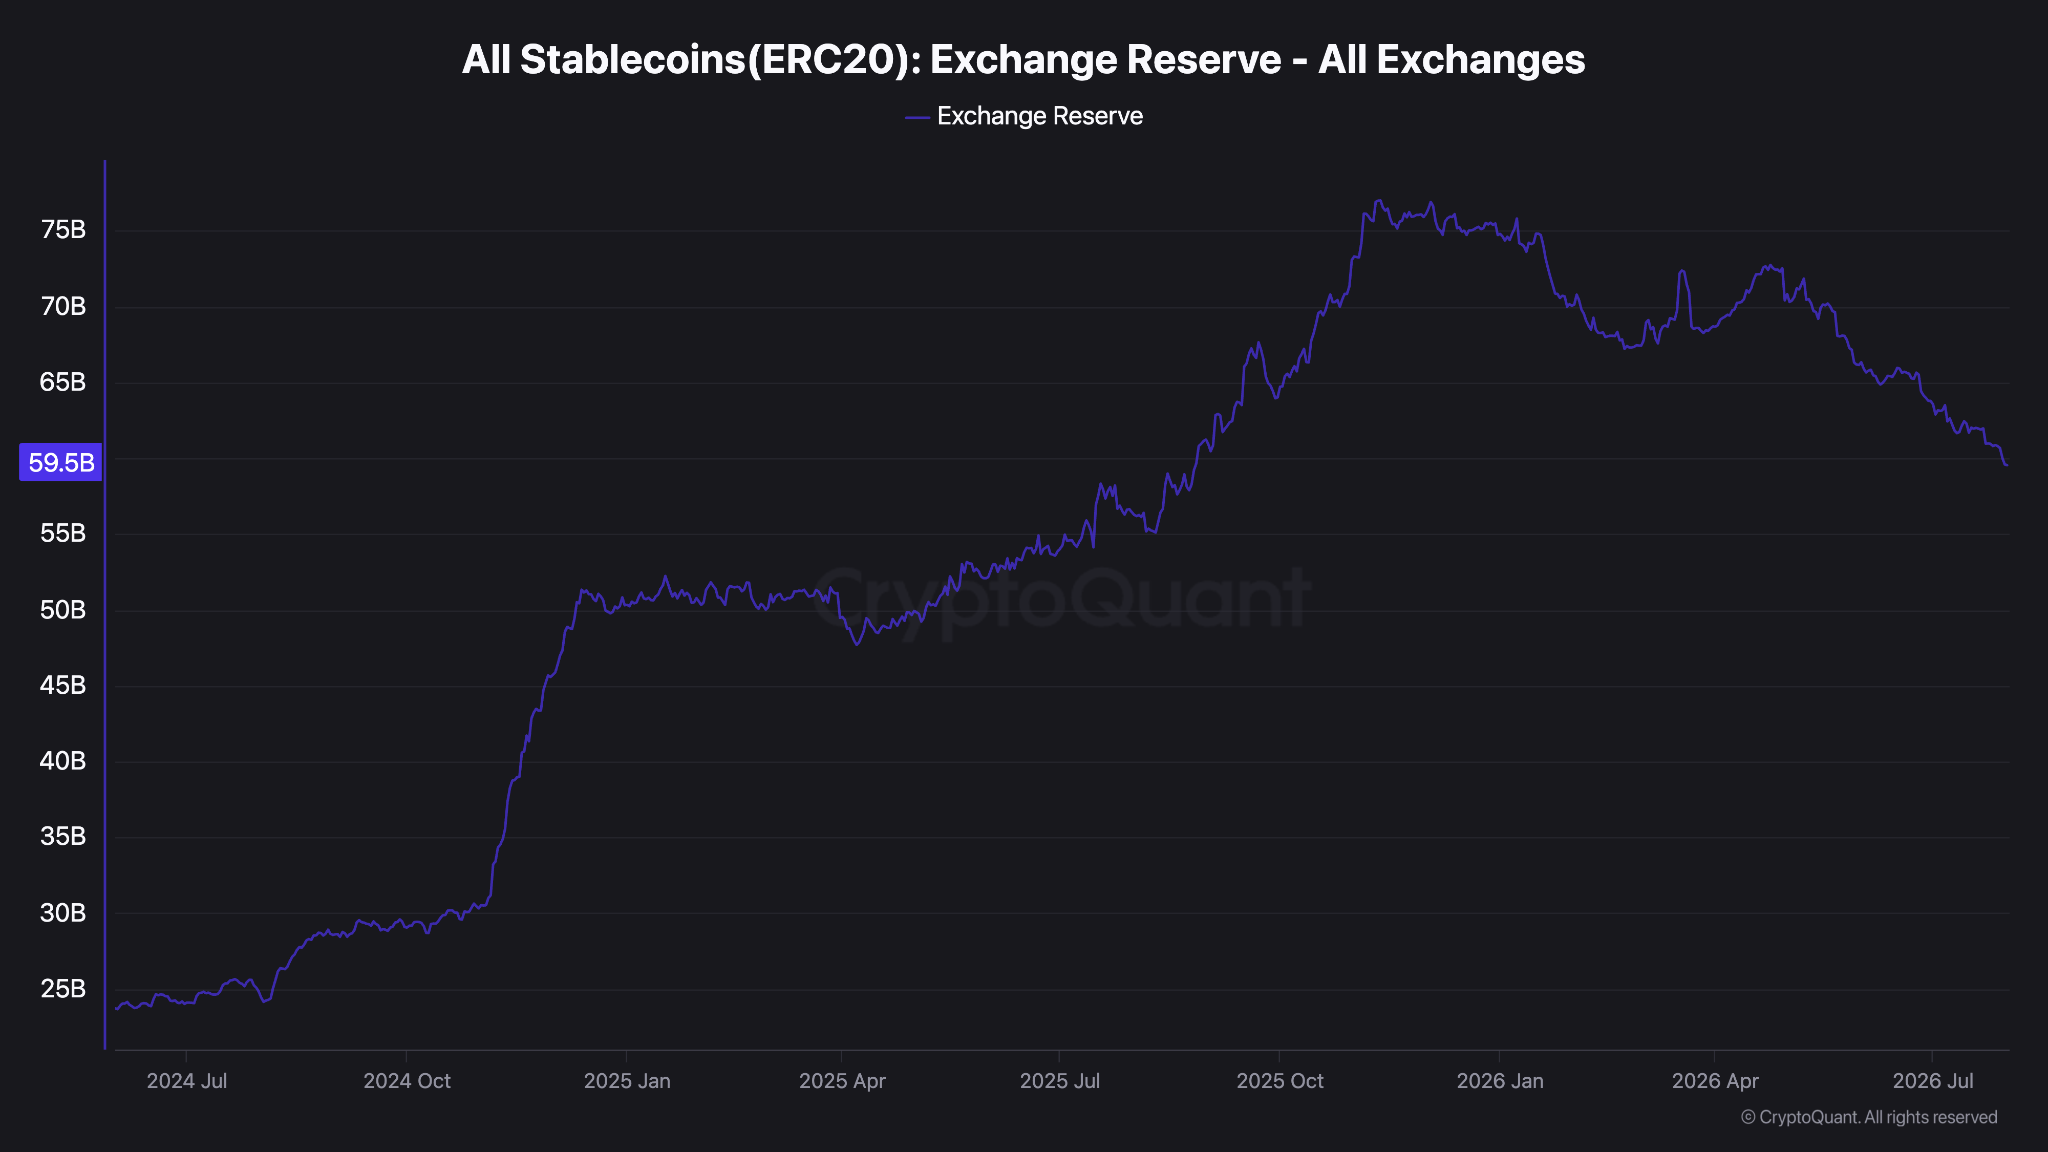
This is a chart thats got a lot of mindshare this week. Stablecoin reserves on exchanges are down at $61.8 billion, against a late 2025 peak of over $75 billion, and they are still sitting under the 100 day moving average.
That number is basically the money parked on exchanges ready to buy something. It is not there right now. To me that explains a lot about why every bounce we have had recently keeps getting sold into rather than continuing. There just is not the size behind it.
I am not reading this as bearish forever, but I want to see this cross back above the 100 day before I properly believe in an alt leg. Until then I am treating every rally as a trade and not a trend.
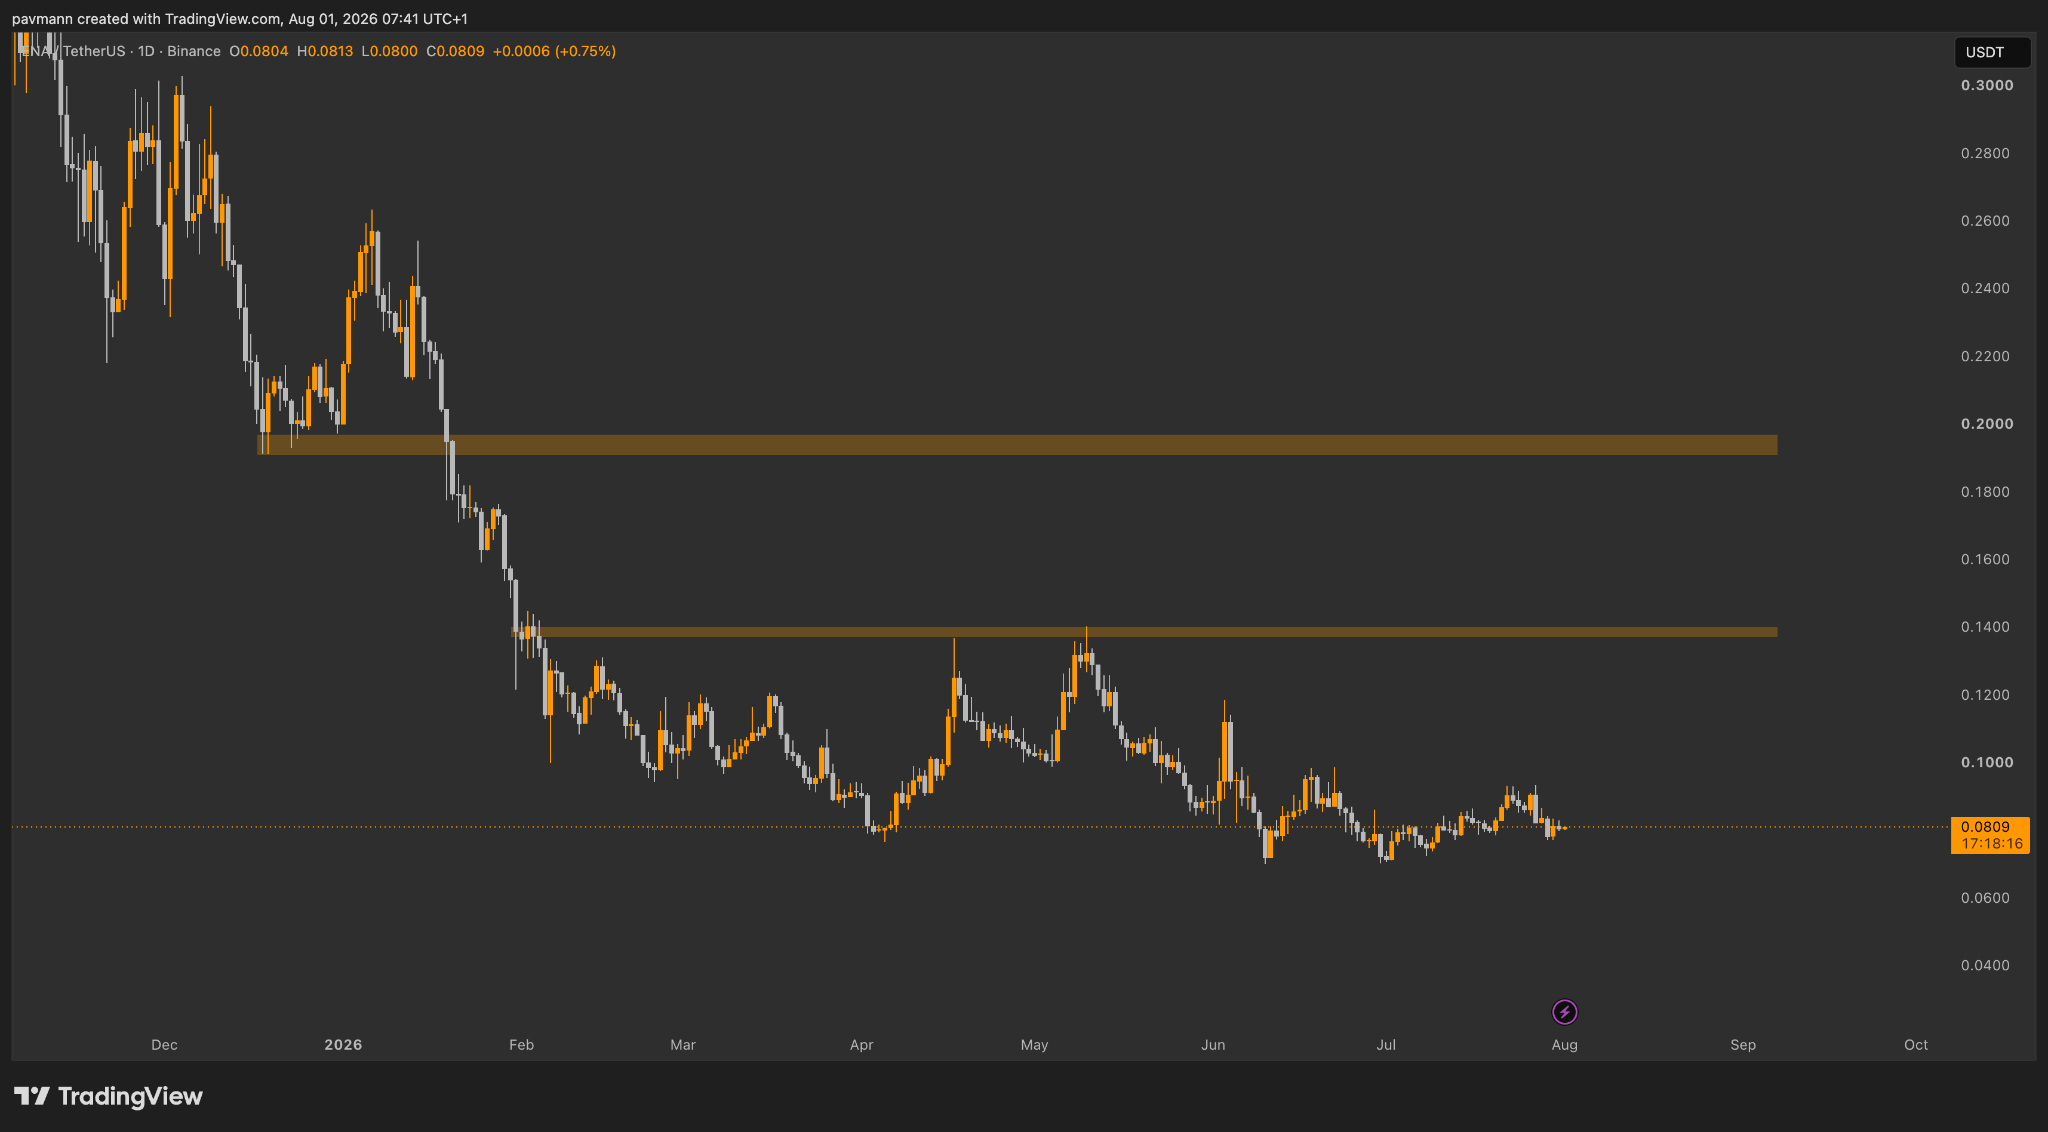
ENA is the one I am actually a bit torn on. On the weekly it is pressing against the descending trendline that has capped it since the October 2025 top, currently at $0.0806. I want a weekly close above $0.093 to call that a proper break, and if we get it the first target is $0.140 with $0.190 as the stretch.
We’ve spoken about ENA many times over the past 2 years and you know its one we both like to trade and I think that when the market starts to gather momentum again, $ENA will do well (not FA). Even if you buy spot here its not the worst call.
LINKS:
This newsletter is free because we love sharing our insights with the community. If you enjoy it and find value in our work, consider supporting Pav’s and Will’s Beer/Coffee Fund by donating $XRP to our newsletter donation wallet below. Cheers!
$XRP donation wallet: r3qf2nALyhFwC46QqZ5gJHpF3cjr5gRcoV
Trade XRP Memes here:
https://firstledger.net/?ref=6NRu4StwrImq
Trade on MEXC: https://www.mexc.com/register?inviteCode=mexc-1etb1
Trade on WEEX using this link: https://www.weex.com/login?from=https%3A%2F%2Fwww.weex.com%2FnewbieActivities%3Fid%3D520%26type%3DBEGINNER_TASK%26vipCode%3Duspf
Trading Different (Liquidity Map) - https://t.co/3ks3QMT5VJ?ssr=true
No posts
Comments
Nothing yet. Say the first thing.
Sign in to join the conversation.