
The content below represents the personal views and opinions of the authors. It should not be considered as investment or financial advice.
Something we’ve been addressing a lot in this newsletter is whether the lows are in for crypto. We’ve been referencing many technical charts showing bullish divergences across multiple timeframes, while also discussing the macro backdrop lining up for a shift towards looser monetary policy, potentially even quantitative easing, rather than what people currently have priced in with a hawkish Fed and higher rates.
I think what we’ve seen over the last week or two has really highlighted that we are extremely close to, if not already at, the lows for crypto generally.
In the last week alone, the Iran war has restarted, India’s central bank has suggested banning cryptocurrency, the US dollar has continued to strengthen against the Japanese yen, and MicroStrategy has sold more than $200 million worth of Bitcoin.
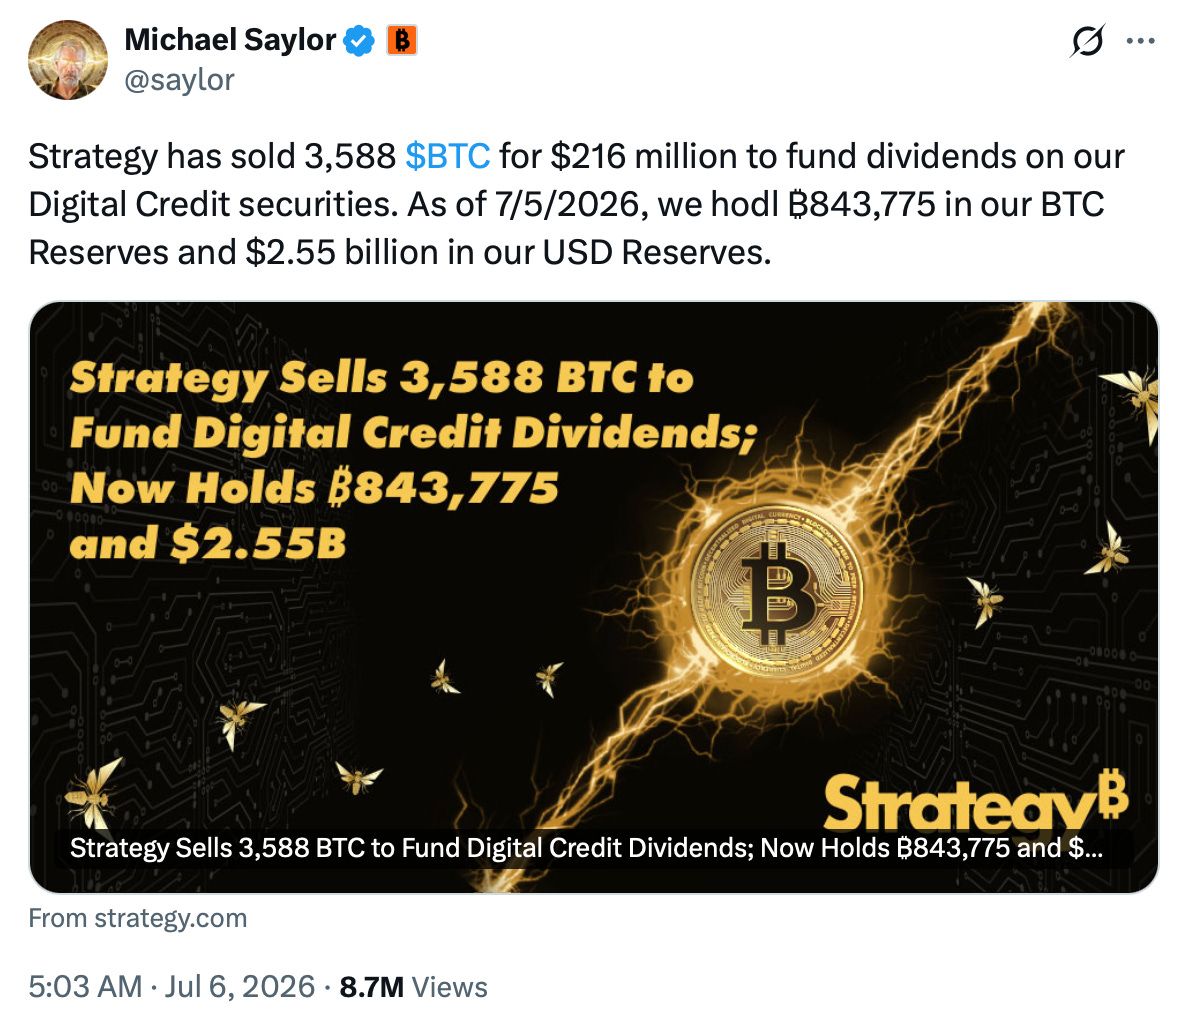

Yet Bitcoin and crypto have still managed to hold the lows without any significant sell-off on any of that news.
If you take us back six months, or even a year ago, any one of those headlines would probably have been enough to send the market down at least 5% on its own.
So, when it comes to the discussion around where the lows are for crypto, I think this is it. This is the low range.
I’m pretty sure now. Back in February, I was saying that we were probably within 10 to 15% of the lows, if not already at them.
We’re now only about 5% lower than the lowest point we reached in February.
This is literally the range where I think the lows are going to be.
Does that mean we can’t have one final flush to the downside?
No.
I still think that’s probably likely on the lower timeframes. On the higher timeframe, I really think the argument for the bottom being in is the dominant one right now.
Although I’m writing this on a Friday, and as we know, after markets close on a Friday, especially with the Iran-US tensions, we should always expect the unexpected.
Normally, if anything is going to get worse, it’s on a Friday night after the market closes.
So by the time you’re reading this, you may have already seen some red price action.
But that doesn’t change my higher timeframe view.

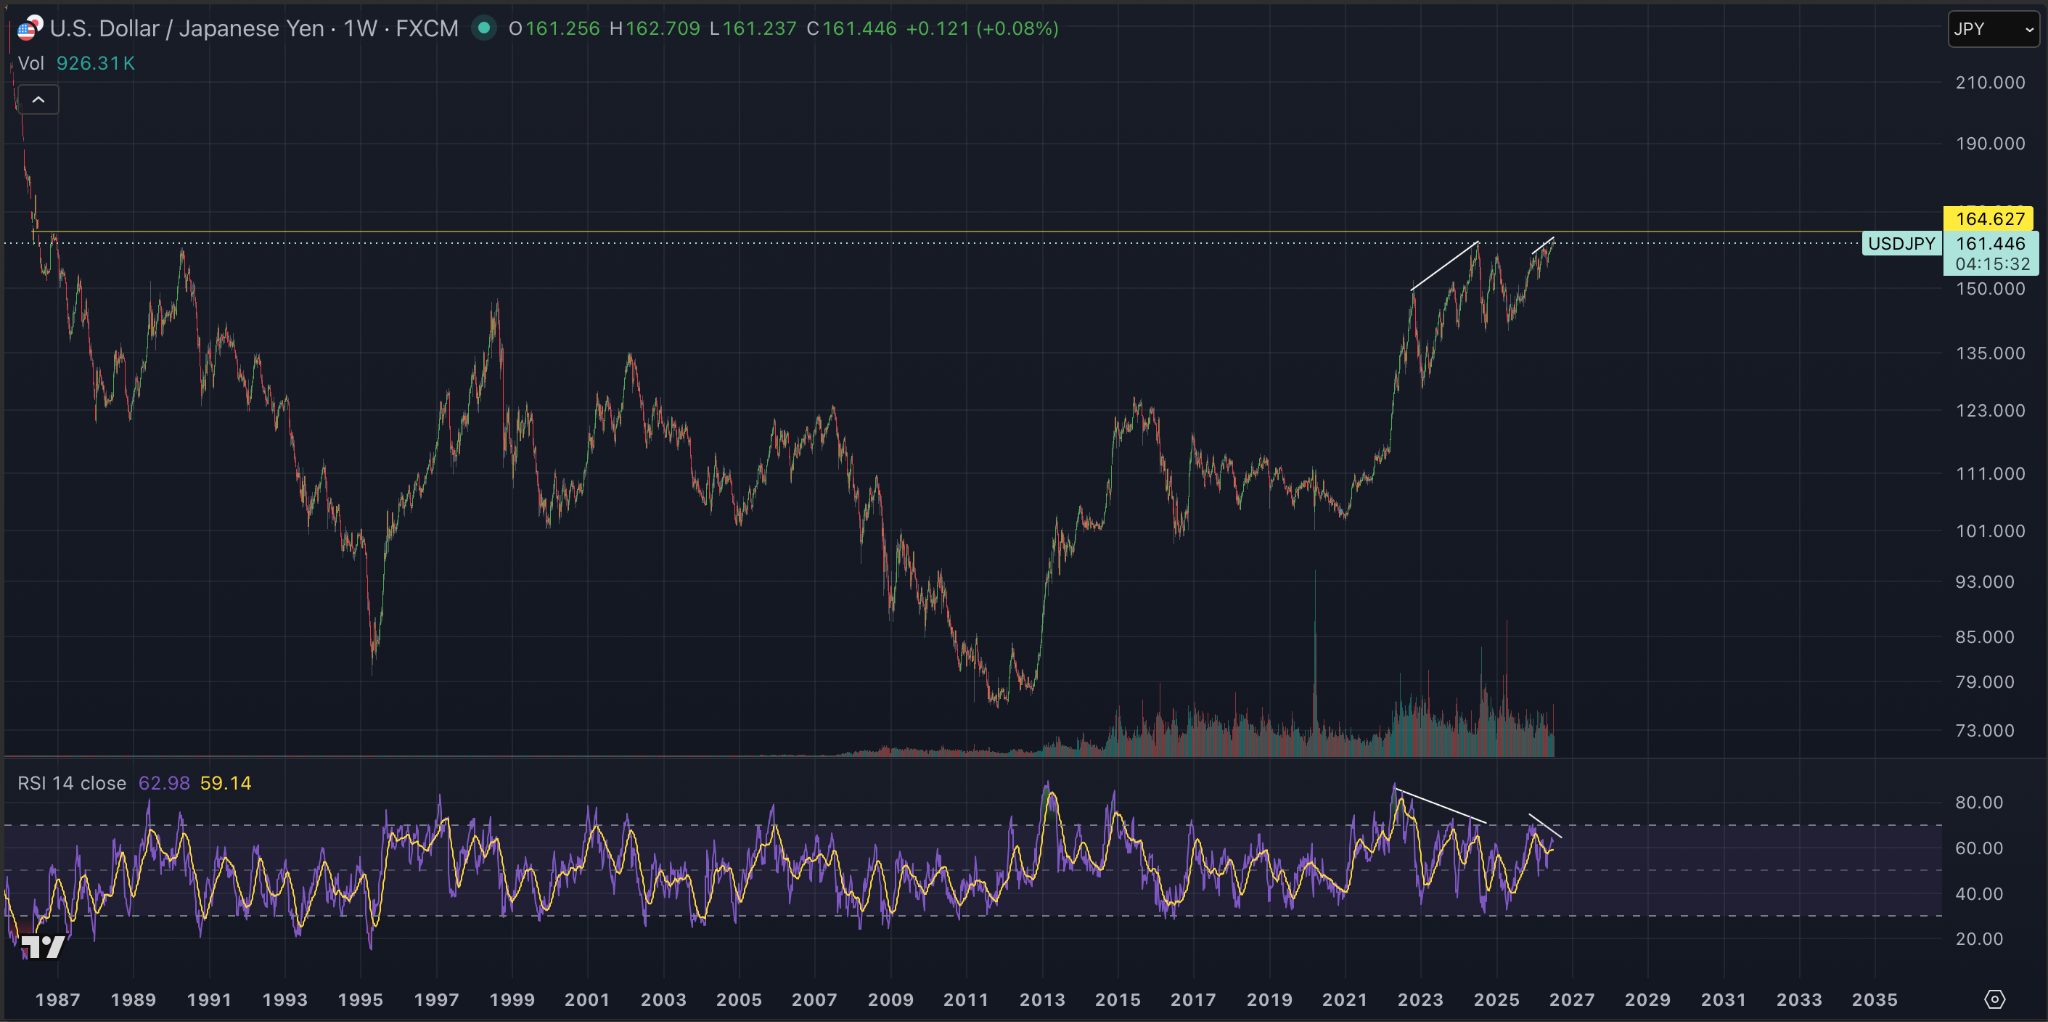
We still have this window of uncertainty while the Japanese yen is up at these levels. As I’ve been discussing, I think the 164.6 level is the key level. Whether we wick above it, break above it, or reject before it, I don’t know.
We’re seeing multiple bearish divergences forming on the weekly timeframe, which tells me that we’re very close to, if not already at, the highs. And that’s pretty much the opposite of what I’m saying for crypto. We’re very close to, if not already at, the lows.
I’ve been saying this is problem, reaction, solution.
With the experience of 2008, as I’ve discussed in previous newsletters, I think it’s more likely that policymakers try to pre-empt these situations and intervene rather than let them fully develop and then try to resolve them afterwards. Especially when there’s this much leverage in the system and when the system may already have a systemic deflation problem around the corner because of AI.
I’ve said this multiple times in the newsletter, and I completely believe that if we do start to see a financial breakdown or real strain on the system, a lot of the jobs that are lost will never come back. I think everyone is aware of that, from the US to China to Europe.
So pre-empting that issue is going to be massive.
Yes, I think this will probably lead to a bigger bubble than we’ve ever seen, but that’s not really that outrageous of a statement because there’s also more money in the system than we’ve ever seen.
I think we’re moving into a different paradigm.
I know that’s a difficult thing to say, especially when markets are already at their highs. It’s easy to say the bubble will continue when everyone inside it struggles to see beyond it.
But I don’t really see another option unless policymakers are willing to accept financial Armageddon. And when I say policymakers, I mean the central banks and governments of the world. If they still have options available, I don’t think they’re going to allow that to happen.
This is why I’ve been beating the drum about crypto for so long.
I don’t see many other assets where the potential return is as large as it is in crypto. It’s a digital product. I think we’re moving into a digital age. It has fixed supply, while the thing it is valued against potentially has infinite supply, and that supply may be about to increase again in an attempt to solve these problems.
On paper, it’s a no-brainer trade.
And technically, it looks like we’re starting to get the validation to support that on-paper trade as well.
Technically, the structural similarities between the lows in this cycle and the lows in the 2022 cycle are very similar.
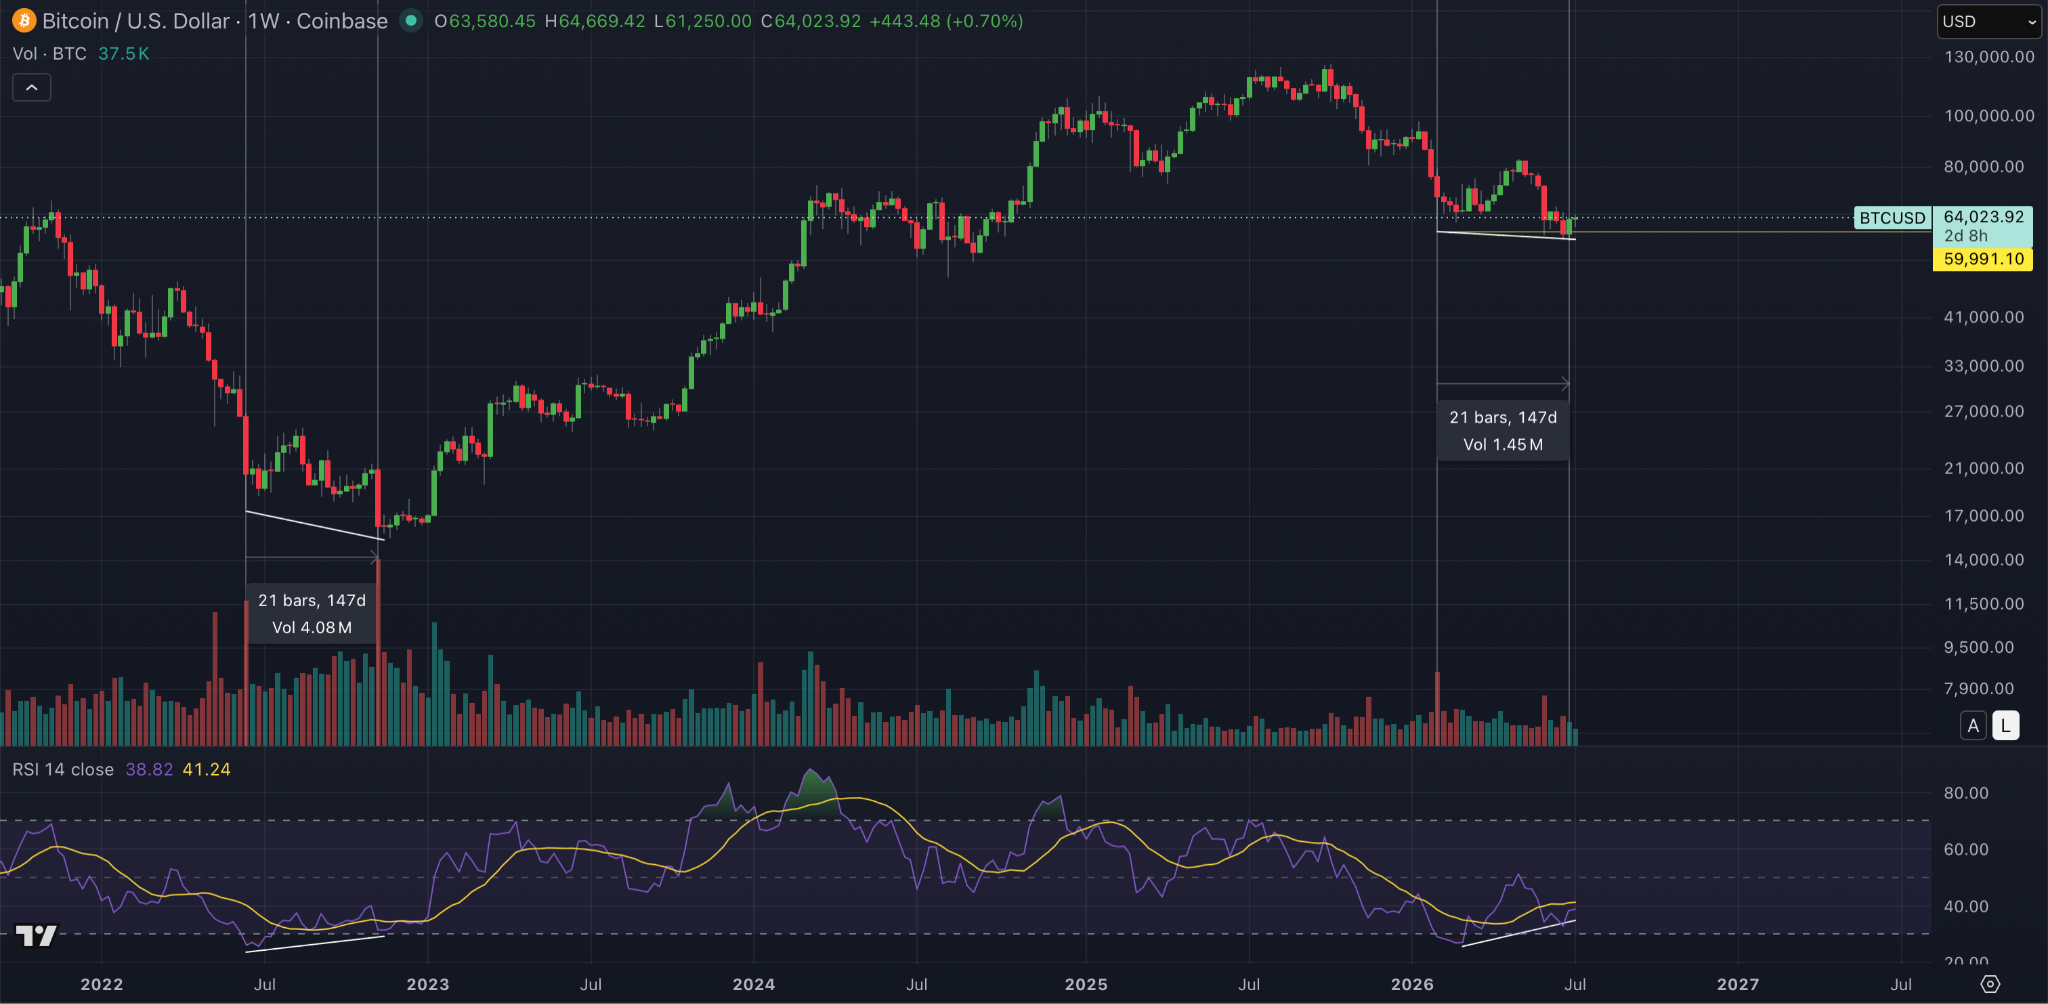
We’re seeing weekly bullish divergences form after around 147 days of chopping above, essentially, our previous wicks, then wicking the lows and potentially reclaiming them.
But if you look really closely at the chart, you’ll notice that around two weeks after we get this significant bullish divergence, we do actually come back and slightly wick the lows, if not backtest them.
If you look at the chart I’ve displayed, both cycles have roughly a 140 day bottoming period before we get this significant bullish divergence.
Then, two weeks later, or two bars later in the 2022 cycle, you’ll see that we came back down to retest those lows, if not set a slightly lower low.
That’s essentially what I’m discussing here on the lower timeframe.
Are we going to get that this week or next week? A retest of the lows or a slight wick below them?
Personally, I think we do, especially for XRP.
This chart is obviously Bitcoin, but maybe Bitcoin simply comes back, retests the lows, and then starts to fire out of here.
The structural similarities between both bear market bottoms so far are difficult to argue with. They’re extremely similar in both structure and length.
The only real difference is that this market is bottoming during the summer, whereas the 2022 lows came in Q4.
So there’s still the discussion around timing. Do we still bottom in Q4 this cycle?
But I think the structural similarities, the bottoming formations, and the macro backdrop all suggest that the lows are in and around this area.
Specifically for XRP, I do think we come back down to the lows if Bitcoin returns to its lows, as we saw in the previous cycle, whether that’s to sweep them or simply retest them as a double tap.
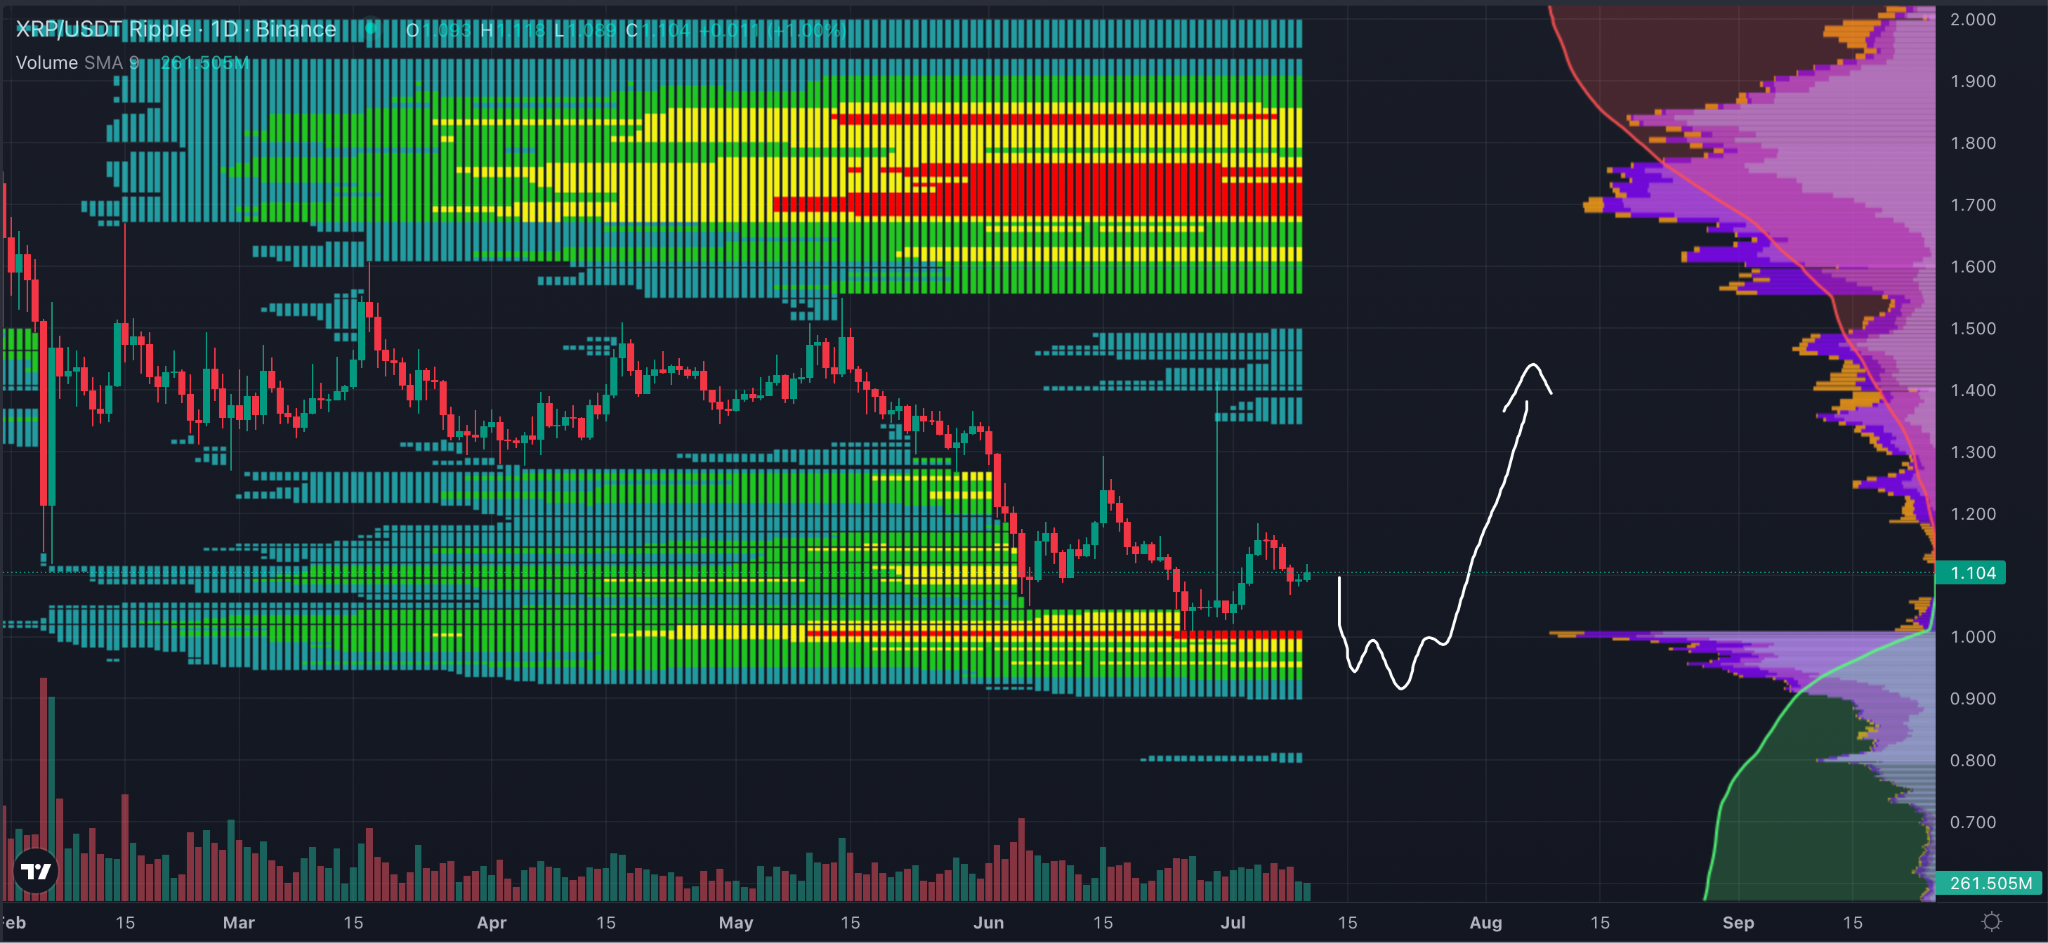
Now, this is very nuanced and zoomed-in analysis, but when we see the liquidity on XRP sitting around the $1 level, and with the dollar being such a key psychological level for everyone, I think it’s an easy place for people to capitulate.
I think a lot of people will be saying, “If it goes below a dollar, I’m out.”
There’s liquidity there, and I think that lines up with both the sentiment capitulation and the price capitulation that could really mark the exact bottom for XRP, especially if Bitcoin makes that move.
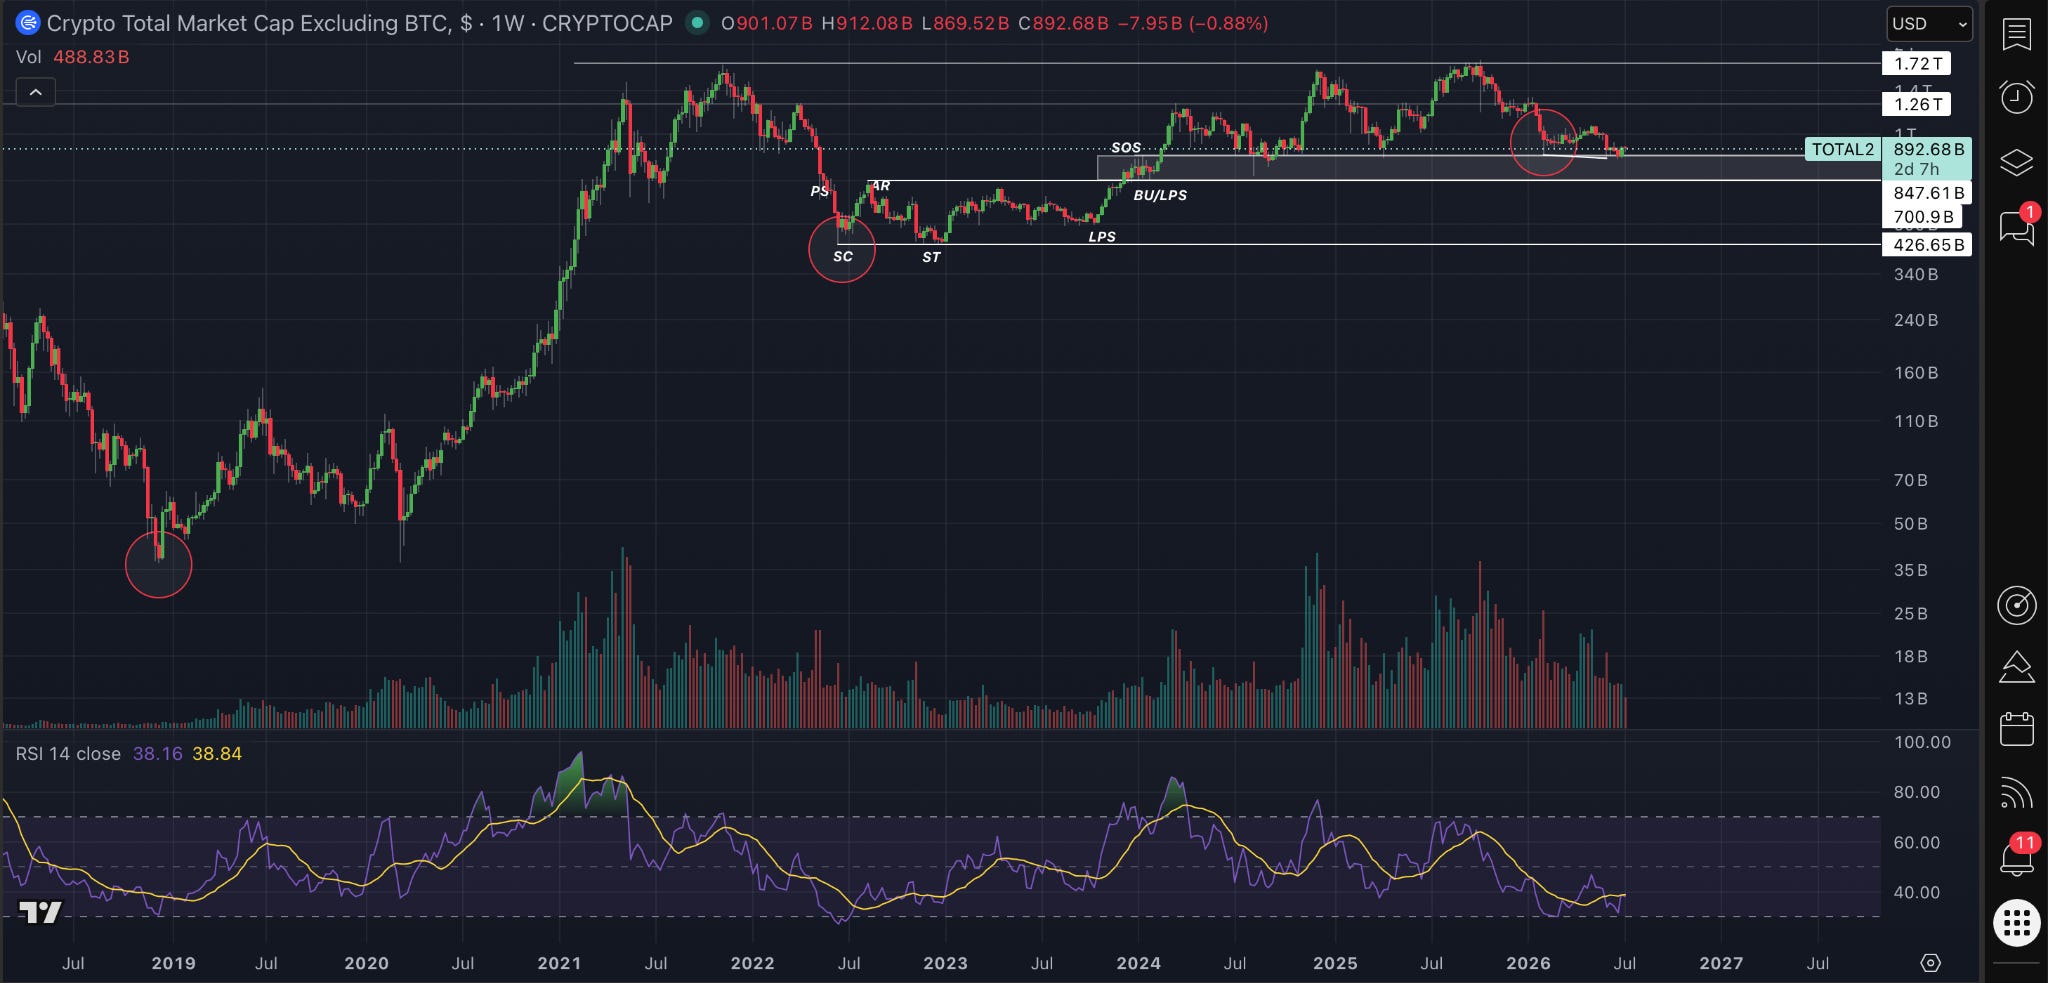
I wanted to touch on Total 2.
We’ve discussed this specific chart a lot. I first covered it back in February, and I said, look, when Total 2 hits the oversold area on the RSI, it has marked the exact lows for momentum. Once the RSI reaches that oversold area, it’s never gone lower than that in any previous bear market. That’s highlighted by the red circles you can see on each of the three occasions where we’ve been at the lows for Total 2.
Now, in the 2018 to 2020 bear market, including COVID, we made a slightly higher low on Total 2. So there wasn’t a bullish divergence in price, but we did make a higher low on the RSI and never retouched the oversold area.
In the 2022 market, we retested, or made a slightly lower low, which gave us a bullish divergence. We then completed the Wyckoff accumulation and started to push out, although we didn’t manage to reach price discovery.
I wrote a newsletter back in February discussing the possibility that this whole cycle has simply been consolidation or accumulation, and that we’ll see a massive explosion in price to the upside once we break above the 1.72 trillion level on Total 2.
In this cycle, it’s been the same so far. Once the RSI first touched the oversold area, it hasn’t gone back into it. Again, we’ve made a slightly lower low in price on Total 2 while making a higher low on the RSI, giving us that bullish divergence.
I really think altcoins are where you should be looking if you want to be buying.
Obviously, I think Bitcoin is still a bid for the long term, but I think altcoins, especially when you consider that we may have just been accumulating for the last six years, could be ready to really explode once we confirm these lows over the next few weeks or months, and then break above the 1.72 trillion level.
In my opinion, this is where you should be bidding altcoins, here and over the next few weeks.
This is it.
I think this is the best opportunity we’re going to get in crypto.
Unless crypto is going to zero, I think this is the best risk-to-reward opportunity we’ll get to buy crypto for at least the next four years.
Maybe ever.
Yoyoyo guys and girls. I think I have finally seen what I wanted to see, and I am bullish, at least for the short term. Over the past few weeks I have been saying that I wanted a bit more confirmation before I really committed to that bullish stance, and now I feel like I have got it.
Starting off with USDT dominance. On the daily timeframe this really looks like it is losing momentum, and I think that is going to give Bitcoin some room to move higher. You can see we have had a bearish cross on the 11 and 22 EMA on the daily, the Gooner EMA as we like to call it, and the RSI is also leaning bearish here. Because of that, my base case is at least a five to six percent move down on this chart.
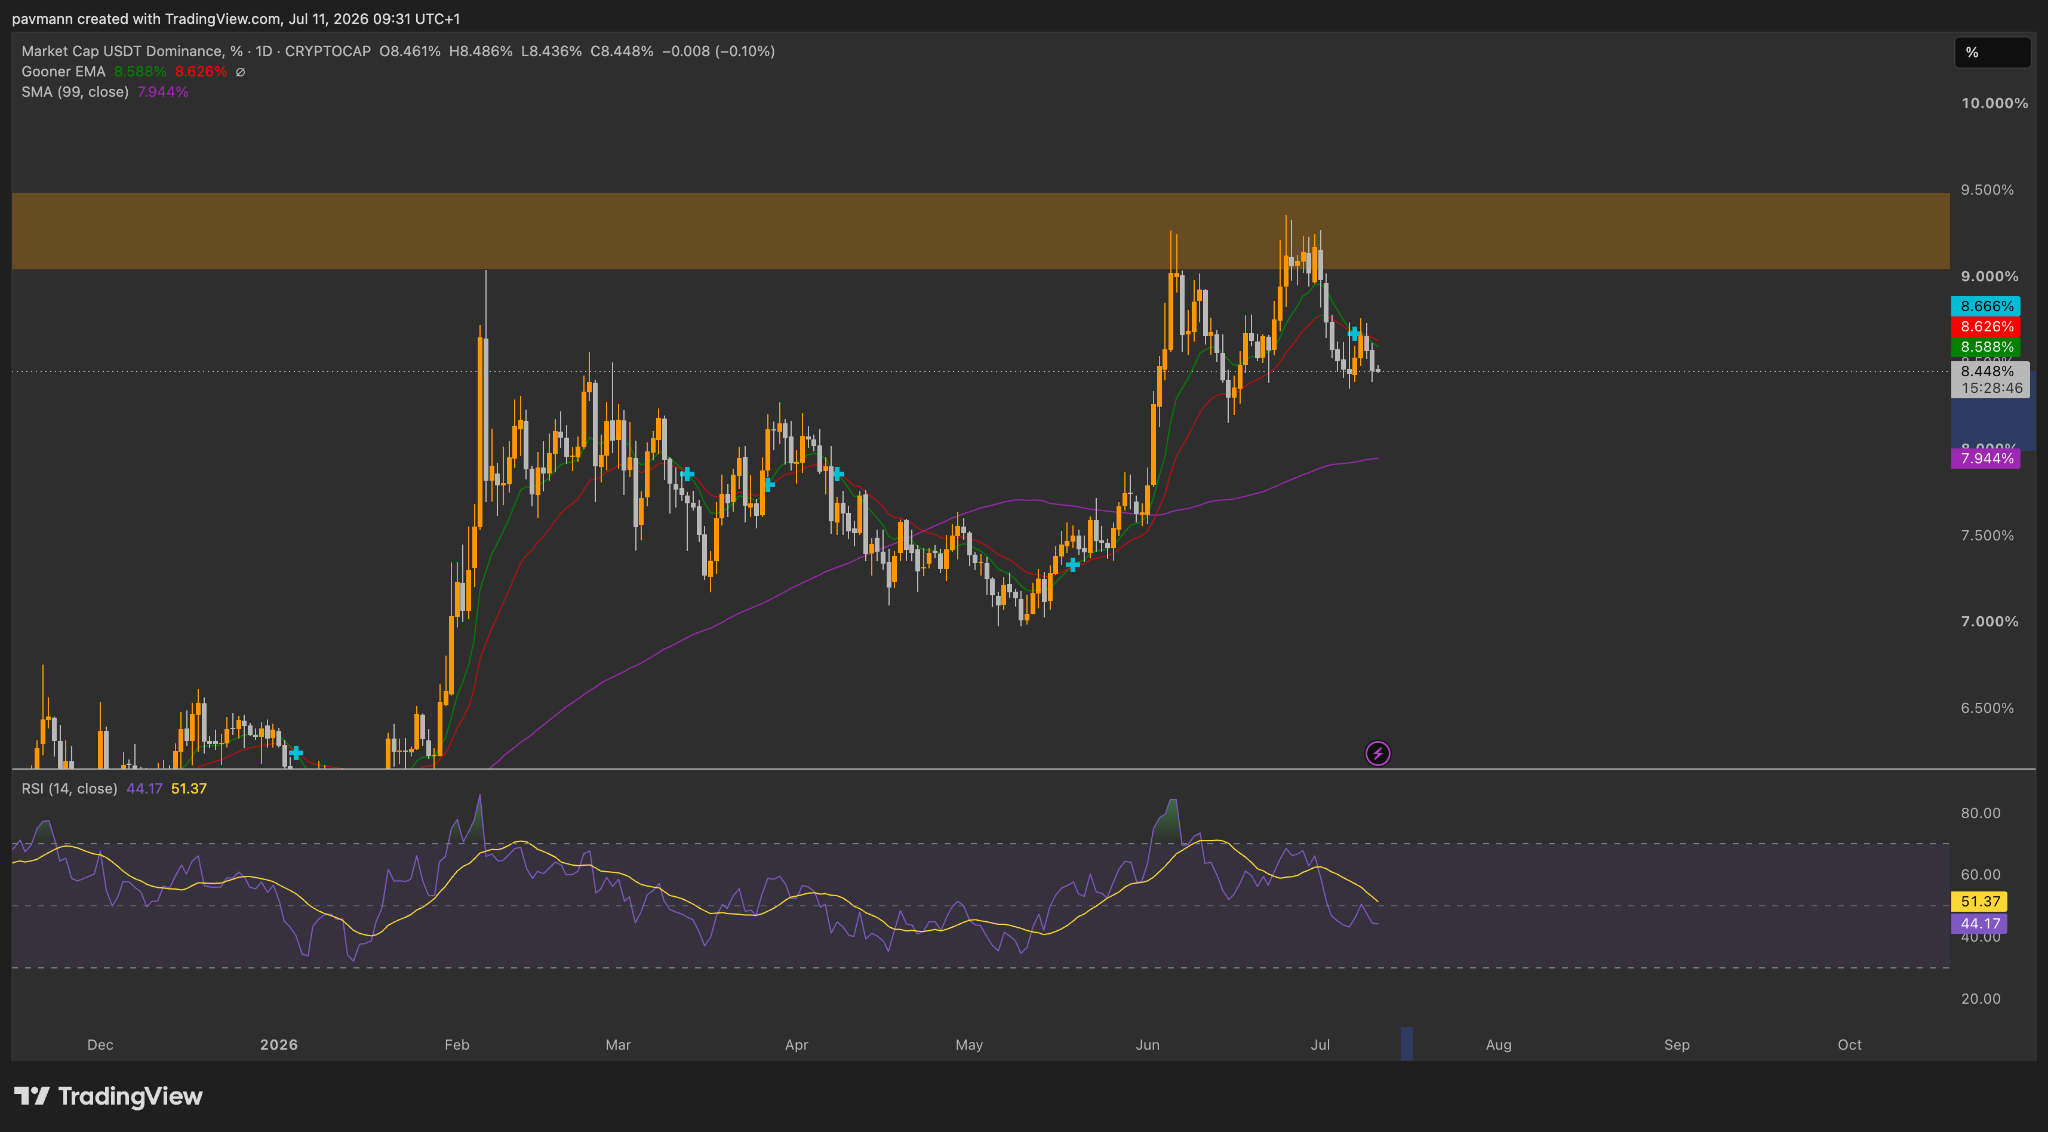
So let’s talk about what that could mean for Bitcoin.
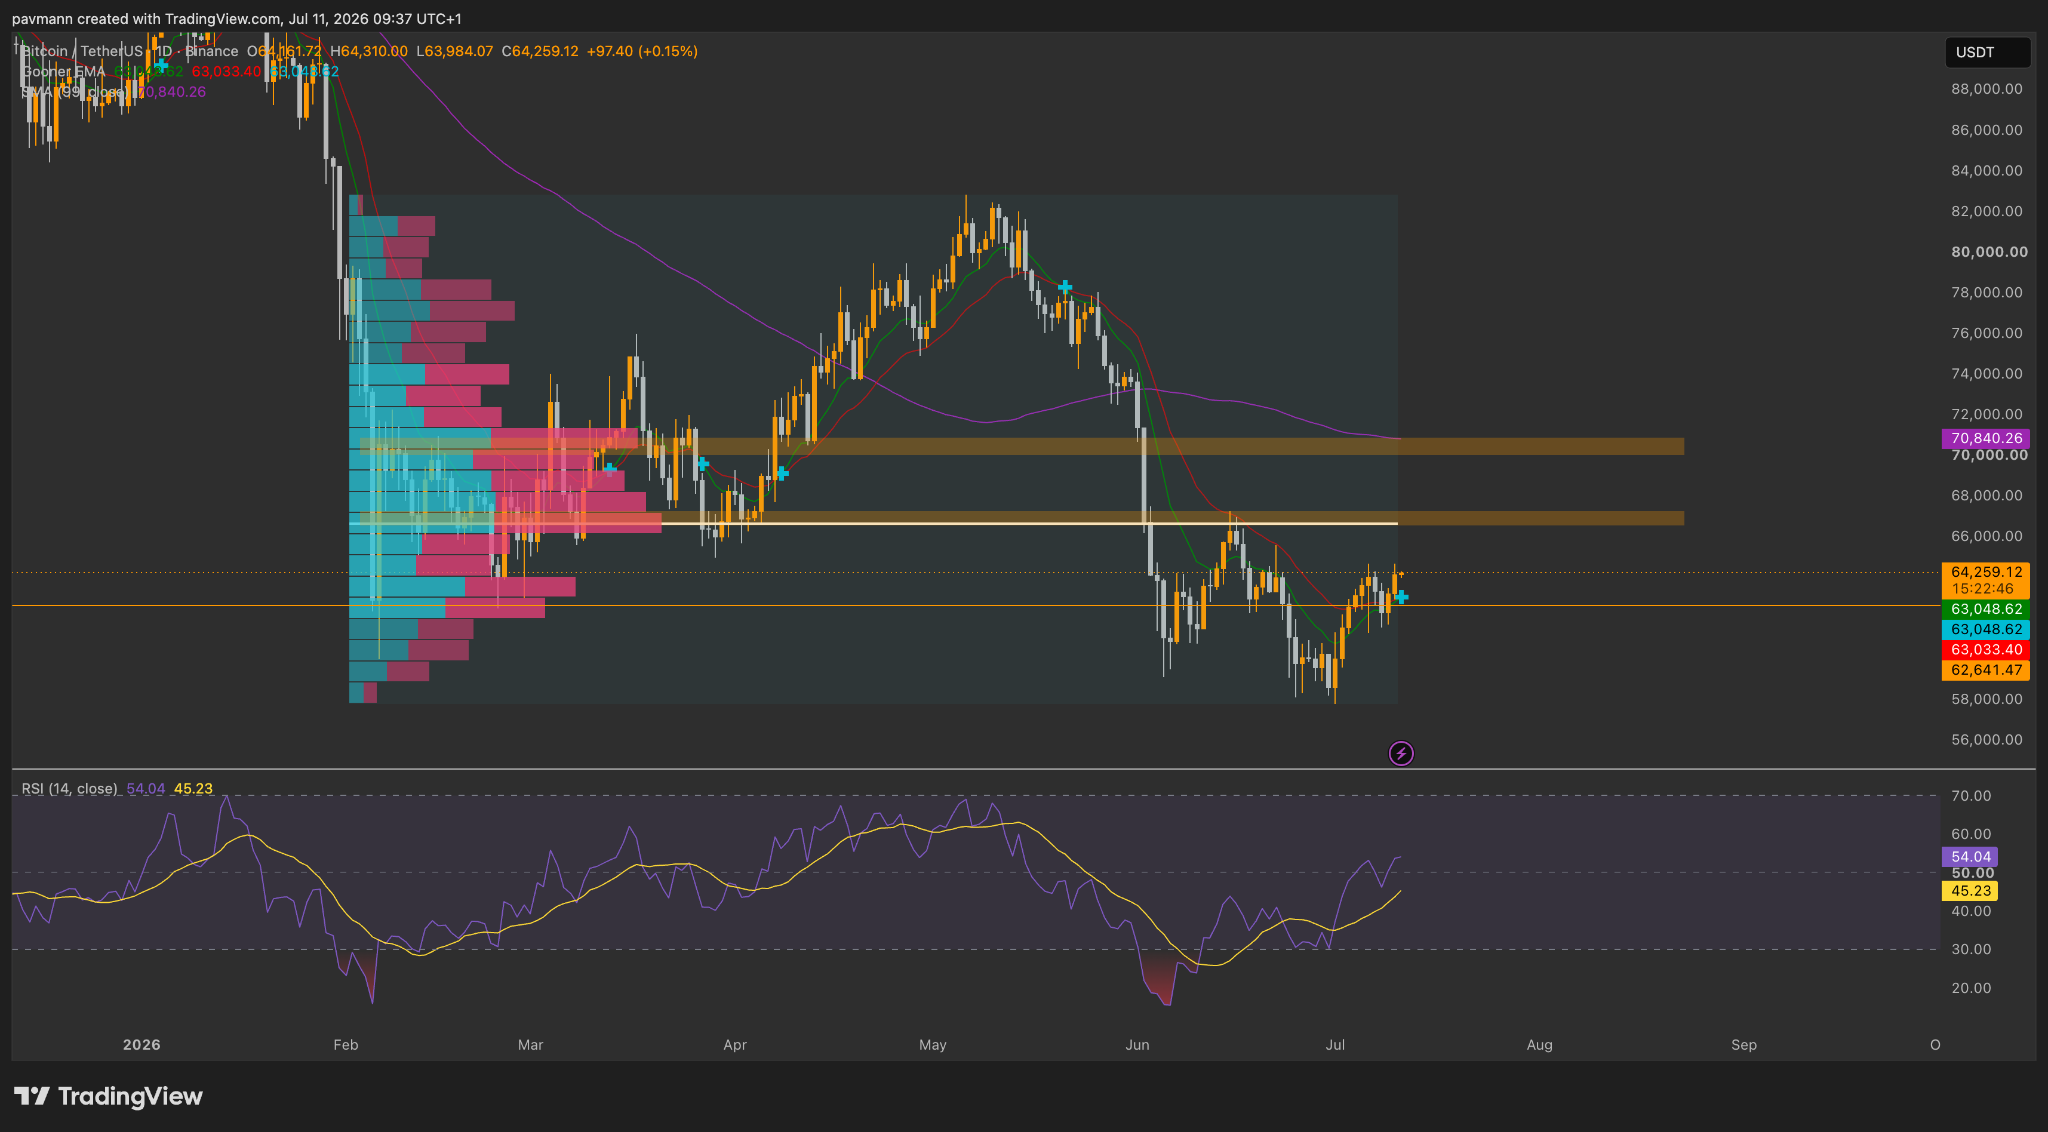
On the Bitcoin chart it is basically the inverse story. We have just had the bullish cross on the same EMAs, and off the back of that I have identified two zones of interest. The first sits around $67,000, and the second is up at $70,000 to $71,000. Both of these areas carry high volume and strong liquidity, which is exactly why I am watching them. My thinking is that if Bitcoin does push higher from here, these are the magnets price is likely to trade up into. Right now I am in a period of conviction, and when that is the case I am happy to take good risk to reward trades and lean into the setups I am seeing.
I am bullish on alts, but the question is always which ones. Boys, not going to lie, DOGE is looking like one of them right now. Just look at where it bottomed.
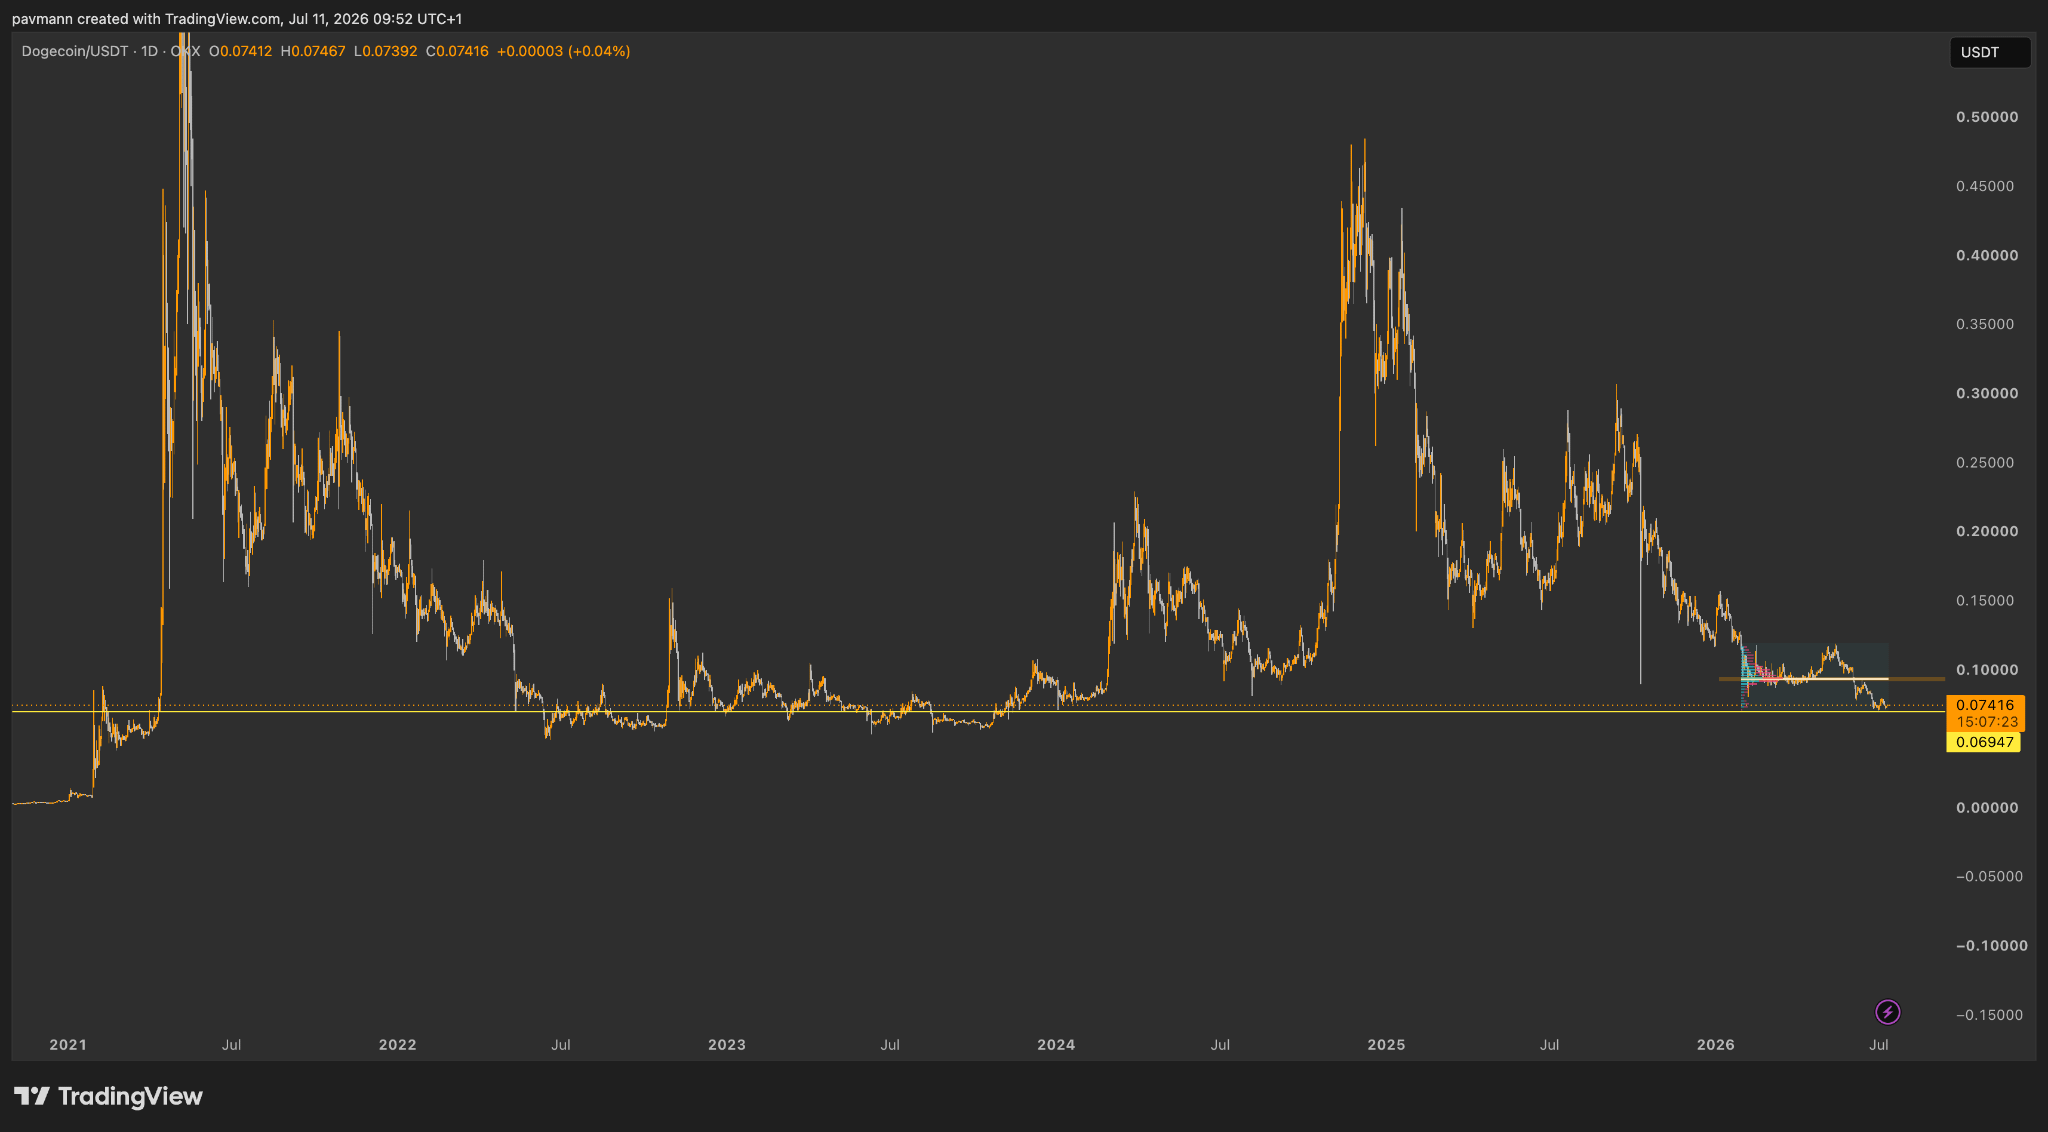
It’s hard to see from this but is a huge area of support for DOGE. Then we zoom in and you can see why I’m interested. Maybe I’m front-running this and should wait but because of my overall conviction I’m happy to take the risk here. On the daily we’ve got a bullish divergence, and the bollinger bands are contracting suggesting a pop in one direction. It’s struggling to get above the mid zone of the bollinger bands but IF it does get past this. It’s off. When I look at the upside I’m thinking of a cheeky 20% move. We know how $DOGE moves when it gets going. One to watch for sure.
LINKS:
This newsletter is free because we love sharing our insights with the community. If you enjoy it and find value in our work, consider supporting Pav’s and Will’s Beer/Coffee Fund by donating $XRP to our newsletter donation wallet below. Cheers!
$XRP donation wallet: r3qf2nALyhFwC46QqZ5gJHpF3cjr5gRcoV
Trade XRP Memes here:
https://firstledger.net/?ref=6NRu4StwrImq
Trade on MEXC: https://www.mexc.com/register?inviteCode=mexc-1etb1
Trade on WEEX using this link: https://www.weex.com/login?from=https%3A%2F%2Fwww.weex.com%2FnewbieActivities%3Fid%3D520%26type%3DBEGINNER_TASK%26vipCode%3Duspf
Trading Different (Liquidity Map) - https://t.co/3ks3QMT5VJ?ssr=true
No posts
Comments
Nothing yet. Say the first thing.
Sign in to join the conversation.