
The content below represents the personal views and opinions of the authors. It should not be considered as investment or financial advice.
I wanted to start this week by discussing oil. Oil has followed the route that we thought it would take, coming down towards that $66 level before bouncing back towards the $80-ish level.
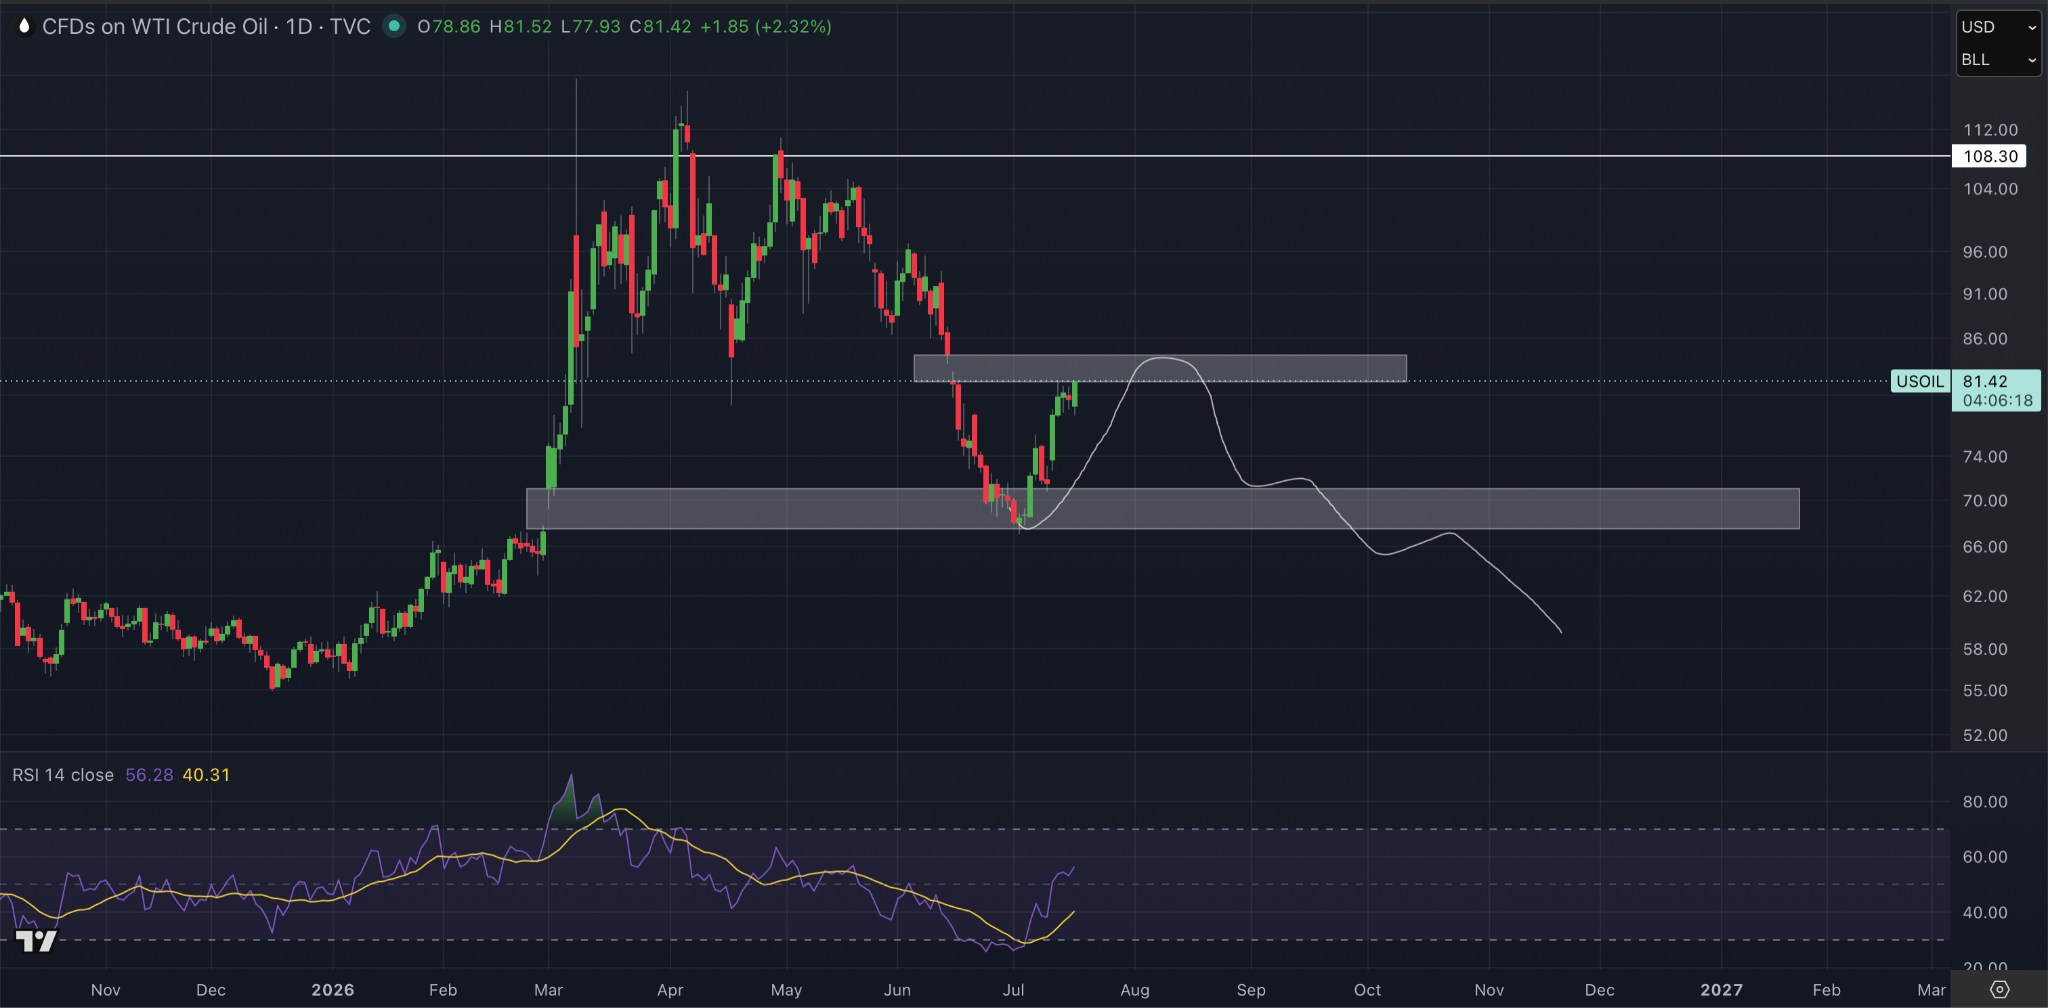
I still think it has slightly higher to go. As we discussed, there was this gap, and that’s why I made the technical call for this. To be honest, there’s also a slightly higher gap towards the $96 level that could still be filled.
The reason this has really kicked back up, from a narrative perspective, is because the U.S. and Iran have really started to go back at each other again. Now, there is obviously the possibility that this pushes higher. I don’t think that’ll be the case because there’s a lot of previously locked-up oil that came through the Strait of Hormuz which is now on the water and will start reaching the countries it needs to get to. So I think this is more likely to be a lower timeframe, shorter-term spike.
With that being said, no one knows what’s going to happen with this conflict. I do think that, even in the short term, there’s still a little higher to go here because, if you look around at some other charts, there are a lot of things teetering on the edge of becoming a bigger issue.
I still think the most likely route is that we get one final flush across a few different cryptocurrencies, including XRP, as I’ve discussed in previous weeks and will highlight again today. Again, whether we get that or not, I don’t know. But when we look around at some of these other charts, we still have to acknowledge those question marks.
And if we take into consideration that today is Friday, with the war having escalated again this week between the U.S. and Iran, you have to think that after the market closes on a Friday is the time to be the most skeptical.
Another chart that I’ve been highlighting as an area of concern is the US dollar against the Japanese yen, which, in three hours and 54 minutes from the time of writing, will set its highest weekly close since 1986.
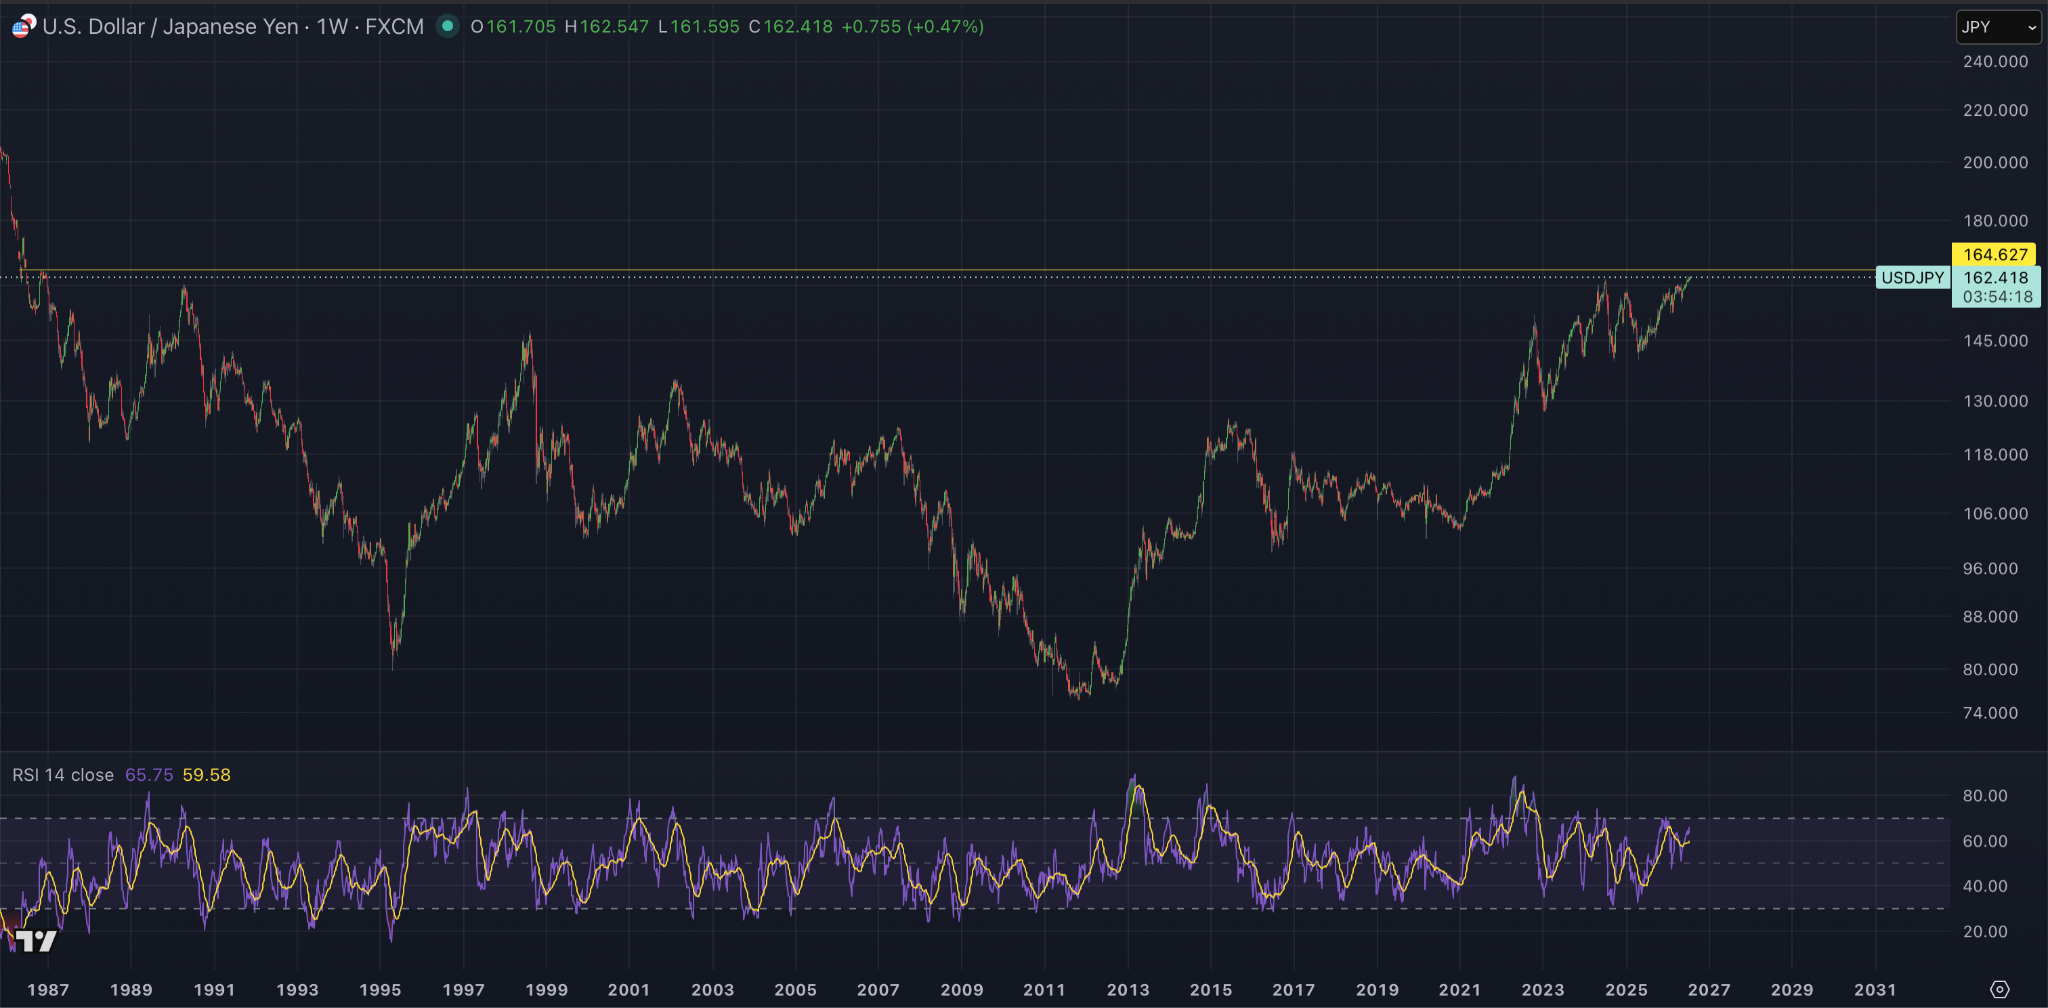
We have continued to see the Japanese government intervene at these levels. But as I’ve suggested in previous newsletters, because they may need to sell Treasuries to raise dollars to buy the yen back against the dollar, there are a whole list of potential second and third order implications if the Japanese yen continues to lose strength.
We’ll have to see whether we do get this move a little bit higher for the US dollar against the yen, or whether there’s going to be a coordinated effort to stop it.
Now, if you add this into the Iran bucket, you’re looking around and thinking that we’re teetering on some sort of global issue. There are obviously other issues at the minute, not just these two. But as I’ve been trying to highlight over and over again, I don’t think they can let these issues become too large or too systemic because of the addition of AI to the discussion and the fact that AI creates, in my opinion, a deflationary pressure that could last for a very long time.
Essentially, what I’m saying is that the system is so leveraged, and things are on the edge, but they can’t go over the edge. Otherwise, we could have some sort of systemic collapse. I don’t think, in a world where humans are as greedy as they are, and especially the people in power, who are arguably the greediest, that they’re going to let the system collapse when they still have tools available to protect it.
That’s also why we have governments, central banks, and financial regulators. Their job is to try to maintain stability in the financial system. I think stability will come. It’s just a question of whether we get this scare first.
Now, we’re heading into August, and a lot of people and companies take breaks during July and August. That means there are periods of lower liquidity, and it’s during those periods that I think we could really see a scare.
Again, we’re also heading towards the US midterms. It’s convenient that oil has come down because Trump can probably bring prices at the pump lower. I think the next step after that is some form of stimulus, but they’ll need an excuse for that stimulus to come in.
Maybe it’s the Japanese yen, like I’ve said. Maybe it’s the renewed Iran conflict. Maybe it’s one of a whole list of other things that are developing right now. But these are the main areas that I’m watching, especially as you’re seeing US Treasury yields continue to move higher.
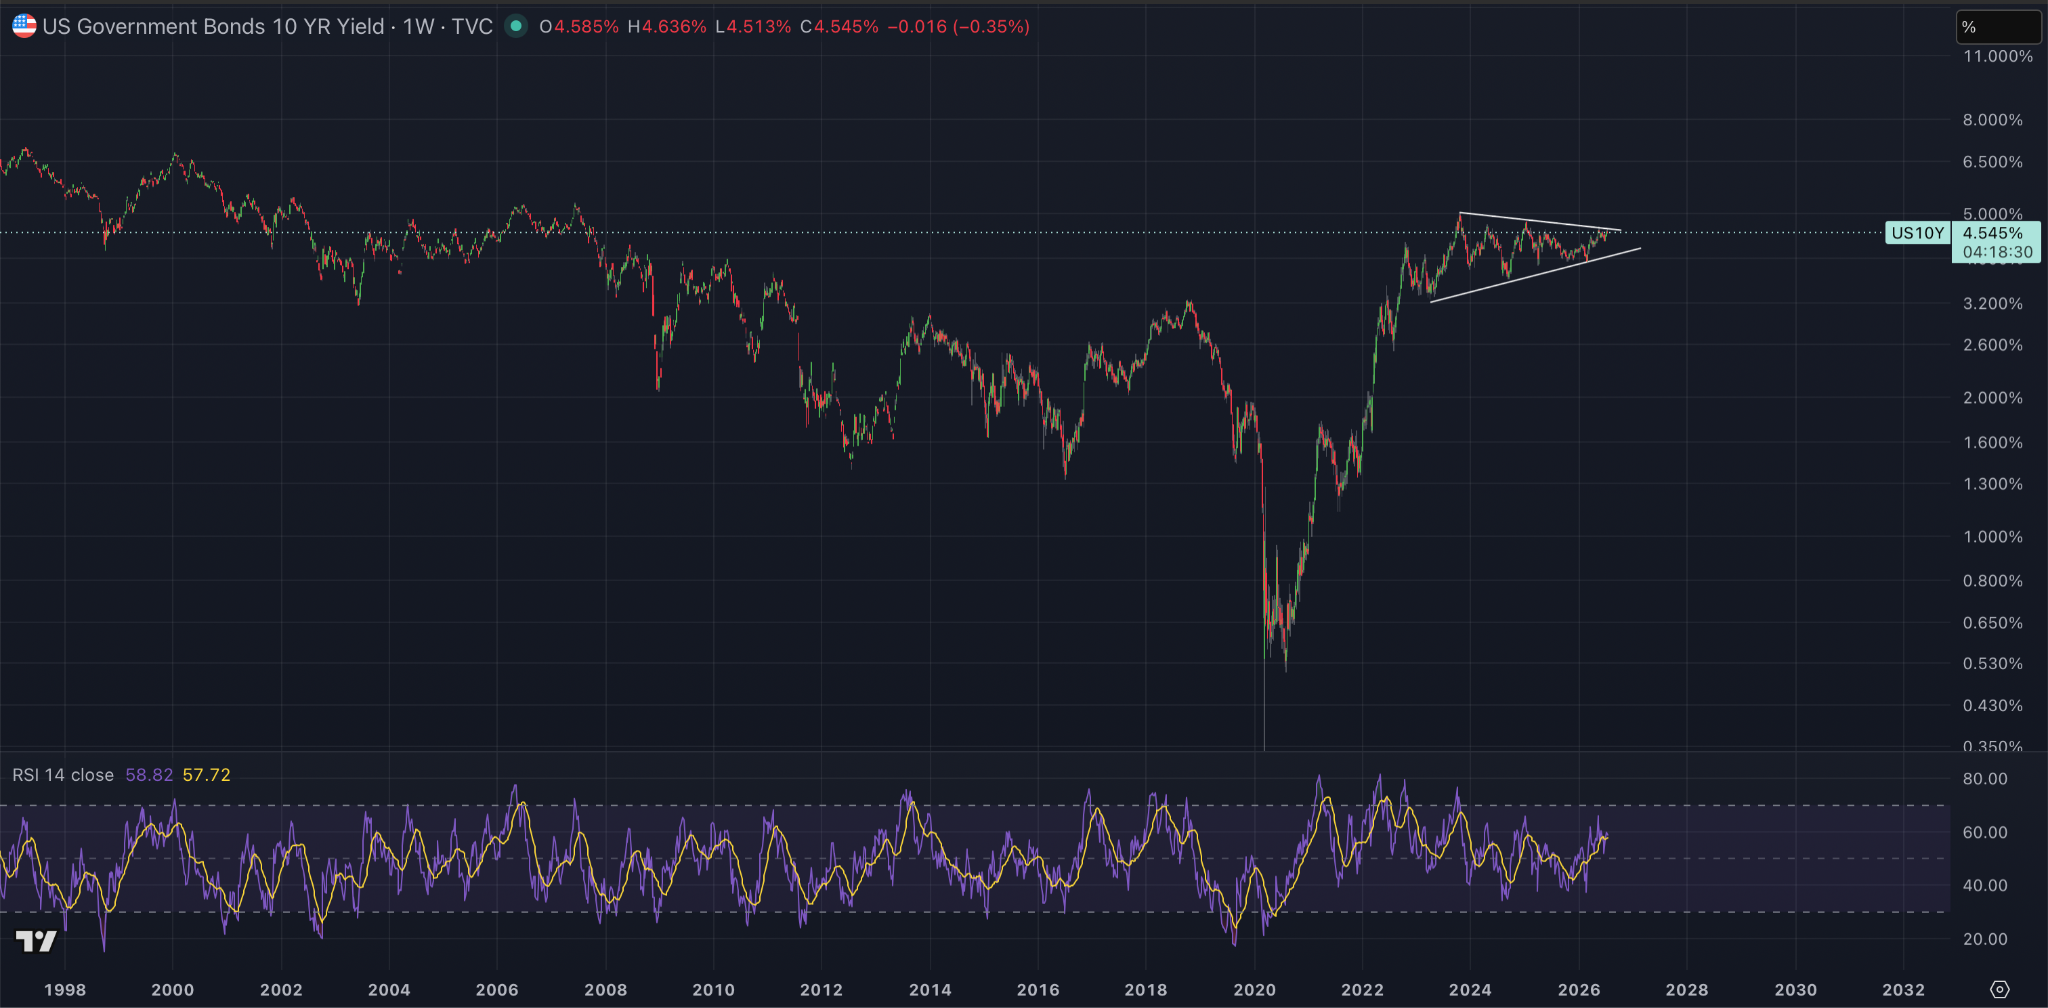
They’re not at breakout levels again yet, but they are at what I’d call question mark levels. The US 10 year Treasury yield is approaching a potential bullish pennant breakout. Again, when we’ve reached these levels in the past, the US government has either stepped in with some form of verbal intervention or monetary intervention to push yields back down. They want to maintain confidence in the US.
So there’s a lot that’s going to have to happen here, and I think it will require coordination between governments. But we may see some financial strain first, and that’s what I’ve really been trying to highlight.
I think we’ll get another dip in crypto because, if we see a move higher in any of these macro indicators, I think crypto will react in the opposite direction. I wouldn’t necessarily call it a liquidity event because I think people sensationalize that phrase a little bit. But I do think we’ll get some sort of scare or crack, and then that crack will be flooded with whatever is needed to stop it. In my opinion, that will ultimately be liquidity.
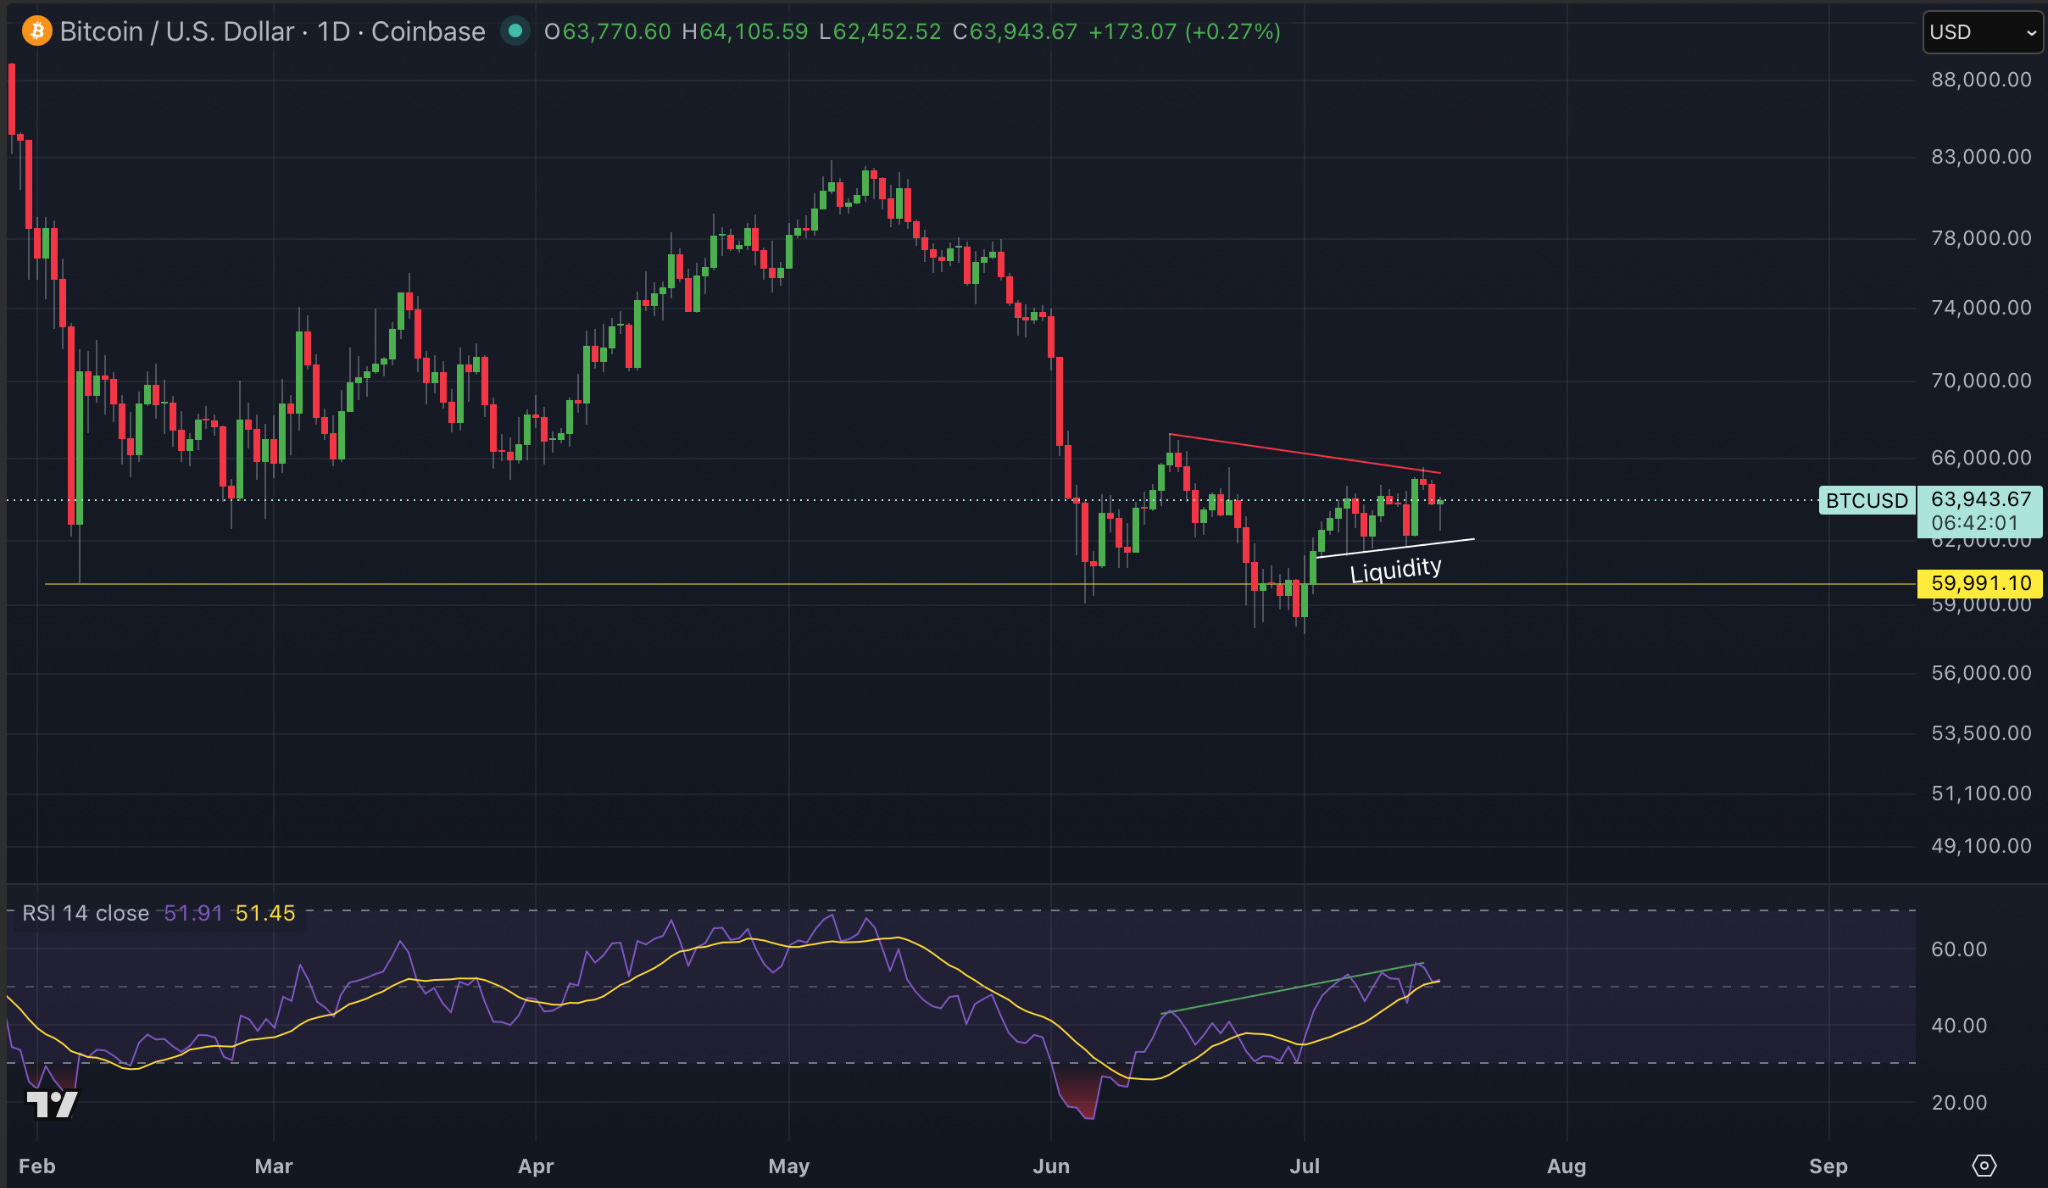
If we move on to crypto and look at how this move could play out, again, I’m not 100% sure on this. I think there’s a lot of higher timeframe evidence to suggest that the lows for crypto could already be in. But in the short term, if we’re going to continue with the thesis that I’ve discussed above, there’s a lot of liquidity building below Bitcoin’s lows since the 4th of July.
We’ve got about two weeks’ worth of slightly higher lows, but we haven’t really put in a higher high for Bitcoin either. So it’s basically just an accumulation-type pattern. Again, there’s liquidity building below those lows.
At the same time, people are discussing the fact that we could be forming an inverse head and shoulders bottom here, and I do think that’s a valid argument. But I can also see bearish divergence on the daily timeframe, where we’re building higher highs on the RSI while, so far, we’re building lower highs in price action.
I think we could see a sweep of that liquidity for Bitcoin, maybe a retest down towards that yellow line around $59,900, or potentially even a sweep of the lows. If we came down to that $59,900 level, I’d start looking at whether we were going to continue lower or not if price began to stall there. At that point, you could really start to build the argument for an inverse head and shoulders and a potential bottom.
But I do think the liquidity below that white line will be swept. I know these are micro moves that we’re talking about, but like I’ve been saying over the last few weeks in these newsletters, I do think we’re very close to, if not already at, the lows. What we’re trying to do here is maximize our cash positions and maybe get some leveraged longs in around these levels. So we need to look at Bitcoin to give us an indication of what could happen next.
Again, I think it’s highly possible that we do sweep the lows because of these bearish divergences forming on the daily, combined with the issues we’re seeing in the wider global economy.
I think that if we do get that sweep, it’s time to really put all your money on the table. I’m looking for a minimum move towards $59,900, but realistically I’m looking for a lower low, potentially down towards $58,600, just to close all the gaps that we can see there.
We’ll have to reassess this as and when it happens. But the daily RSI has also climbed pretty high and has plenty of room to move lower. Again, it could continue to build a bullish divergence if the daily RSI dropped to around the 35 region while price made another lower low. That would then give us a triple bullish divergence at the lows.
So we’ve got a lot to watch here, and there’s a lot setting up for potential bottoming structures. I just don’t think we’re quite there yet.
Now, if we add the discussion of open interest, which is essentially leverage in crypto, or Bitcoin in this case specifically, and have a look at when funding turned positive, we can suggest that the increase in open interest is coming from long positions because there are more longs in the market than shorts.
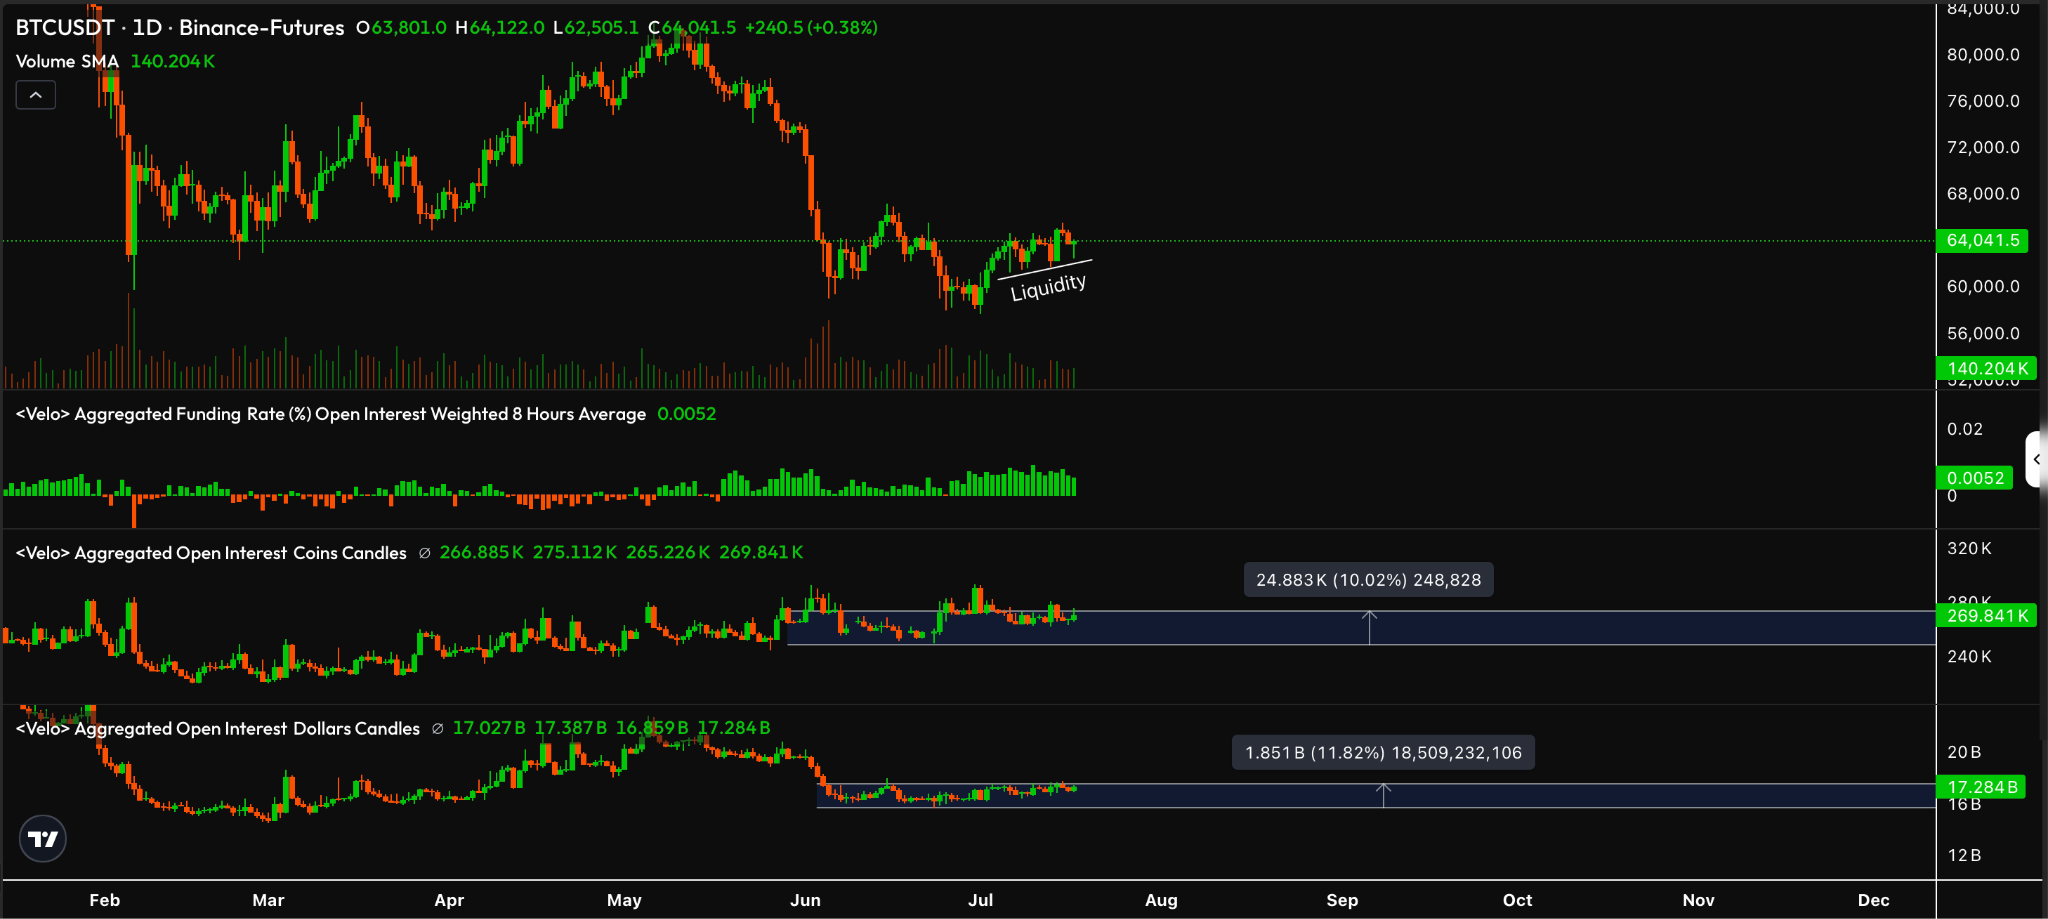
What we can see is that, while we’ve been in this lower range, open interest has actually increased by about 10%. That kind of adds to the theory I’m discussing here of one final flush to get rid of this last 10% of traders who are already trying to long the bottom.
Maybe the market wipes them out before potentially continuing higher for Bitcoin. That would line up with everything I’m thinking from a macro perspective. A little push down, liquidate the people who tried to jump in early, and it would also fit with what I think would be a sentiment collapse, where everyone probably gives up on crypto and thinks, “This is it.”
Maybe it starts to feel like a Great Financial Crisis-type moment. These are big calls to make, but I’m just trying to think through how people are likely to feel if we get one more push lower. I don’t think people will be very happy about it, and that’s normally when you find the lows.
To be honest, I actually think this setup is a bit clearer on XRP than it is on Bitcoin.
I’m trying not to fall into the trap of being bearish at the lows because I am not bearish on these assets.
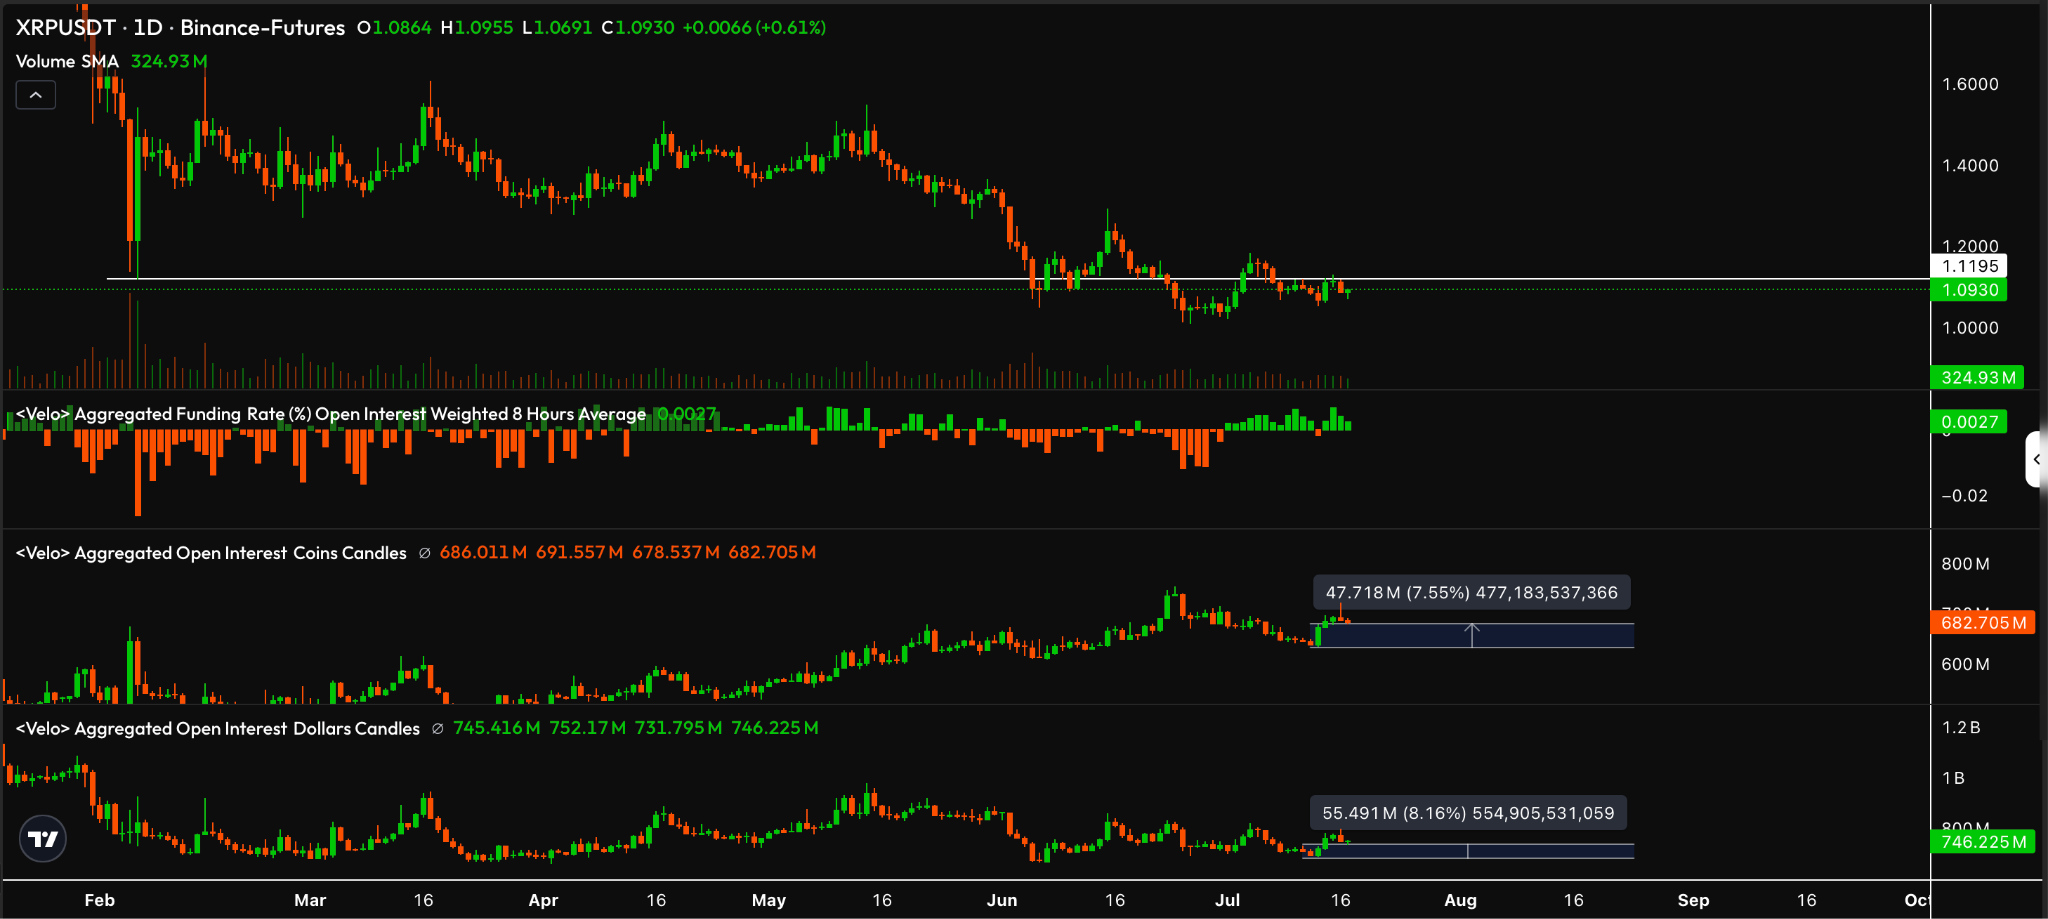
But if you look at XRP specifically, we still haven’t managed to reclaim the daily wicks from the 6th of February. We haven’t managed to reclaim that range yet.
Over the last three days alone, we’ve added roughly 7% open interest in terms of coins and around 8% in dollar terms. So we’re still below that range, price has essentially gone sideways, funding is positive, and we’ve added roughly 7% in open interest.
To me, that’s basically saying we’re banging our heads against resistance, and people are really trying to push the price higher with leverage.
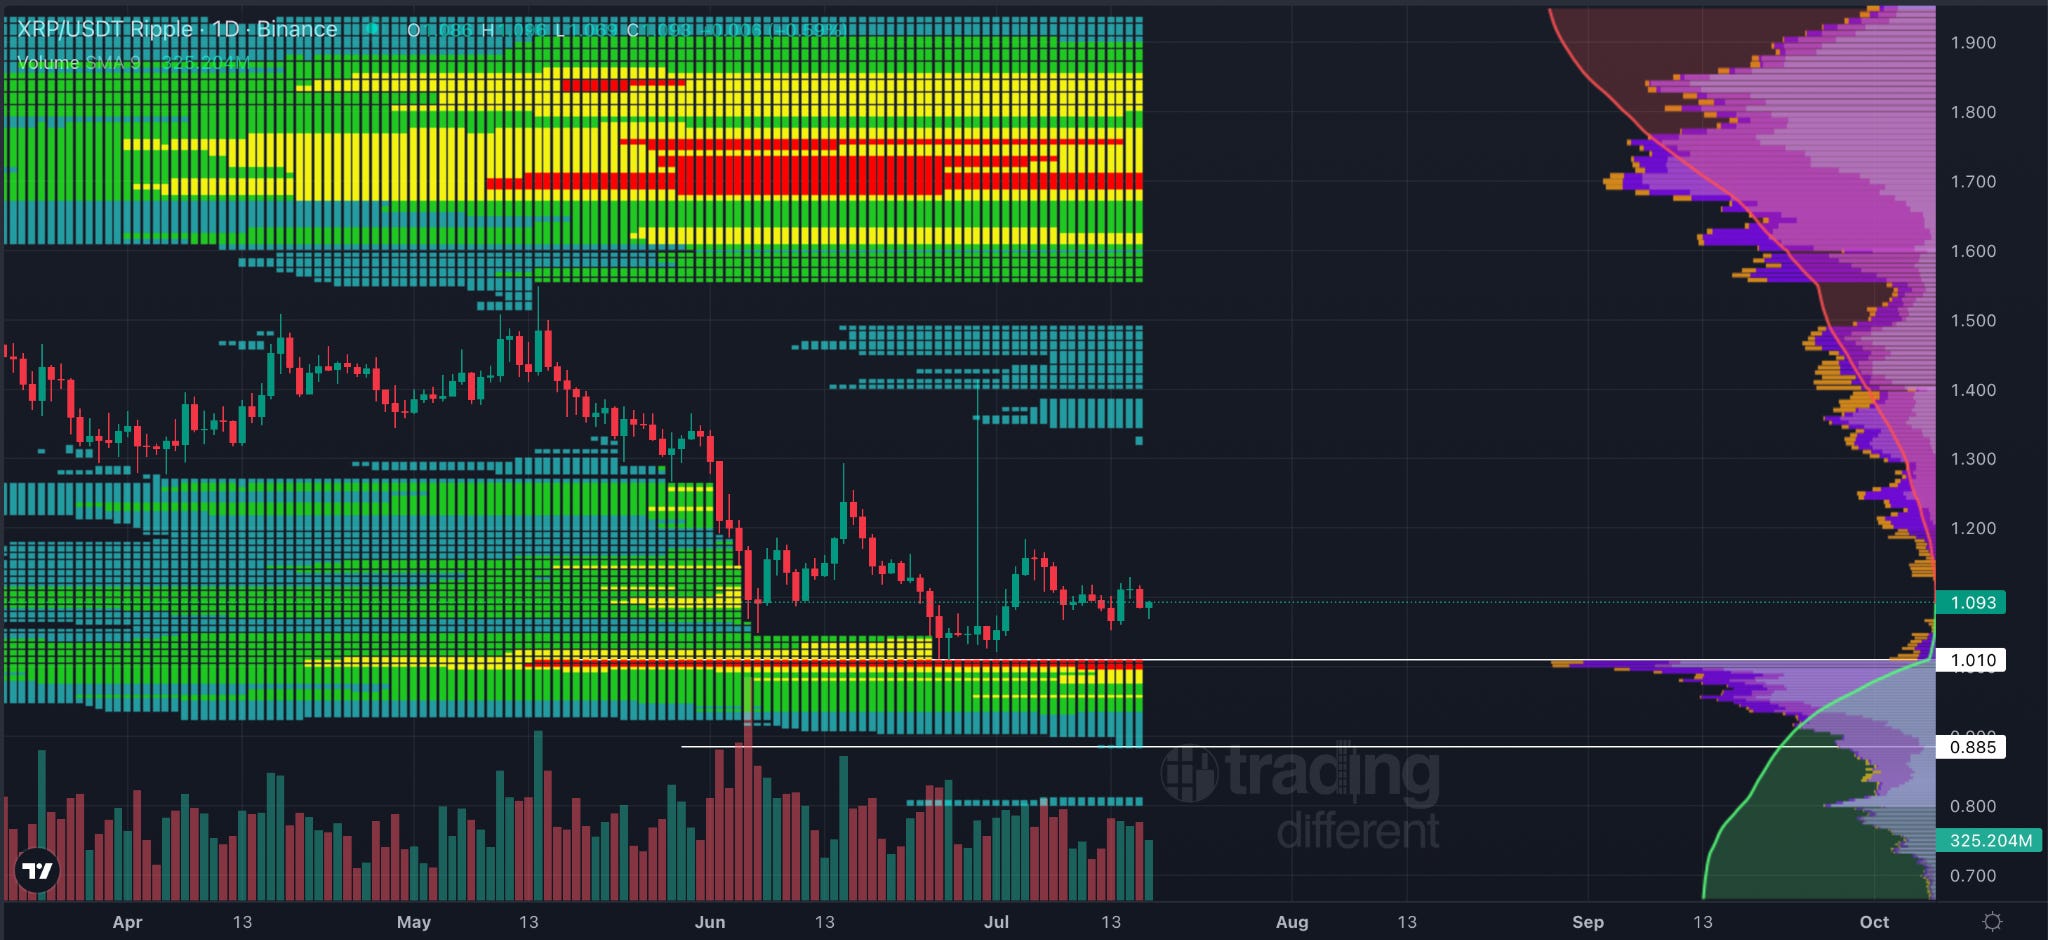
I actually think, and somewhat hope, that we do get this flush down towards the $1-ish level because then we can sweep the liquidity that you can also see here on Trading Different.
At that point, I think the only real argument left would be to be bullish.
If we get the move down towards this $1 area, or just below it, somewhere between $1 and $0.88, then there’ll be very little liquidity left to the downside. The upside liquidity will be what’s left. We’ll also have flushed out the extra open interest that we’ve been discussing.
Then, if you zoom out onto the higher timeframes, which is what I’ve been trying to discuss anyway, things look pretty flipping good.
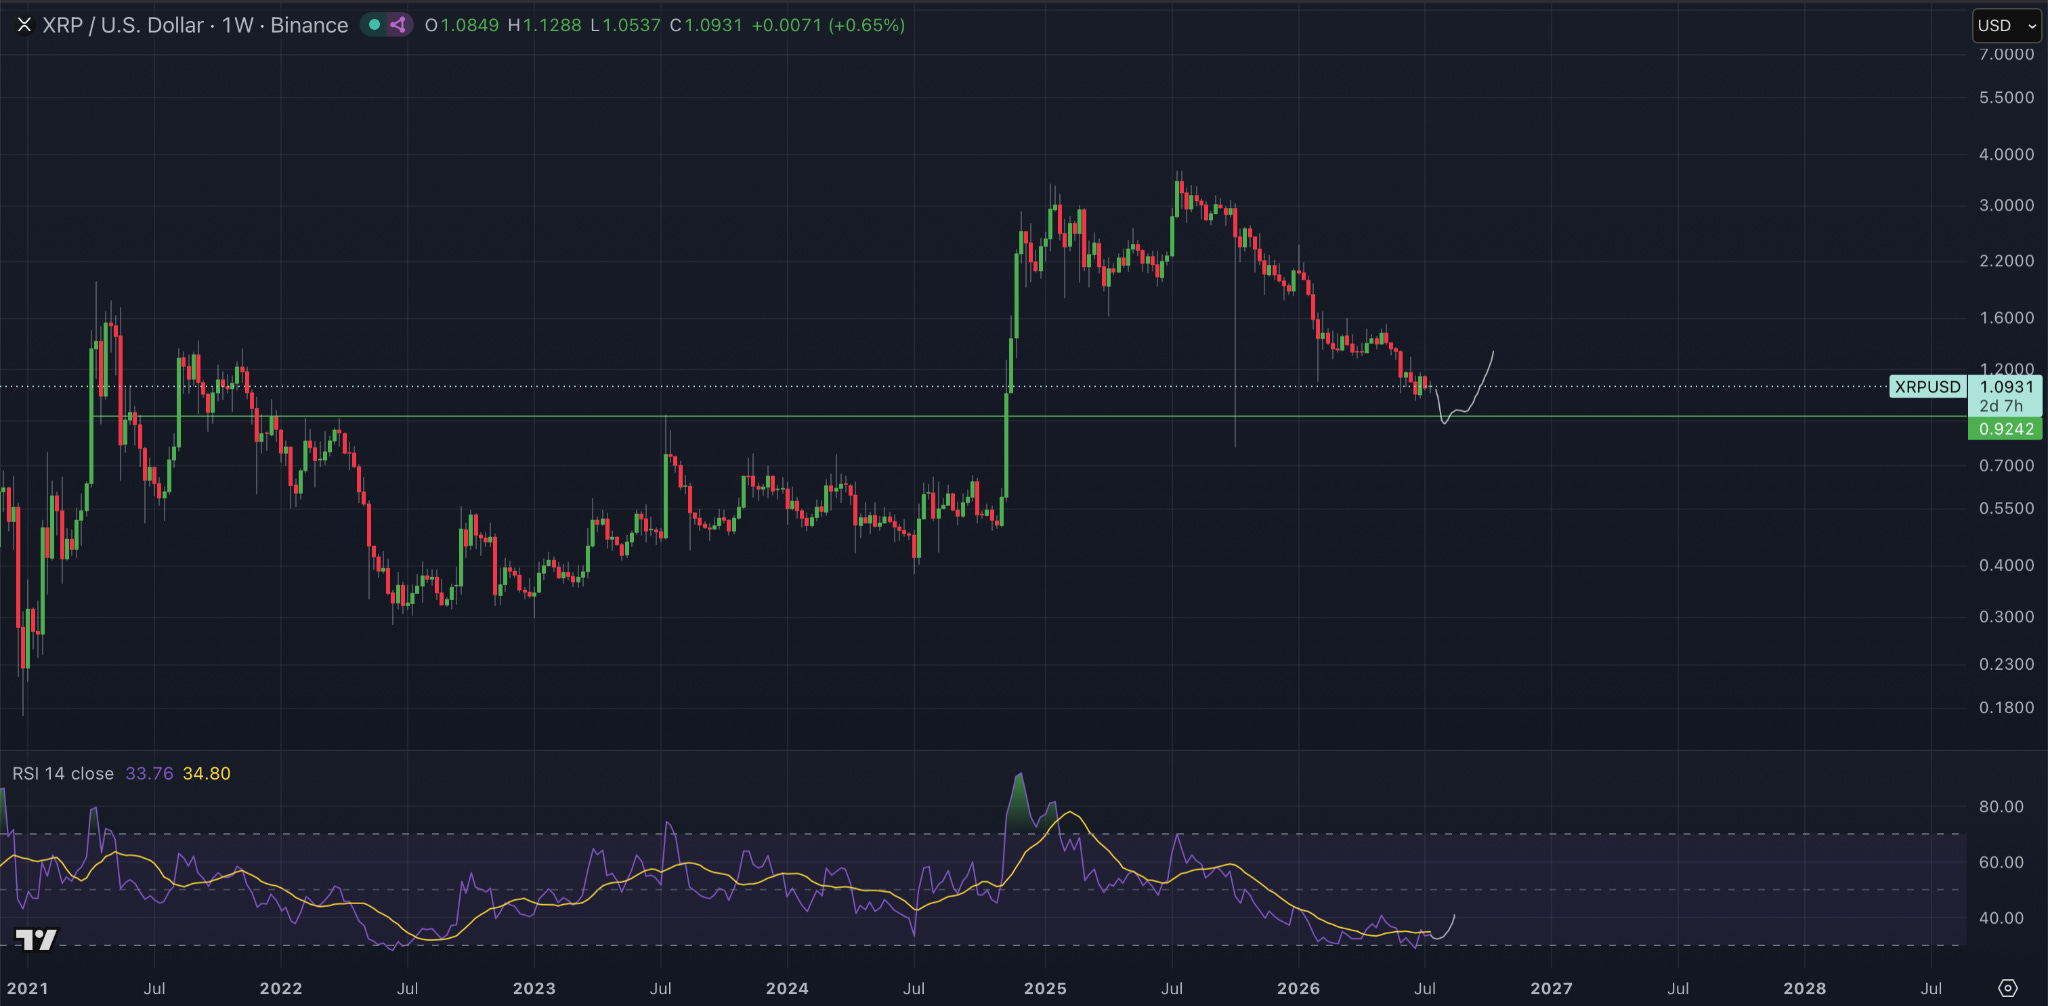
We’ll basically have all the factors that you might need to complete a pullback for XRP. We’ll have pulled back into support, we’ll have touched the oversold area on the weekly RSI, and those are all the things we’ve historically needed to complete down moves for XRP. That’s exactly what I’m looking for.
I’m not sitting here trying to be bearish. What I am saying is that these are the most likely areas for price to reach and react from. These are the levels where I’ll be putting my last little bits of money into the market, and where I’ll personally be looking to take leveraged long positions.
I’ll be excited if we get there. I’ll be doing nothing but bull posting if we reach those levels. I personally hope we get it because then I think we can really start to move aggressively to the upside.
If that lines up with everything I’ve discussed on the macro side, you could see some really, really aggressive candles back to the upside as liquidity starts flowing. It could be a really exciting period.
We’ve just got to watch these next few weeks to months for a bit more chop. If we can get this wick, and that’s what I mean by a panic in the financial system followed by an influx of capital, then hold on to your horses because I think it’s going to be an exciting period to be a crypto holder.
Honestly, I do not think much has changed from what I discussed last week, so I am not going to repeat myself here. I am personally short term bullish and I think we see this relief rally continue, and one of the reasons for that comes down to the USDT.D chart.
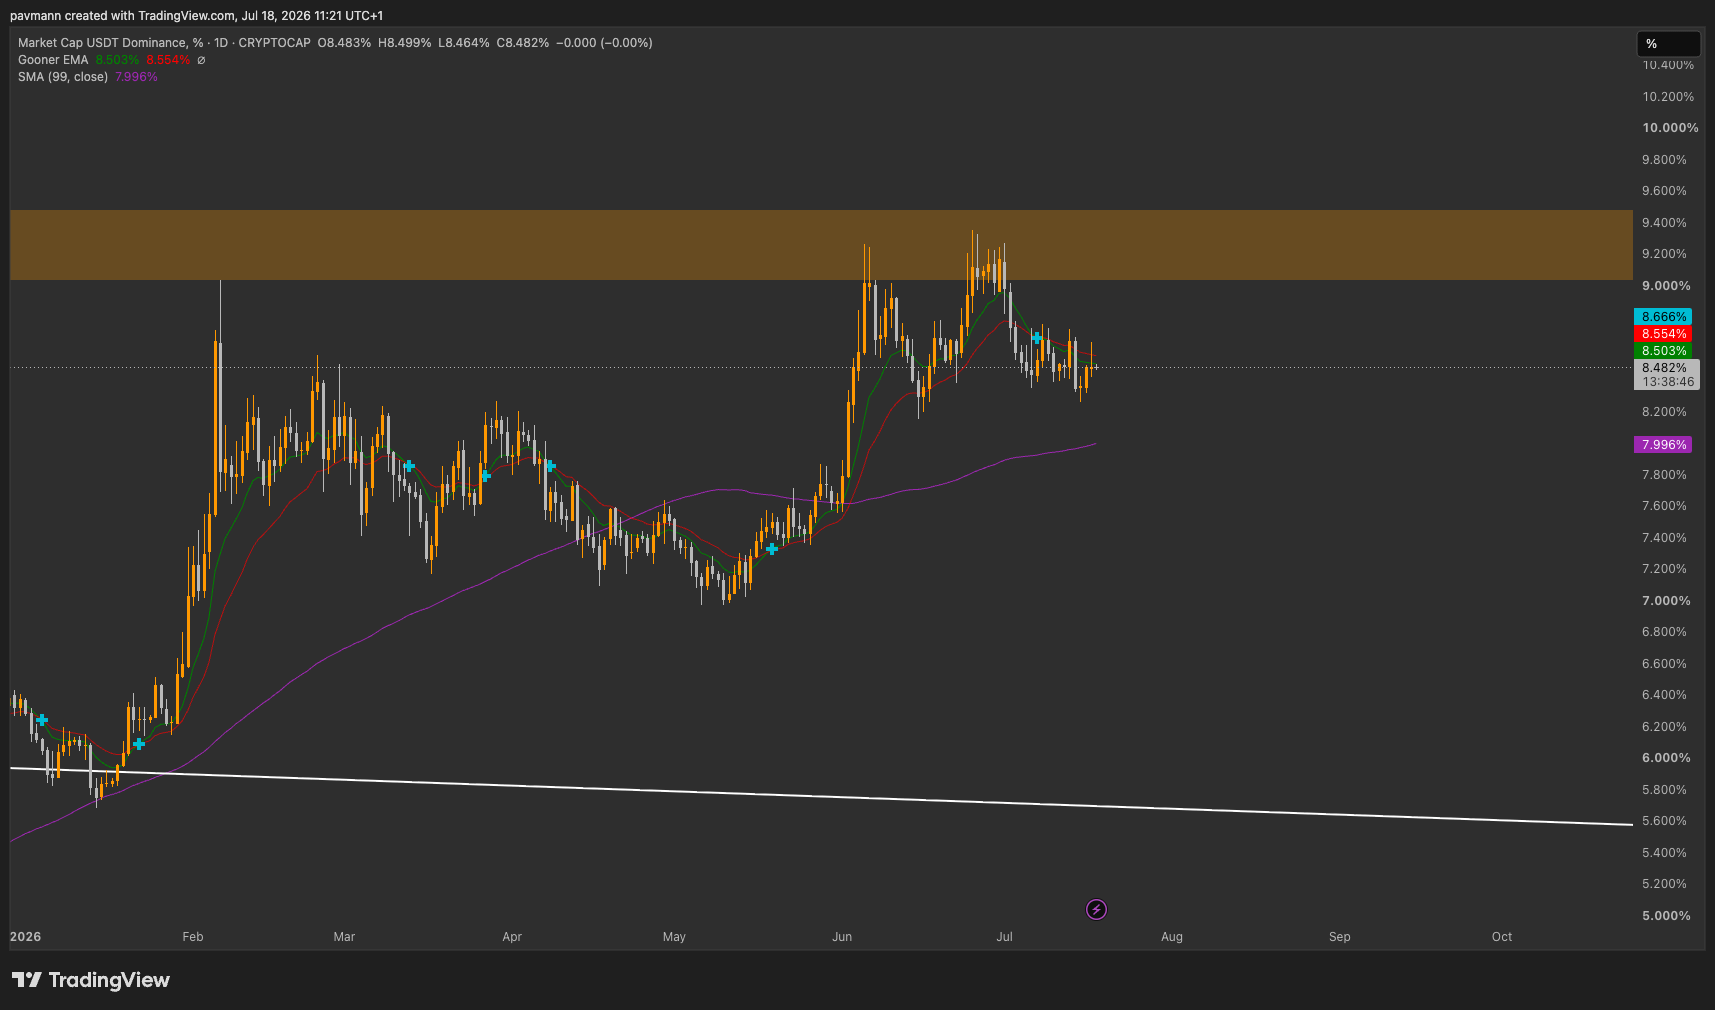
Looking at the daily, I still think USDT.D falls down to the 99 SMA, which currently sits around the 8 percent level. Once we reach that zone, I will go back to sitting on the fence in terms of which direction the market is heading next. To me that is the only sensible approach, because that level has historically acted as a huge point of support and resistance.
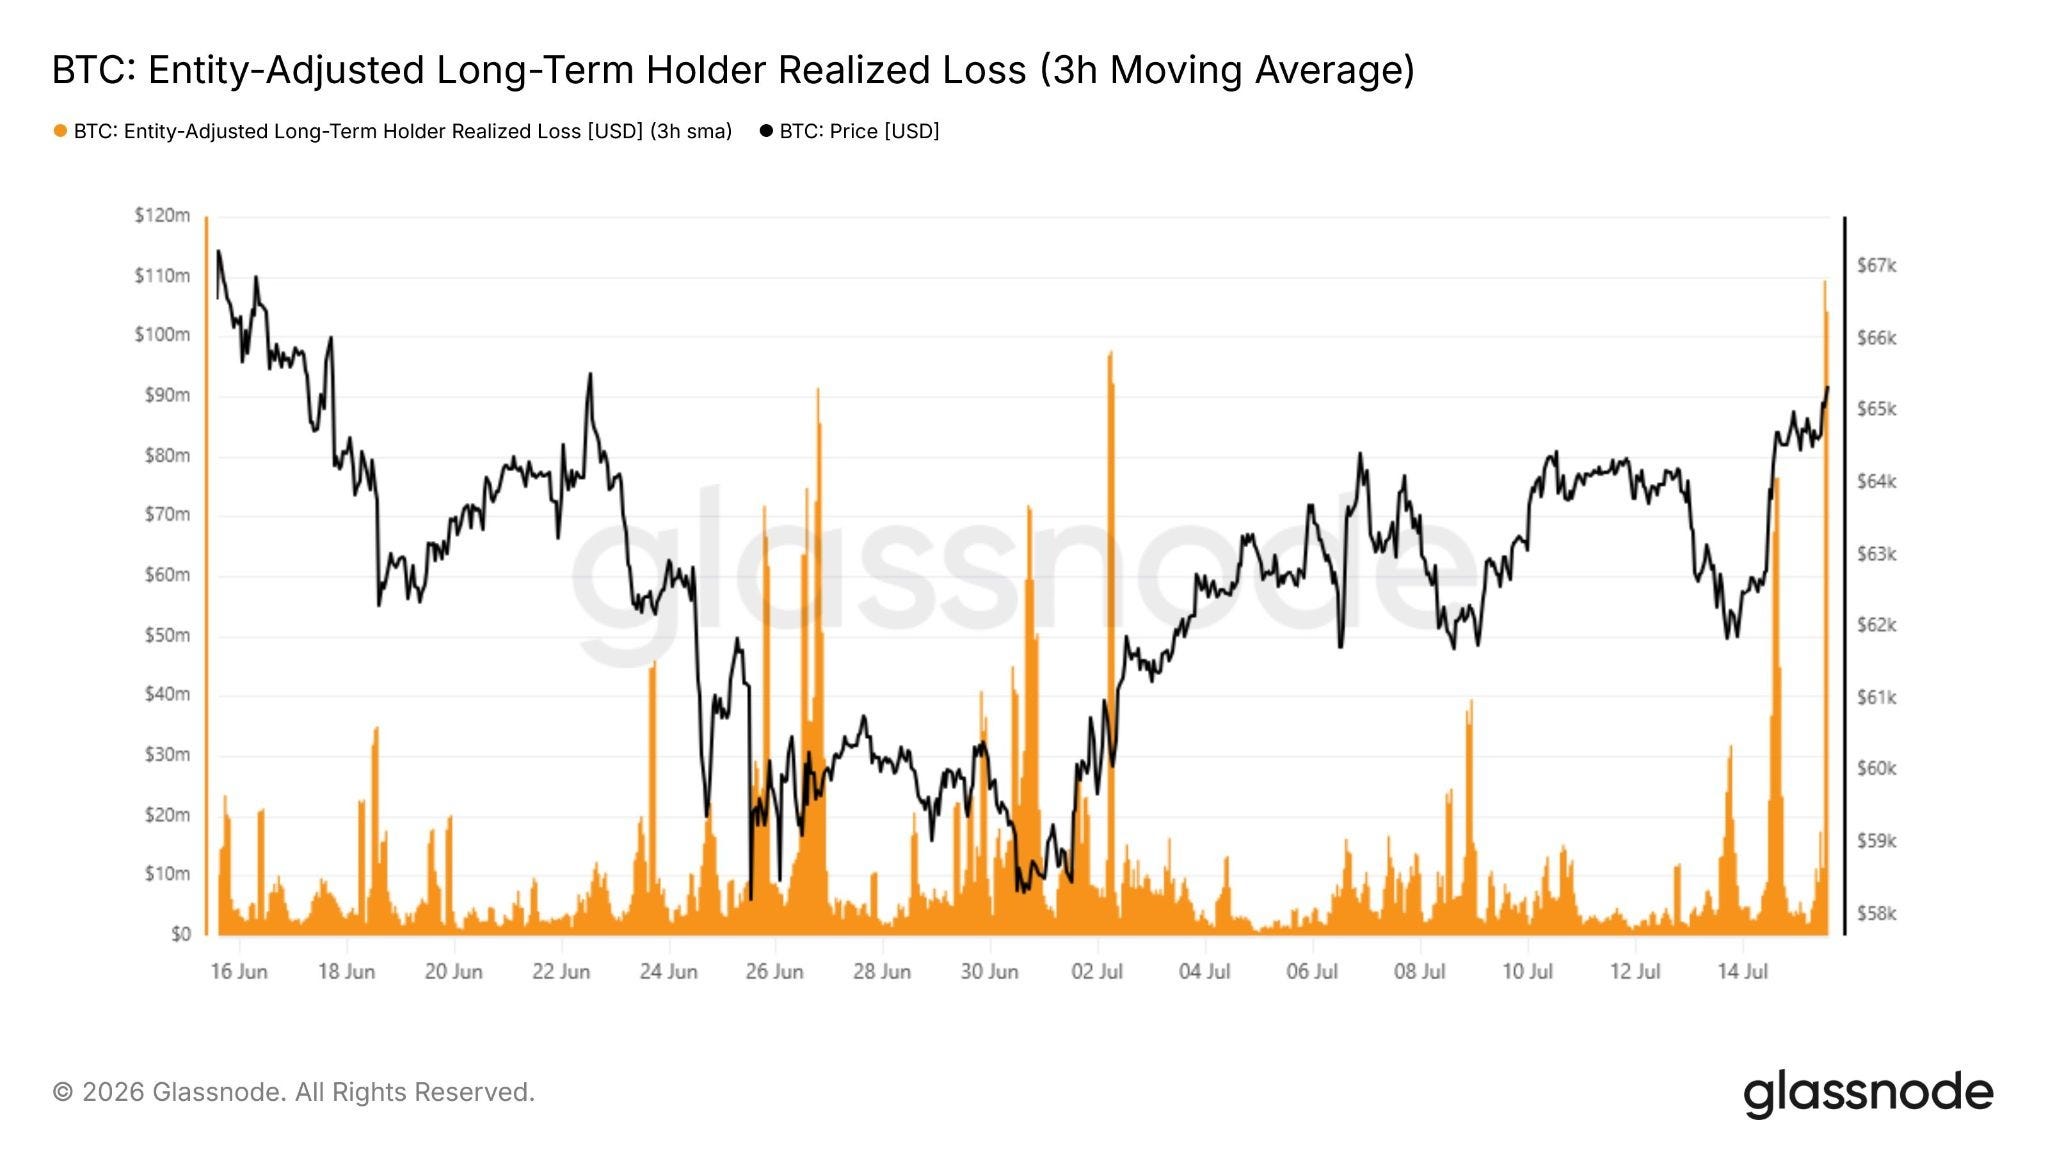
I have been dipping my toe back into some on-chain data this week, and I found a couple of charts worth sharing. The first is long term holder realized loss. We have seen a huge spike in this during the recent rally, which suggests LTHs are taking the chance to take the L on certain positions.
Is that something you should be worried about? Maybe. But we have seen this exact behaviour before and price continued to rally regardless. Still, it is interesting to watch how traders and investors react once price enters these areas.
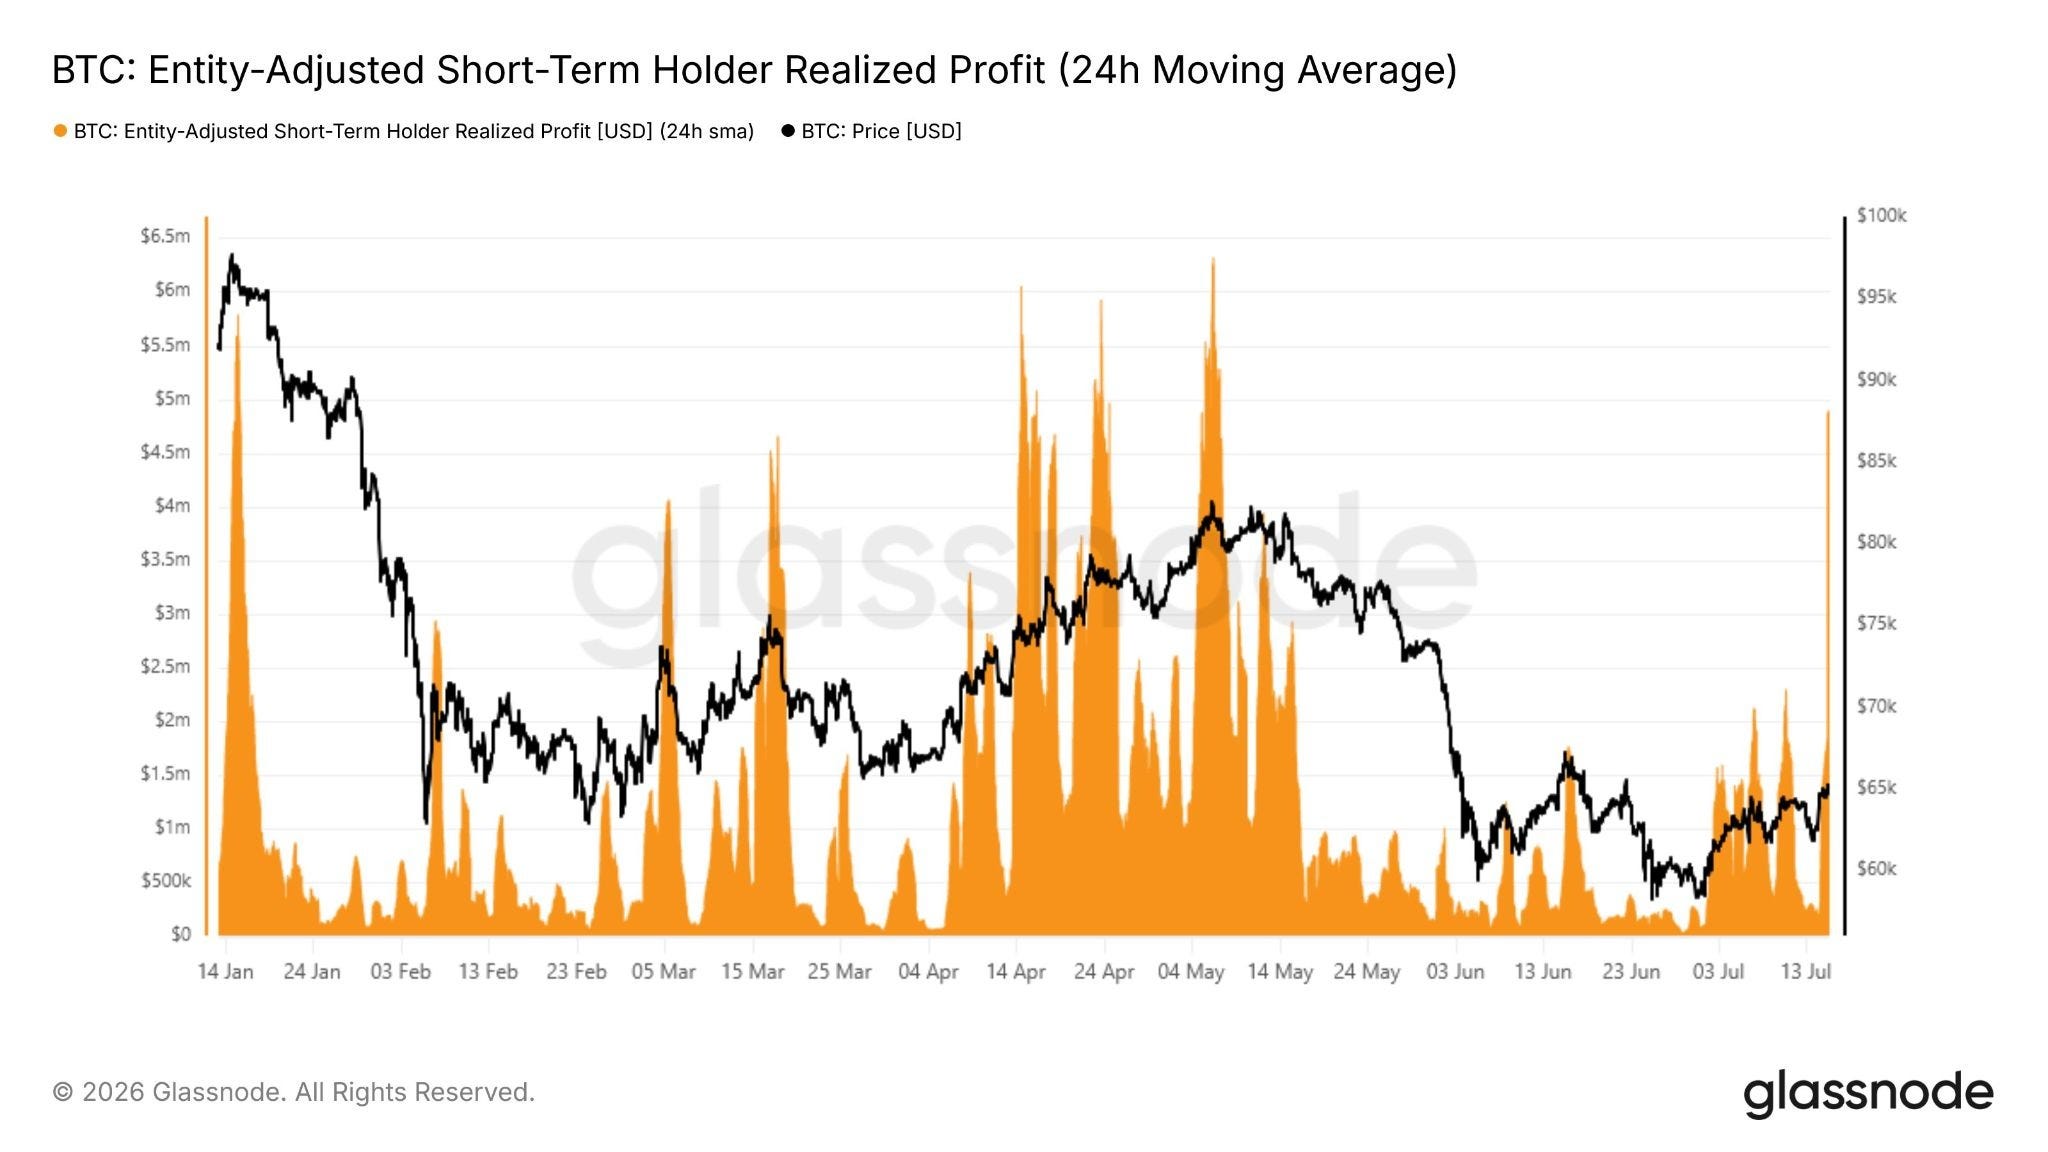
To couple this, it is also clear that short term holders who bought the recent bottom have taken profits over the past week. Together, these two charts explain why we saw such an aggressive rejection, obviously coupled with the Iran news on top. We have had a lot of selling pressure recently, and we have had bad news, yet we still have not seen a complete capitulation. To me, that is bullish.
I know that might sound like a stupid thing to say given everything going on, but right now I am sticking to what I said last week. If you have not read that yet, go back and check it out.
LINKS:
This newsletter is free because we love sharing our insights with the community. If you enjoy it and find value in our work, consider supporting Pav’s and Will’s Beer/Coffee Fund by donating $XRP to our newsletter donation wallet below. Cheers!
$XRP donation wallet: r3qf2nALyhFwC46QqZ5gJHpF3cjr5gRcoV
Trade XRP Memes here:
https://firstledger.net/?ref=6NRu4StwrImq
Trade on MEXC: https://www.mexc.com/register?inviteCode=mexc-1etb1
Trade on WEEX using this link: https://www.weex.com/login?from=https%3A%2F%2Fwww.weex.com%2FnewbieActivities%3Fid%3D520%26type%3DBEGINNER_TASK%26vipCode%3Duspf
Trading Different (Liquidity Map) - https://t.co/3ks3QMT5VJ?ssr=true
No posts
Comments
Nothing yet. Say the first thing.
Sign in to join the conversation.