
The content below represents the personal views and opinions of the authors. It should not be considered as investment or financial advice.
For the last few weeks, I’ve been discussing that I think we’re very close to, if not already at, macro lows for crypto. I also think there’s going to be a rotation trade at some point from AI into crypto. When that comes is a very difficult discussion.
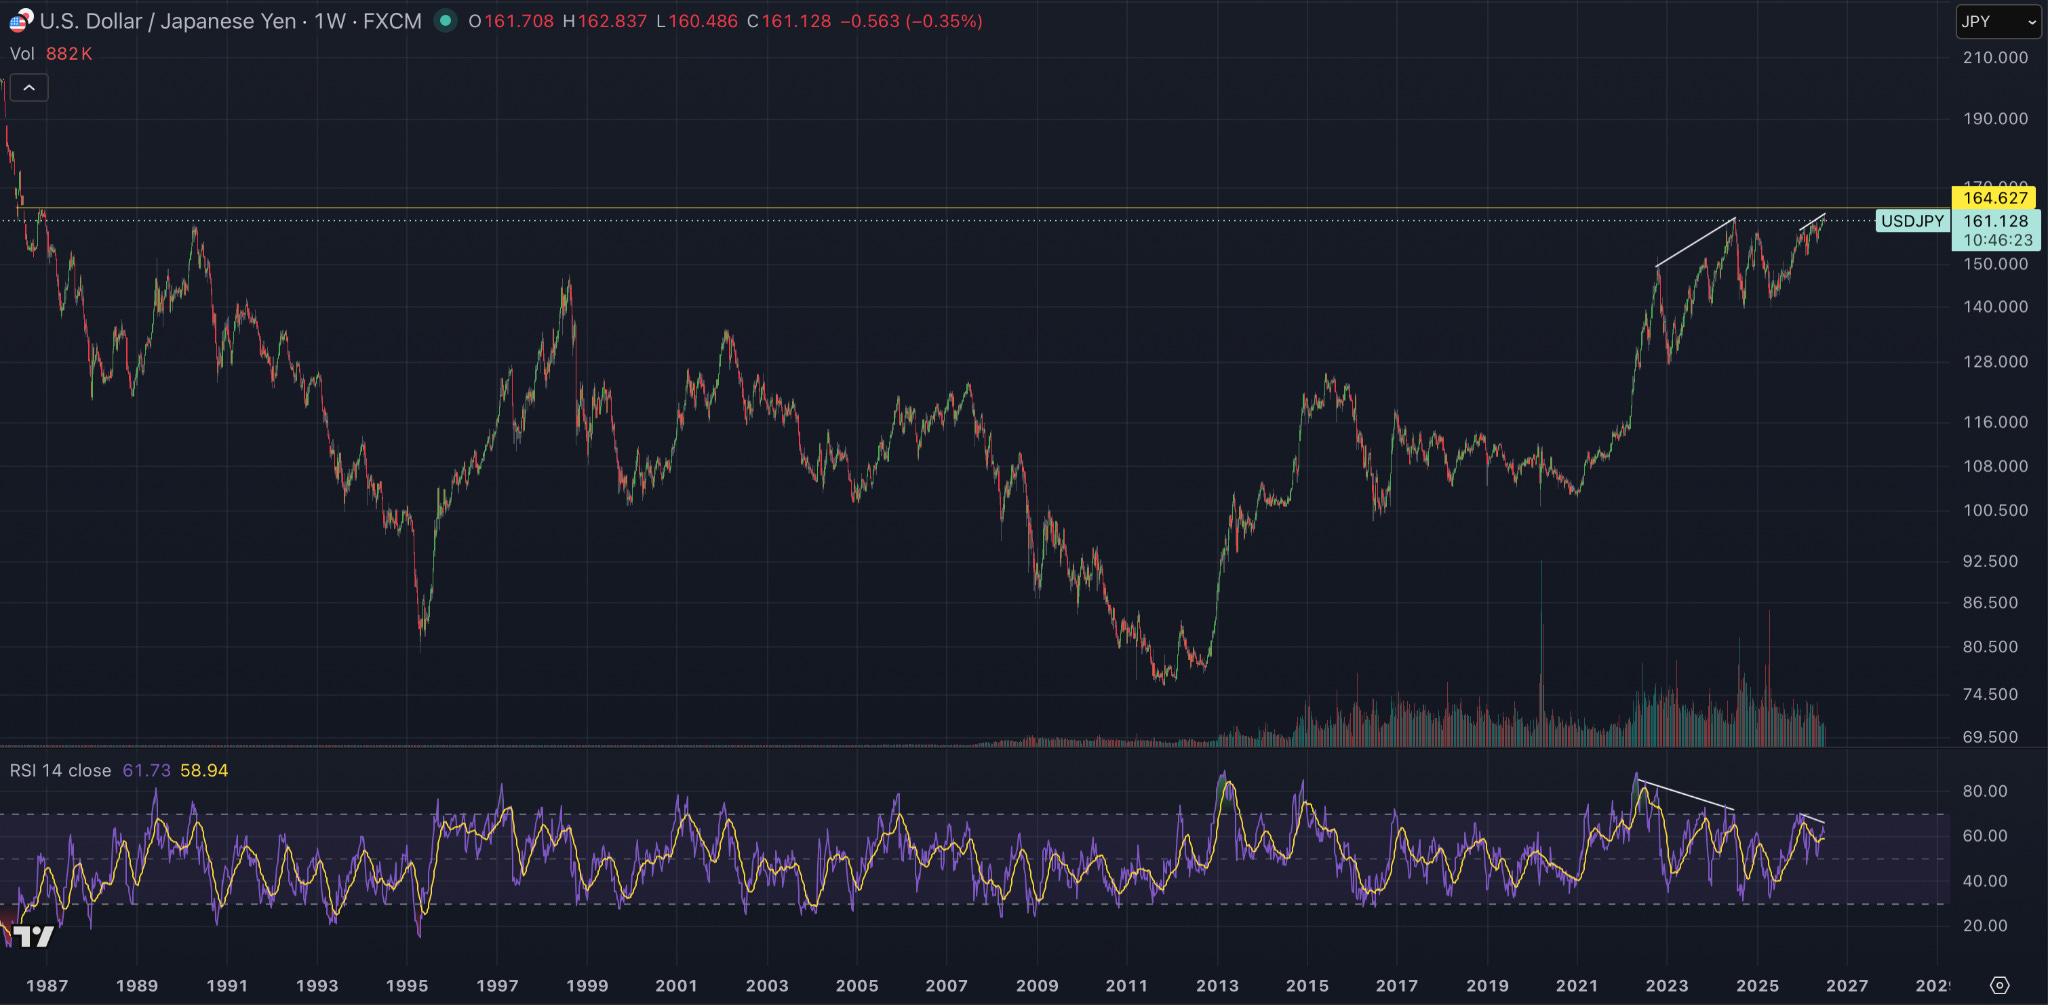
As I’ve been highlighting, I feel the USD/JPY chart is one of the most important charts in macro right now.
Why is this important to the previous statement?
Well, most of the world’s finance, one way or another, directly or indirectly, relies on Japan. Why is that? How is that the case? I’m going to summarise very quickly how that may or may not be true.
To start with, Japan is a net exporter. They mainly export finished goods. The other major exporters in the world are obviously Germany and China, both huge exporting powers. I’ll focus on China specifically here. If you look back at my newsletter from last week, we discussed the economic strain China is under and the weakness in the Chinese yuan.
What we can see on this USD/JPY chart is that the Japanese yen is the weakest it’s been against the US dollar for 40 years.
Is this trend going to continue or not?
Well, each time we’ve reached these levels historically, especially over the last few months, we’ve seen direct intervention from the Japanese government to stop the yen becoming too weak.
As I’ve said before, there are huge implications depending on whether that intervention happens or not.
One implication is that it would put even more pressure on China’s economy because, as the Japanese currency weakens, people become more inclined to buy Japanese exports as they get more for their money. So it’s a direct issue for China.
It’s also a direct issue for the US because Donald Trump has repeatedly said he wants America to become more of an exporter, or at least bring manufacturing back onshore. One of the things he’s also said is that he wants the dollar to weaken. We can see that reflected in the DXY chart, which is also sitting towards the top of its yearly range. I’ve been discussing that I don’t think this is something Trump wants for exactly those reasons.
So, one way or another, I think we’ll probably see coordinated FX intervention into the Japanese currency.
And I haven’t even touched on the fact that, because this trend has been running for so long, with the weakening yen against the dollar and the Japanese carry trade, a lot of people have effectively been borrowing yen to make investments, paying almost no interest on those loans, while also benefiting from the depreciation of the yen itself.
This chart is so important for the world.
What I don’t understand, and what I don’t know, is if it does start to break out, what are the direct implications for the global financial system? What are the implications for the world more generally?
I think it would begin to unravel parts of the financial system, but I can’t predict exactly where those stresses would show up, as I’ve already explained.
What we do know is that it directly affects two of the biggest economies in the world, the US and China. Because of that, I think something will happen at these levels. I don’t think this is a price level that’s simply going to be ignored.
Before Trump went to meet Xi Jinping back in May, Scott Bessent visited the Japanese Prime Minister. They must have discussed this issue.
The technical level itself is important, but it’s really the repercussions of a breakout that may or may not affect all of us.
One thing that could happen is pre-emptive intervention, because policymakers may feel exactly the same way. They may not know where the repercussions of a breakout in USD/JPY would ultimately show up across the financial system.
You could argue that it affects bond markets, as Japan may have to sell US Treasuries to raise dollars, then sell those dollars to buy yen in an attempt to stop the currency becoming too weak and triggering a broader financial issue.
There are a whole host of possibilities.
But one thing I do think this chart tells us is that, in a world where the legacy financial system is so heavily leveraged, there is likely going to have to be some sort of coordinated effort to rebalance currencies or inject liquidity one way or another.
And this is another point I’ve been trying to make over the last few weeks.
I think that process ultimately allows asset prices, specifically crypto, to rally.
If we couple that with what we’ve been discussing around oil over the last few weeks, then I think we can continue to build that discussion.
If we assume that, one way or another, we’re going to need to add liquidity or intervene internationally in the FX markets, this should have a positive spillover effect for assets. The liquidity they inject or intervene with will probably have to be greater than the amount actually needed to solve the issue.
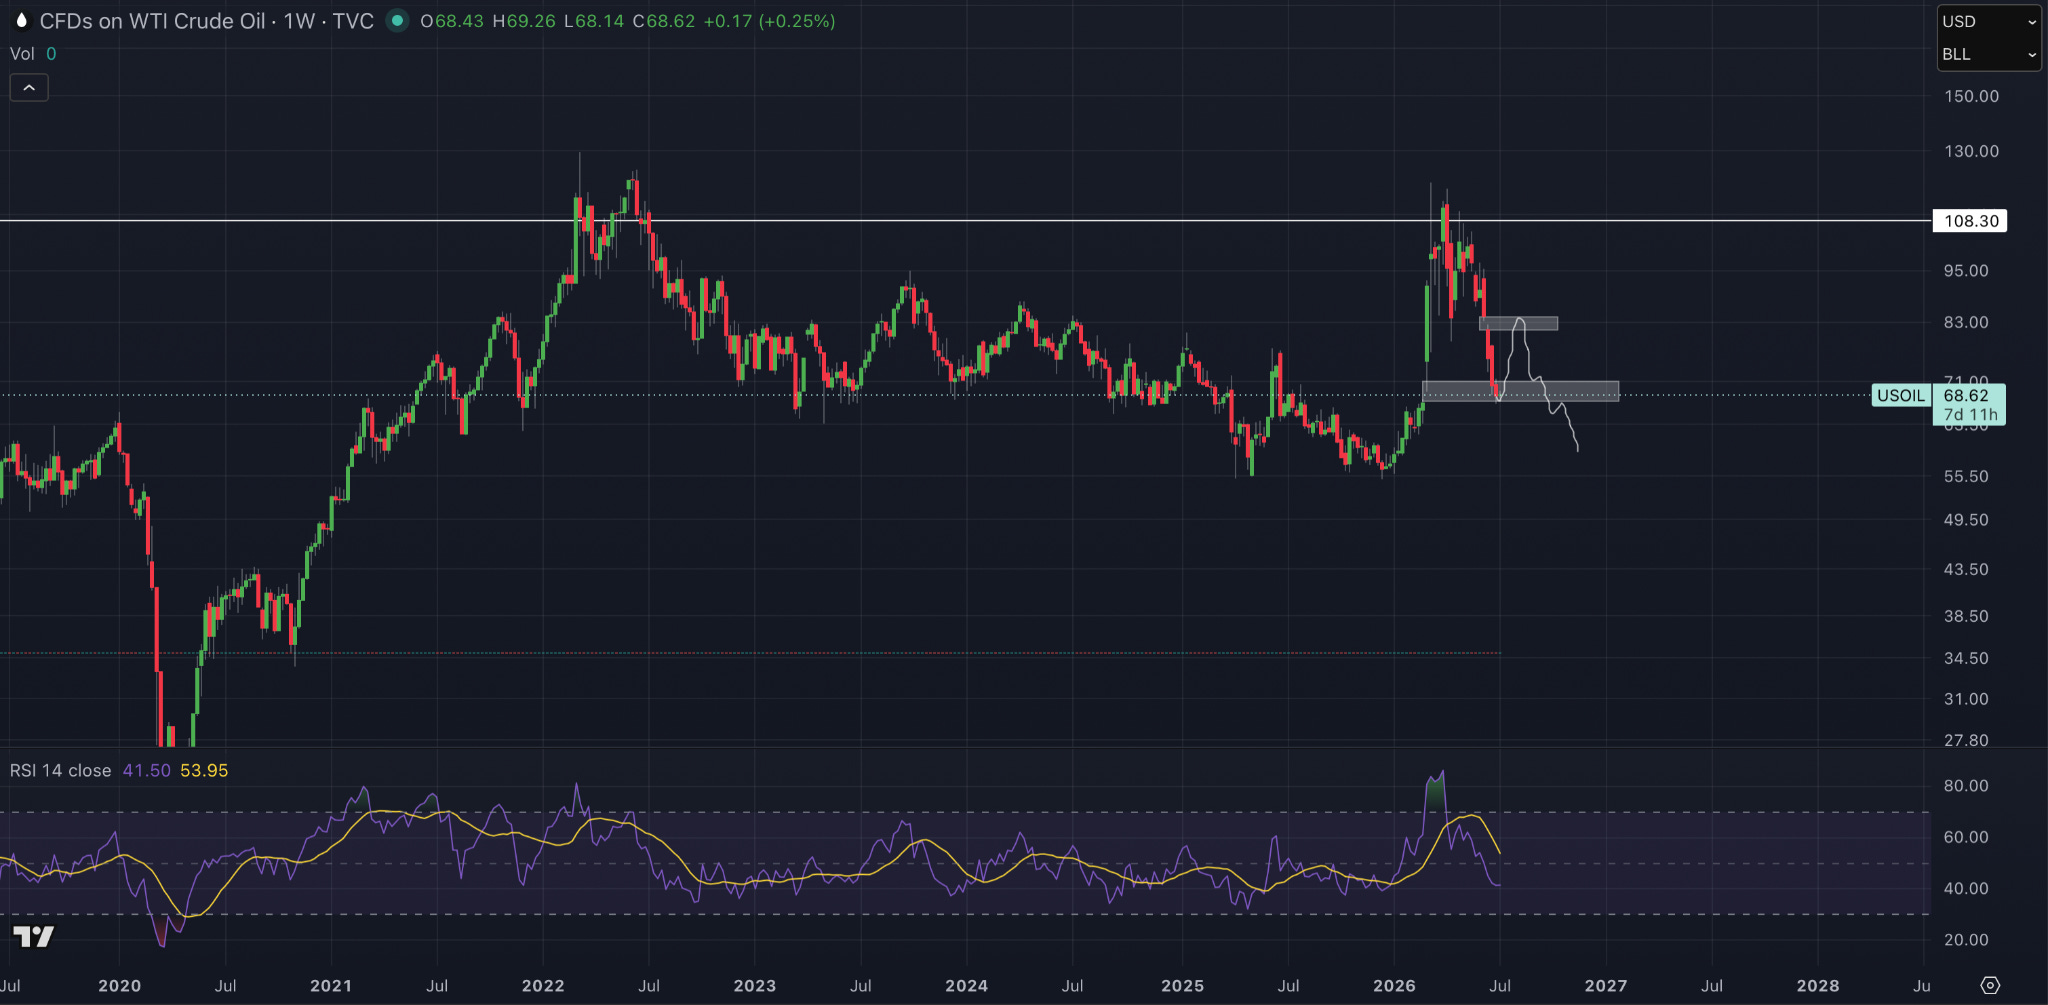
The reason for that is because liquidity doesn’t always find its way to the right places. It doesn’t all go where it’s needed, so policymakers often have to overstimulate or overprovide liquidity to make sure the areas that definitely need it actually receive it.
Domestically within the US, I think oil also provides the opportunity for the US to inject liquidity if needed.
A lot of people have been discussing how the Fed is hawkish and are pricing in, at most, one rate cut before 2027.
I’ve argued the opposite.
I’ve said that Kevin Warsh’s comments about removing forward guidance are actually pretty neutral, if not bullish. I think they give him the opportunity to completely 180 on policy if needed.
Recently, over the last week or so, we’ve also had weaker-than-expected job reports in the US.
I think Trump wants a hot economy.
As I’ve said, he’s trying to onshore industry and really pump up the US economy. He’s extremely in tune with the stock market, puts a lot of weight on it as a measure of his presidency, and I think he wants that to continue running hot.
I also think he wants crypto to do well.
He talks about crypto a lot, and it’s one of the few areas that hasn’t really performed during his presidency so far.
Because of that, I think we’re setting up for Warsh to either move towards some form of quantitative easing or, at the very least, policies that stimulate growth, which I think is exactly what the US needs.
In fact, I think it’s what the world needs.
I think we’re heading towards deflation becoming a contagion problem around the world, and I think policymakers should be pre-emptive in dealing with that.
I also think they’re taking the gamble they need to take because, realistically, they don’t have many other options.
A similar, although slightly different, discussion applies in Europe.
The ECB actually raised rates last month.
Listening to Andreas Steno Larsen on Real Vision this week, he explained that he believes they’ve made a policy mistake. He said they’ve effectively acknowledged that this week, although they haven’t yet reversed course. It’s only been a verbal acknowledgement so far.
Essentially, he thinks Europe is also heading towards an inflation or deflation problem, or simply a lack of growth, and that rates were raised too early. As a result, they may eventually have to reverse course and begin cutting rates again.
Again, that would be positive for crypto assets.
But more importantly, it reinforces the broader point I’m trying to make.
I think we’re heading towards some sort of intervention or positive liquidity injection globally.
I think oil is telling you that.
I think the USD/JPY chart is telling you that.
I think China’s lack of growth is telling you that.
I think AI is also telling you that.
So I think something is coming.
I just don’t know exactly when or how it arrives, or whether we first have some sort of structural breakdown or financial accident somewhere. That does often happen.
But because the financial system is now so heavily leveraged, I also think that if something does break, the contagion could spread very quickly.
I don’t know whether policymakers are prepared to gamble with that.
What I do think, though, is that liquidity is coming.
We discussed last week that I think gold may have already started to sniff this out by making lower lows below our March 23rd wick while putting in higher lows on the RSI, creating a bullish divergence and potentially reclaiming that range now.
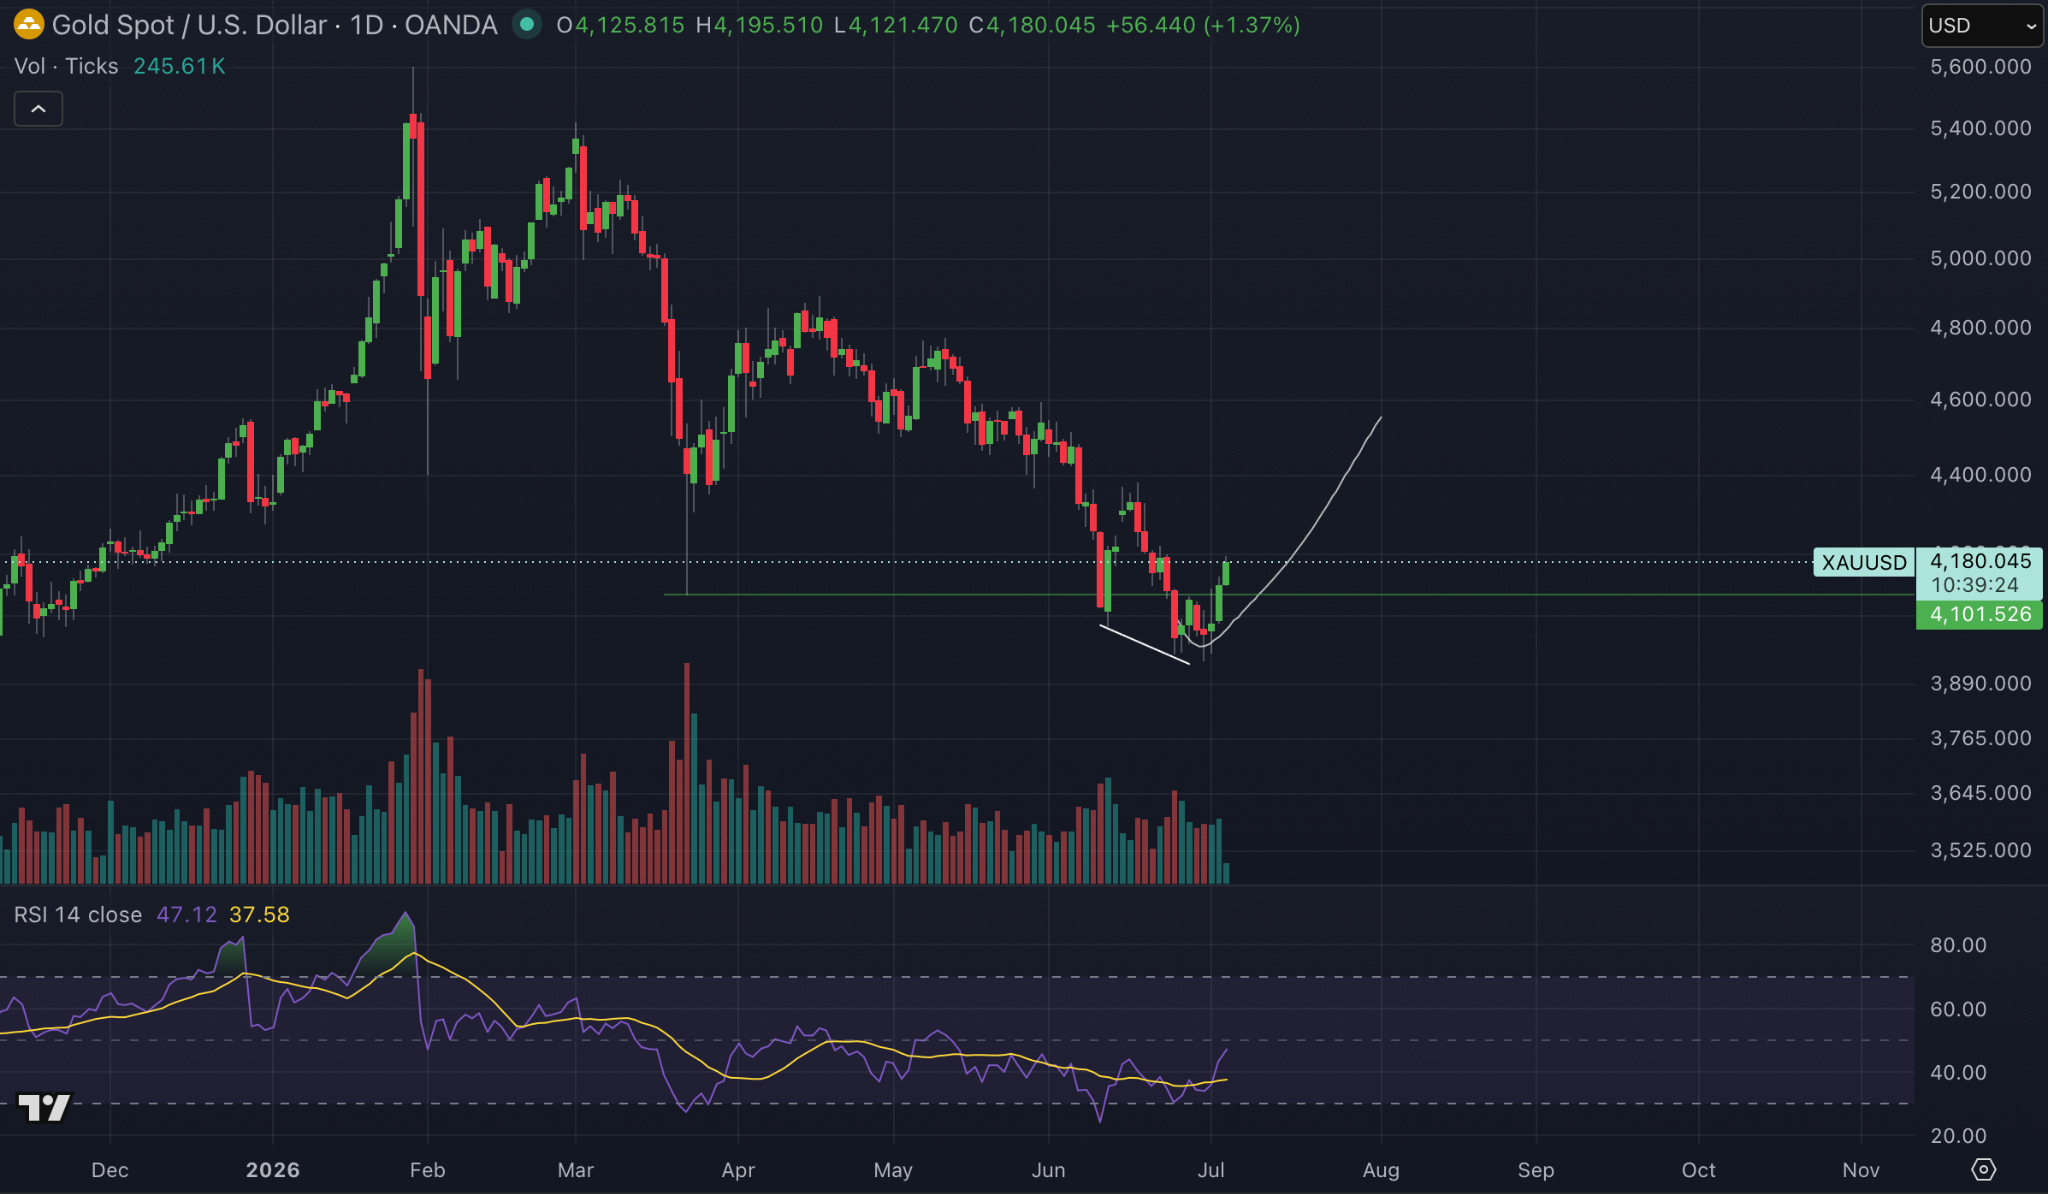
Gold was pretty early in sniffing out issues over the last year or so, so I think it’s a good indicator to watch here.
To me, gold is indicating that we’re very close to, if not already at, the lows.
Does this mean that we’ve definitely bottomed for crypto?
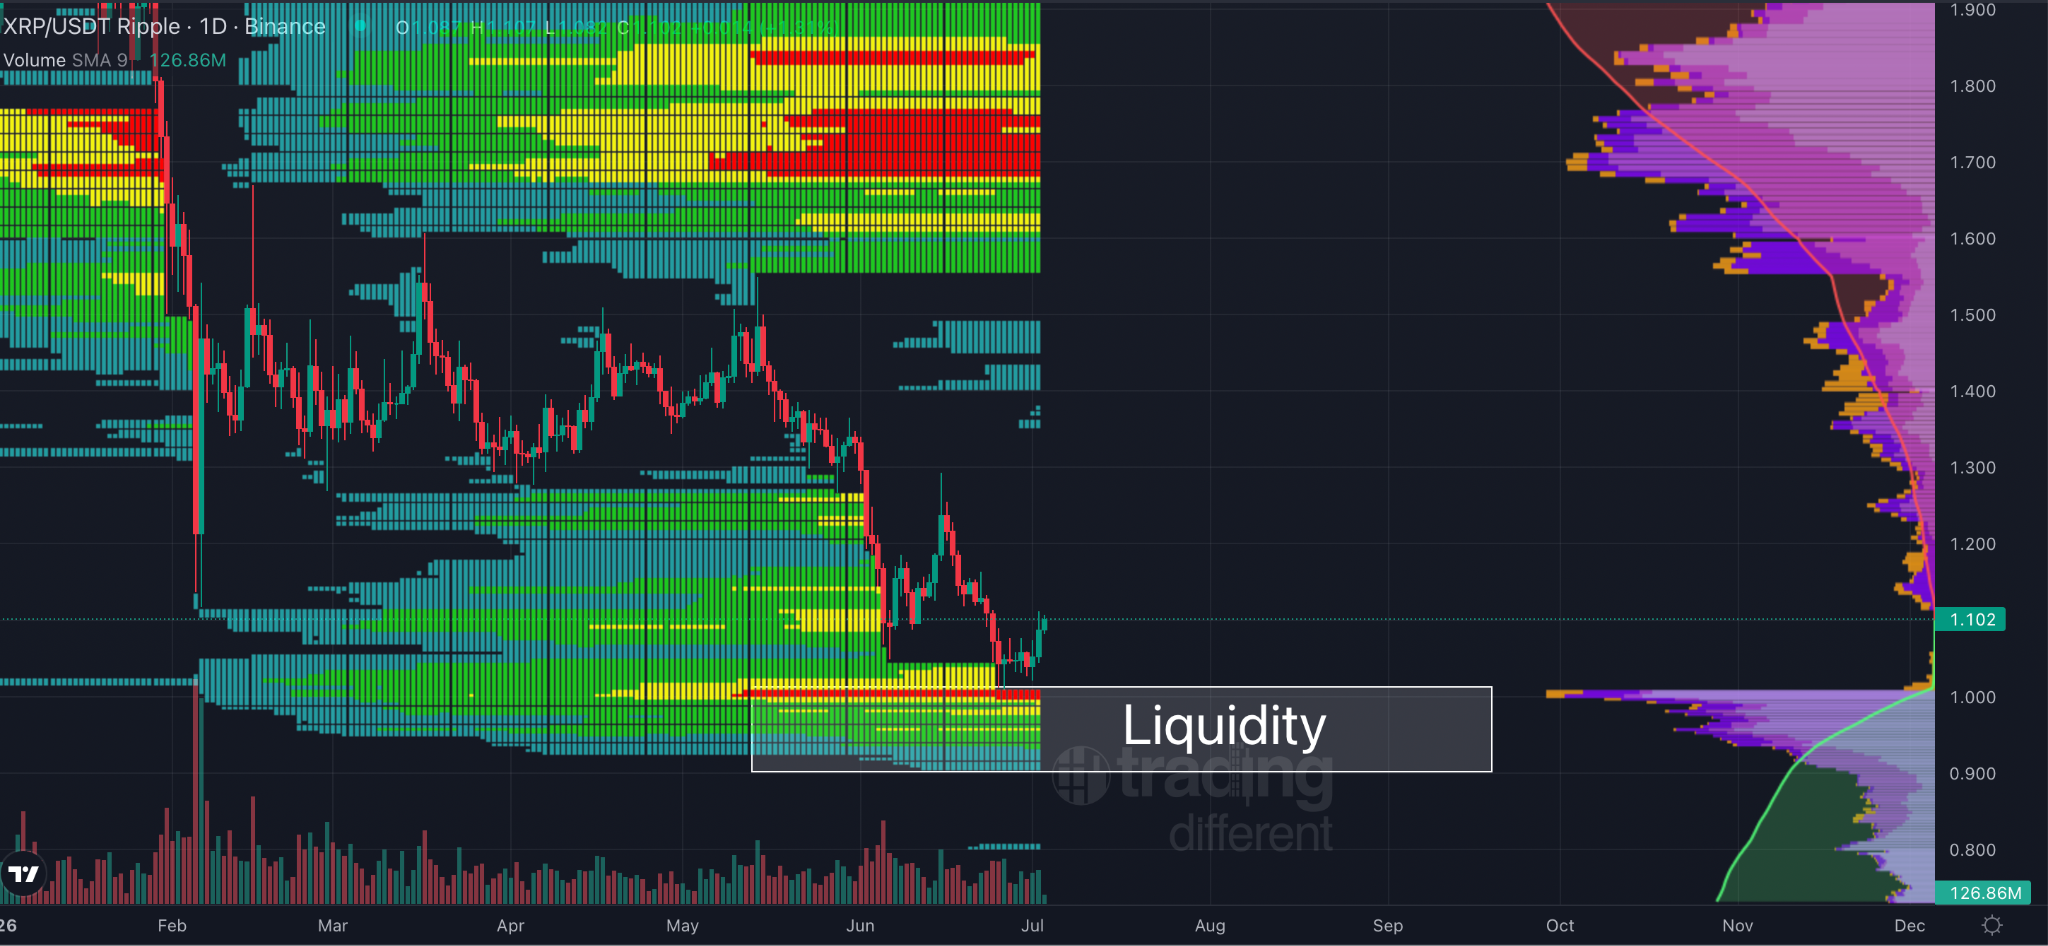
Personally, I don’t think so.
I think there’s one more flush to come. I think this area specifically is where I’d be bidding XRP, and I am bidding XRP below 95 cents.
As I said, there is the potential for some sort of liquidity event where something breaks first, then the reaction is intervention, and the solution is more liquidity.
So you have to remember that we could still see some aggressive downside price action if there is a break somewhere in the system.
Now, it’s pretty difficult to predict something like that. It’s essentially a black swan event, but I’m saying it’s not an impossibility at this point.
With that being said, do I think crypto is in a great value zone?
Yes, absolutely.
And I’m going to get into that a bit more in a second because I think you’re starting to see bullish divergences pop up everywhere across crypto, on the weekly, the daily, and the three day timeframes for a lot of the major tokens.
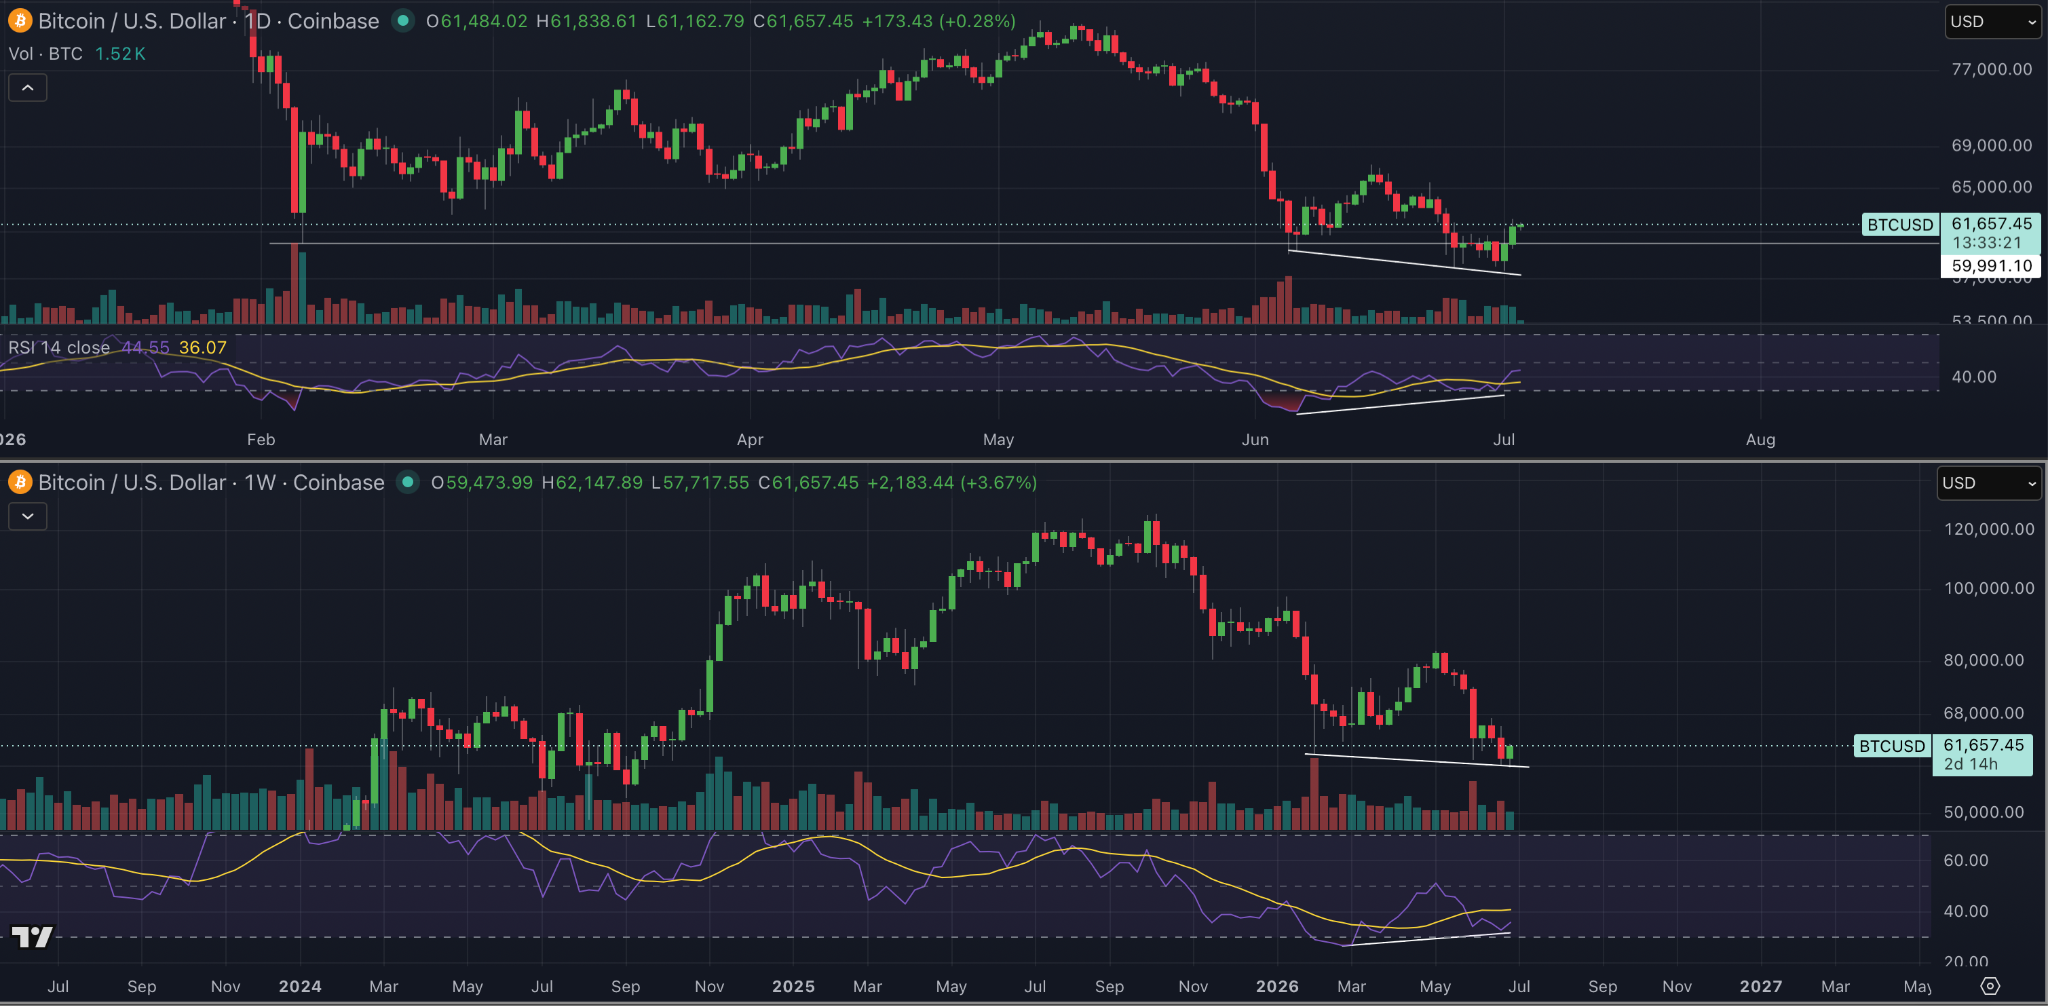
Some of those major tokens have already started to structurally reclaim previous support levels, or previous breakdown levels, similarly to the way that gold has.
Look across at Solana. Look across at Ethereum. They’re both making what I would consider bottoming ranges.
I’m not going to touch on them any more in this newsletter because I want to make this point clear.
I think these bullish divergences are extremely important. Historically, they have marked bear market lows or significant lows in price action.
One thing I do think is probably going to be different this cycle, though, is the acceleration back to the upside once we’ve finished ranging in this area.
If we do get some sort of liquidity injection, that would only add to my view that crypto can recover very quickly, especially when US equities are sitting at all-time highs and continuing to push higher and higher.
Even just to re-correct back to what might be fair pricing for crypto right now, we’d be looking at a break above all-time highs.
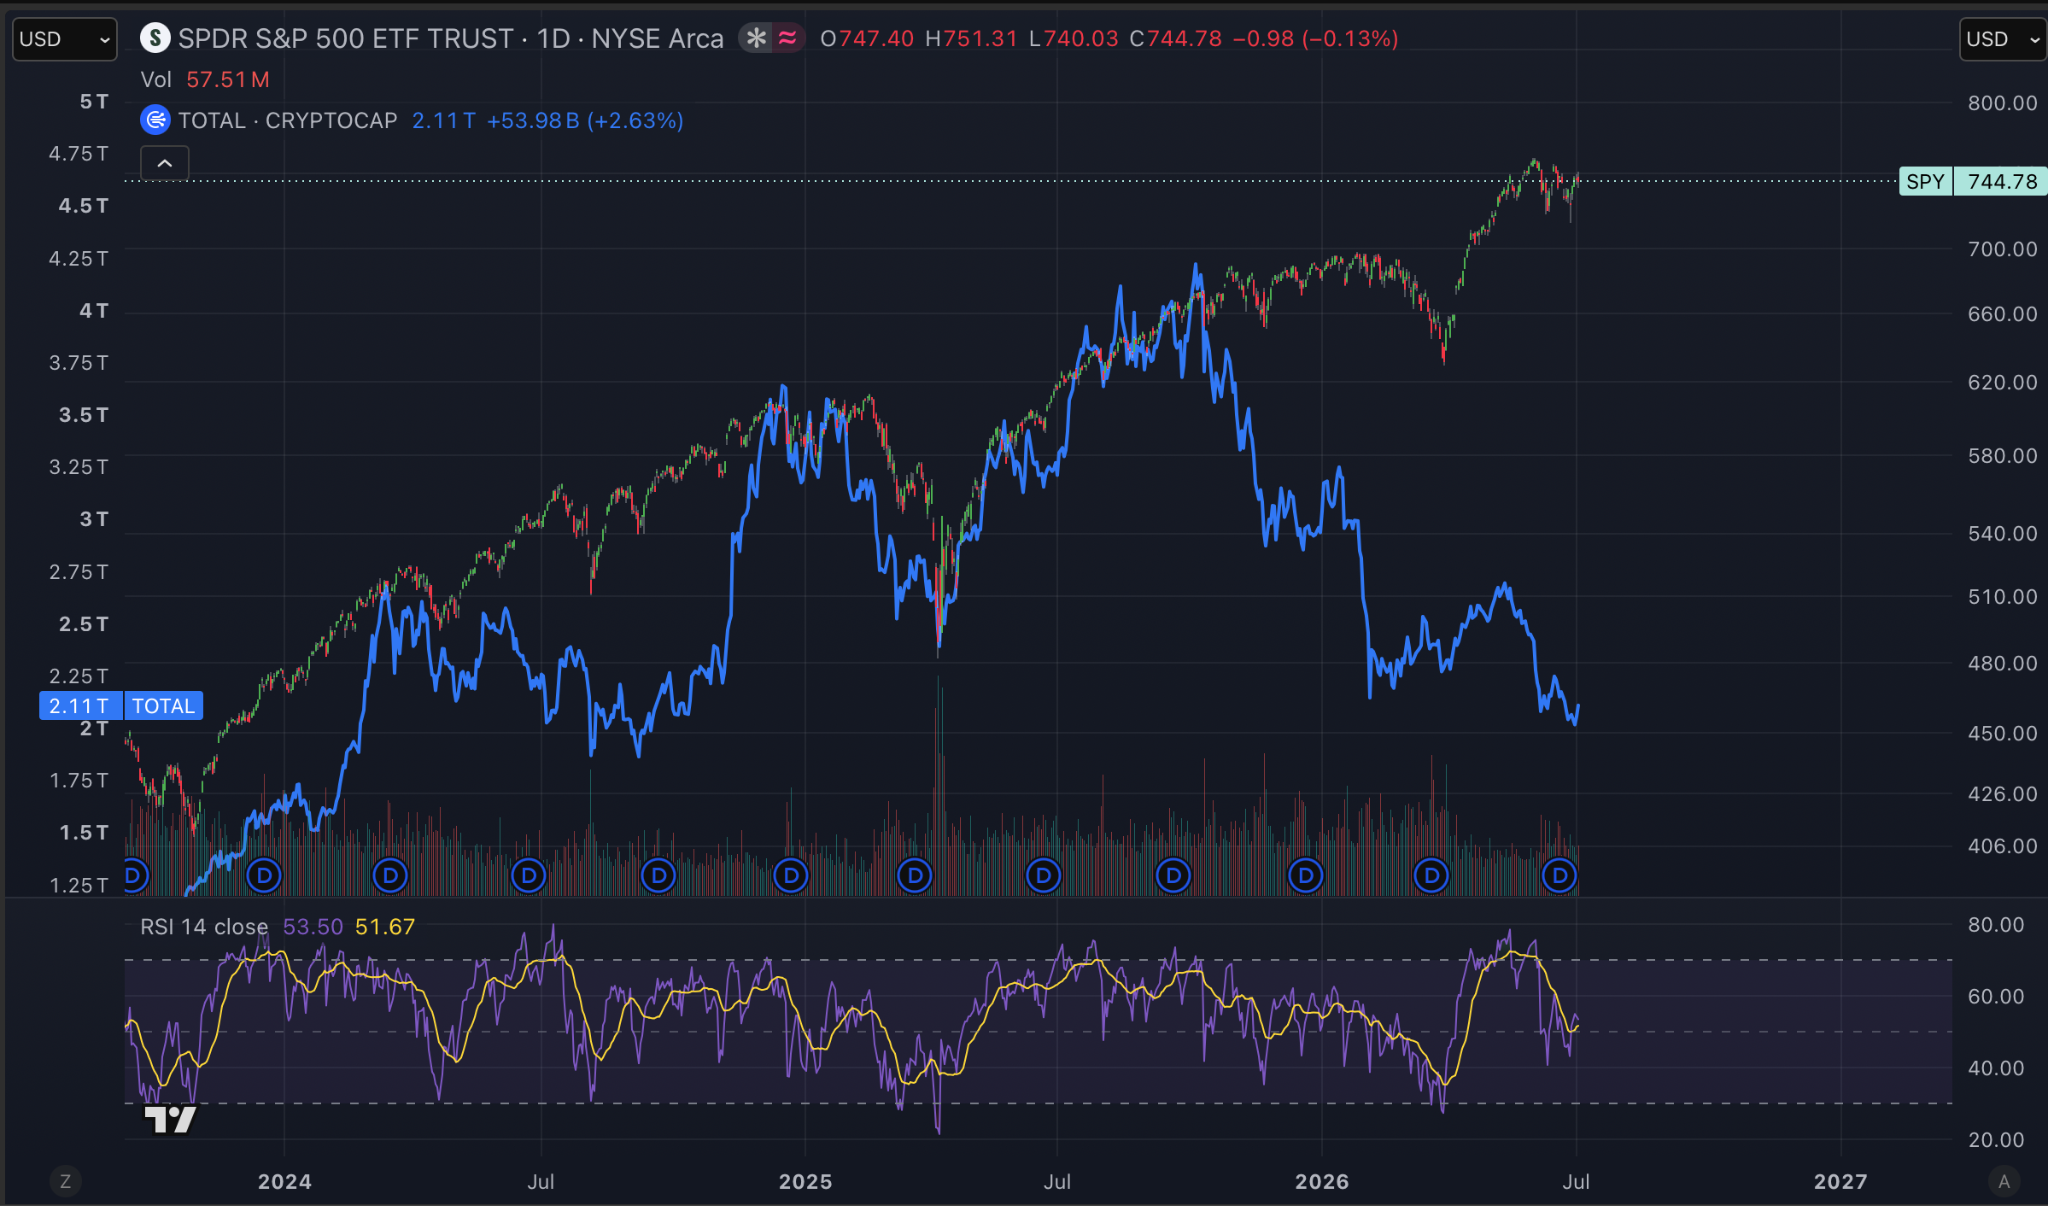
If you’re looking for crypto to re-correlate with the equity market, you’re talking about a gain of well over 100% from current levels.
It’s the first time in history that we’ve really seen this sort of decoupling, or lack of correlation.
You could argue that it happened during 2024, but then towards the end of the year, from November to December, we saw two or three months where crypto caught back up with equity markets while equities stayed at their highs.
This drawdown is obviously more significant, but I do think we’ve forgotten what volatility in crypto looks like.
I think that volatility will return, and I think we’ll probably resume the correlation at some point, or at least become much closer than we are now.
Unless the discussion is that we’ve completely decoupled, in which case there’s an argument for equities to start rolling over, and for some of that capital to begin finding its way into crypto.
But even that should bring the correlation back to being positive for crypto.
I don’t think this negative correlation continues indefinitely.
Gm guys. This week I’m going to take the opportunity to summarise my thoughts on the market as a whole and try to piece a few of these charts together, and I want to start with Bitcoin liquidity.
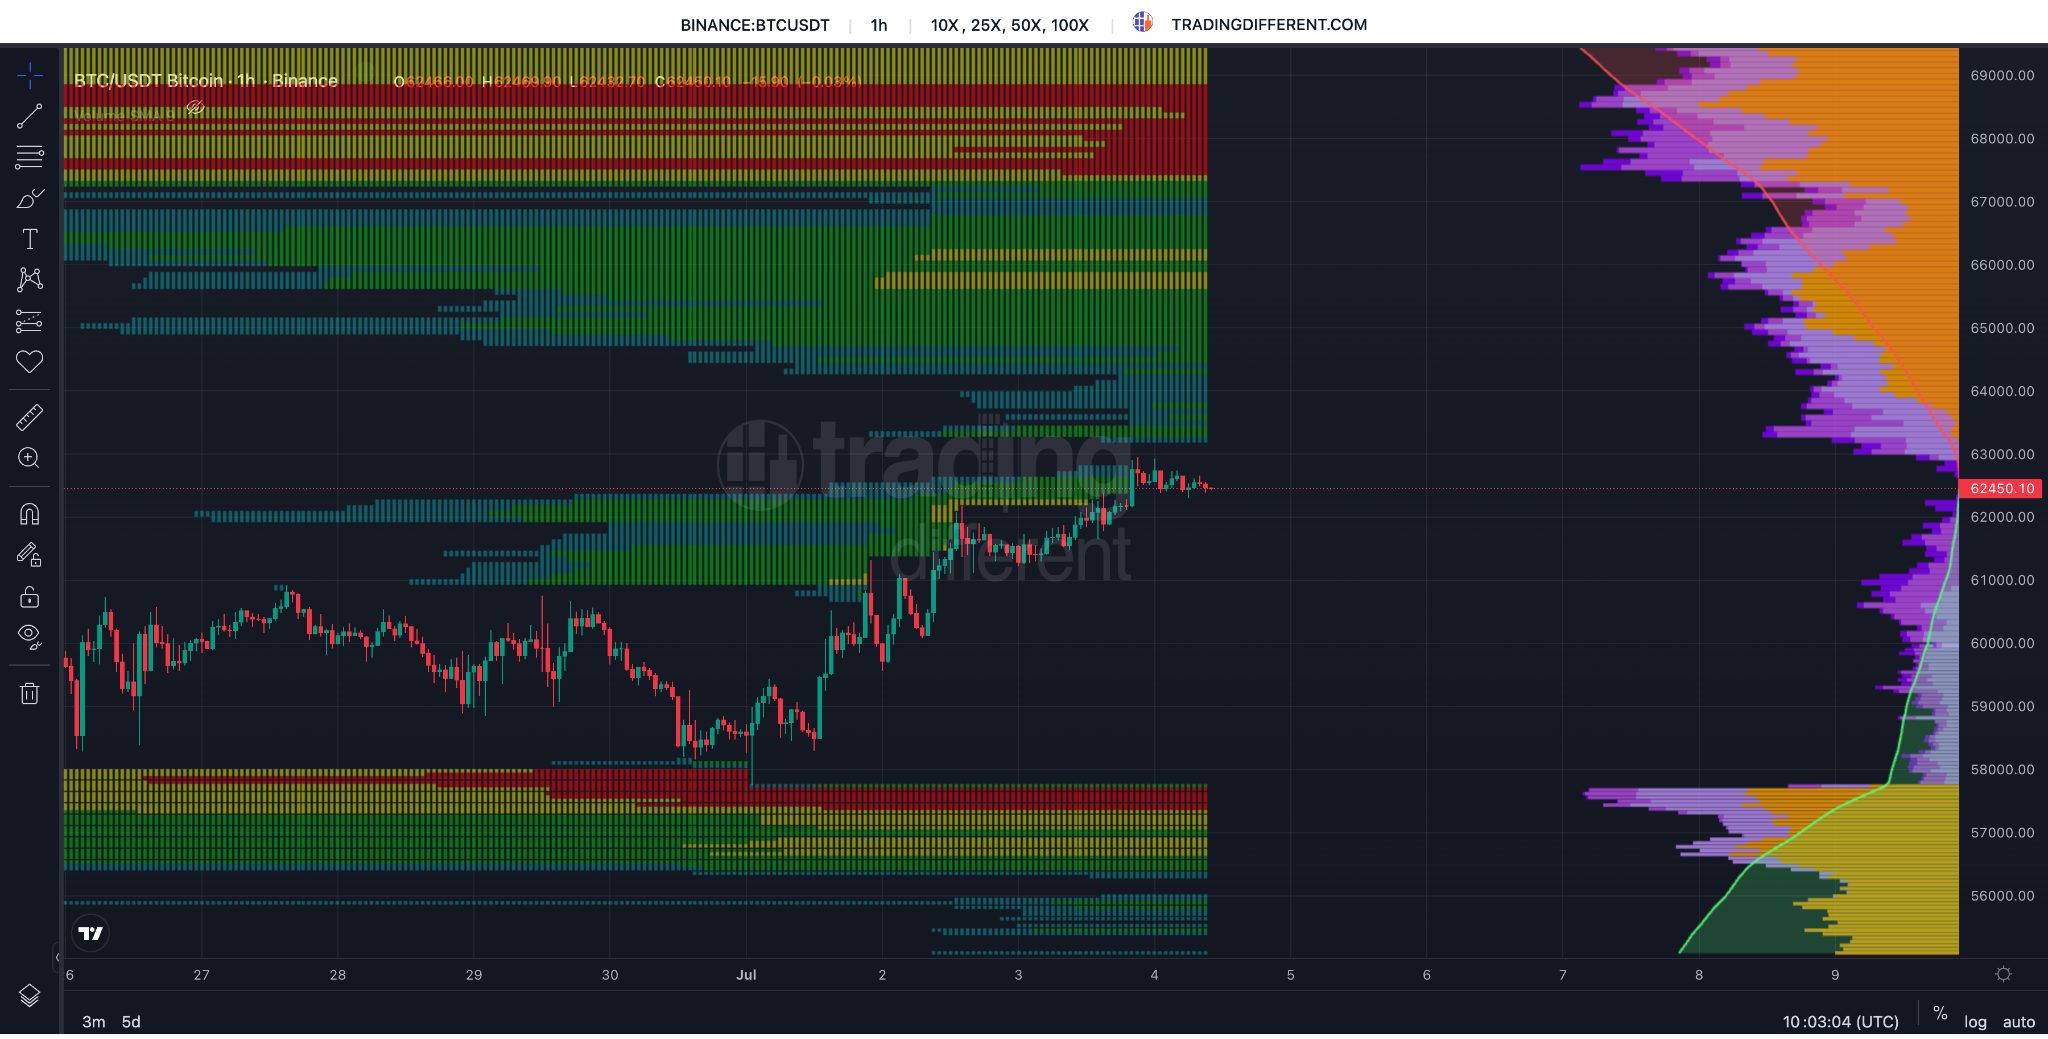
If you remember from last week, I pointed out on the hourly timeframe that there was a decent chunk of liquidity sitting around the 57,000 dollar region for Bitcoin. We did eat into a little bit of that a few days ago, but there’s still some left down there that hasn’t been taken yet. At the same time, as you can see from the chart, we’ve built up more liquidity over the course of this week within the 68,000 dollar range. So really, we’re just sitting in this middle zone right now for BTC, caught between the two.
For me personally, I’m looking for a bit more confluence before I lean bullish here. And the reason for that is simple. As the structure currently stands on the chart, we are still in a downtrend. So until we start to see some genuine signs of a reversal, which I’ll get into a bit later on, I’m still leaning towards the idea that we eat into that liquidity sitting below us first.
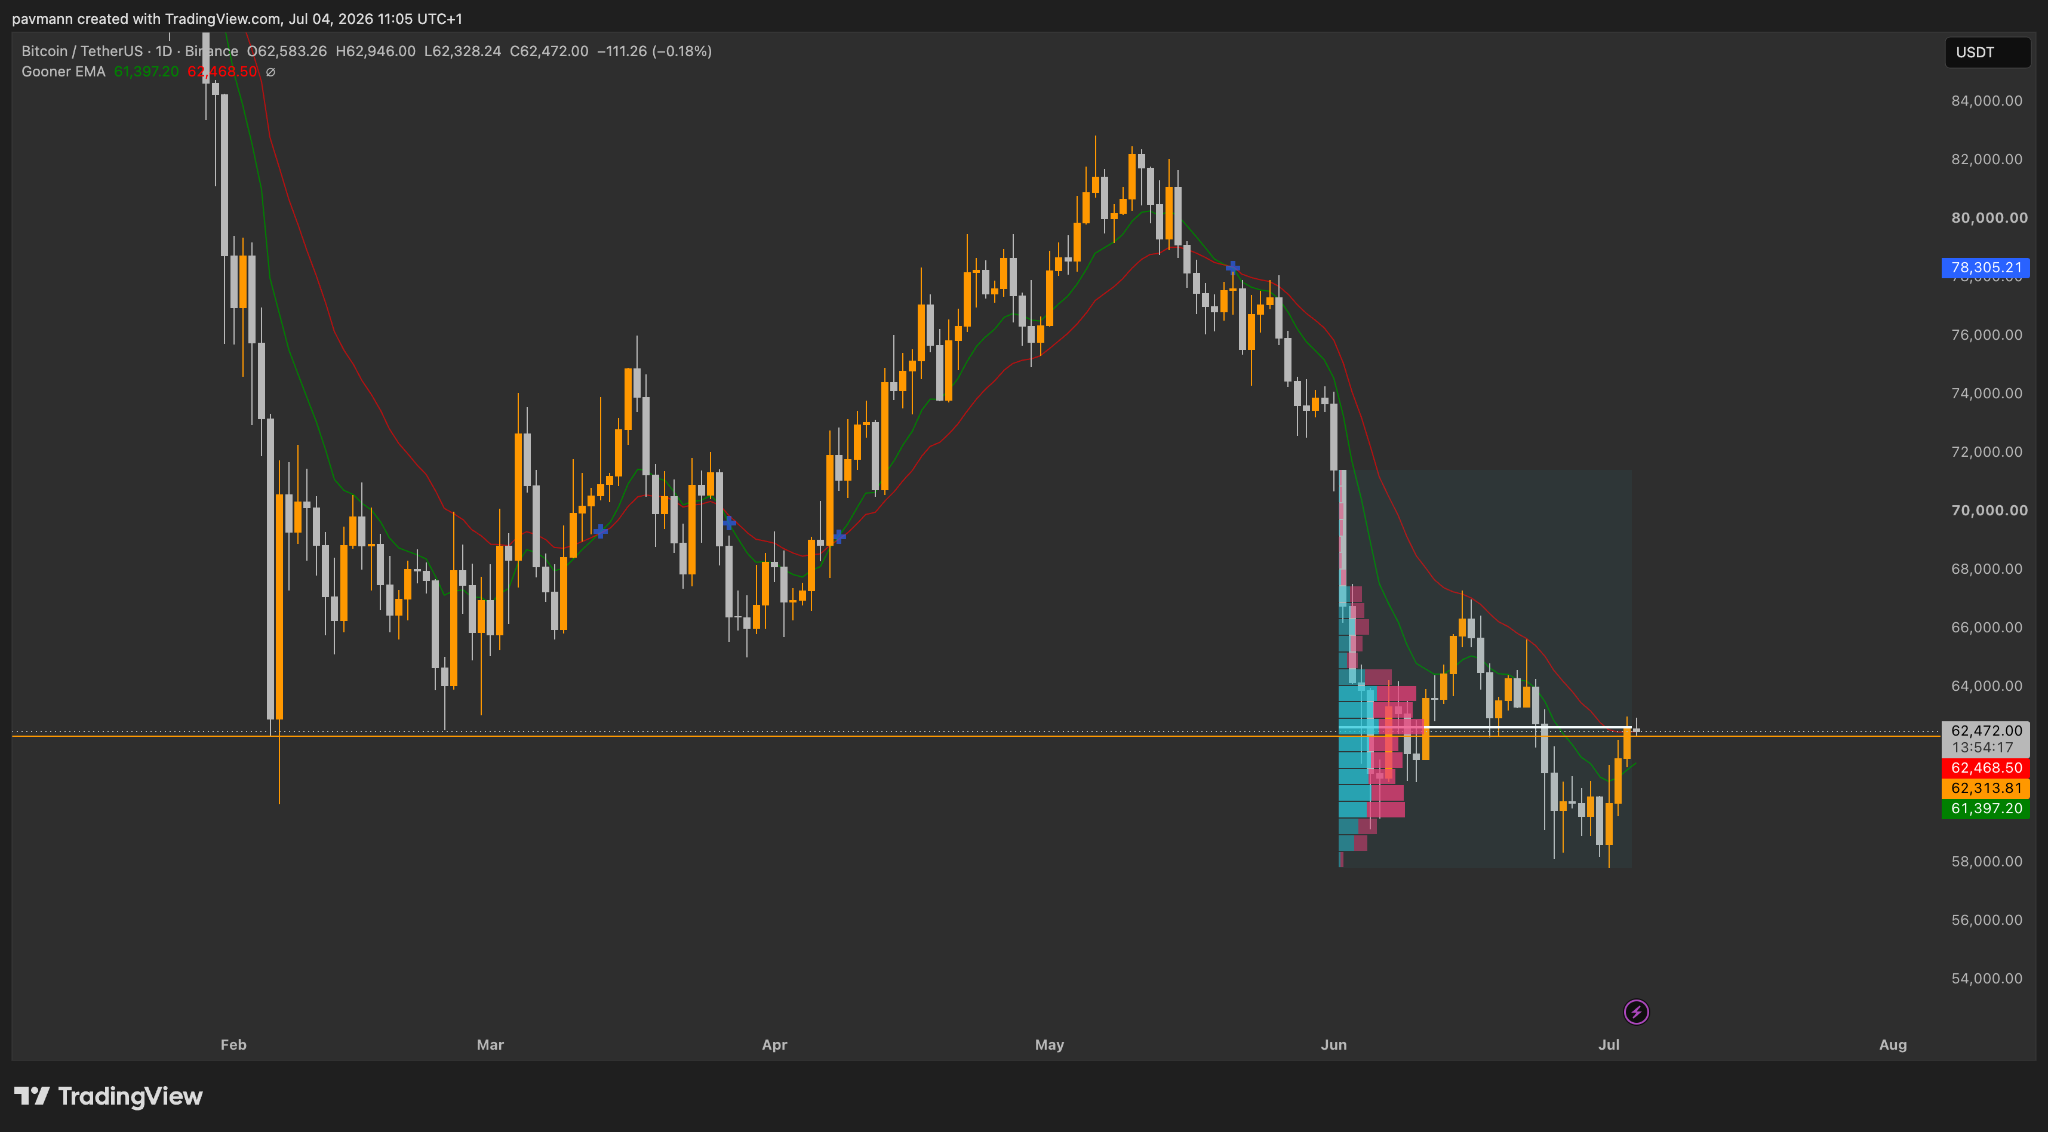
So when I look at the Bitcoin chart specifically, the reason I’m still waiting for a bit more confluence and confirmation before I flip completely bullish is because we’re wrapped in a zone right now where we could quite easily reverse off this bounce and head back down towards that liquidity below us. As you can see from the chart, we’re sitting right at a significant area of resistance and volume here.
Last week I spoke about the Gooner EMA, which looks at the 11 and 22 EMA. When we bring that up on the daily, what I’m really waiting to see is a bullish cross on this specific indicator, price staying above both EMAs, and ideally even coming back to retest them and use them as support. That’s the confirmation I want before I get more confident. This bounce has at least given us a bit of a shot at it, with the 11 EMA looking like it wants to cross bullish on the 22, but as it stands right now, it hasn’t happened yet. We’re still rejecting this area of high volume and resistance.
So for me, this is one of those situations where I’m happy to sit on my hands, watch, and see how it develops over the next week or two.
And it’s a very similar story when I look at the total market cap chart, the total market cap minus Ethereum, otherwise known as TOTAL2, and the USDT dominance chart. I’m looking at all of these on the daily, and they’re in a very similar position to Bitcoin. My conviction on them is the same as it is with BTC, in that I’m still waiting for a bit more confirmation before I really flip bullish.
So with TOTAL and TOTAL2, we’ve seen a bounce that mirrors what Bitcoin has done, but we haven’t seen enough yet for me to get excited about entering longs right here. USDT dominance has similarly experienced a bit of a downturn, and the EMAs are starting to point downwards with momentum looking like it’s shifting. But again, none of this is one hundred percent confirmed for me just yet.
Now, you can obviously play the risky route here and try to front run the market, which is fine if that’s your style, but I just think it carries too much risk right now, especially if you’re playing with leverage. For me, I’d much prefer to see a proper bullish breakout followed by a retest before I’m really convinced that we’ve shifted into more of a bullish phase.
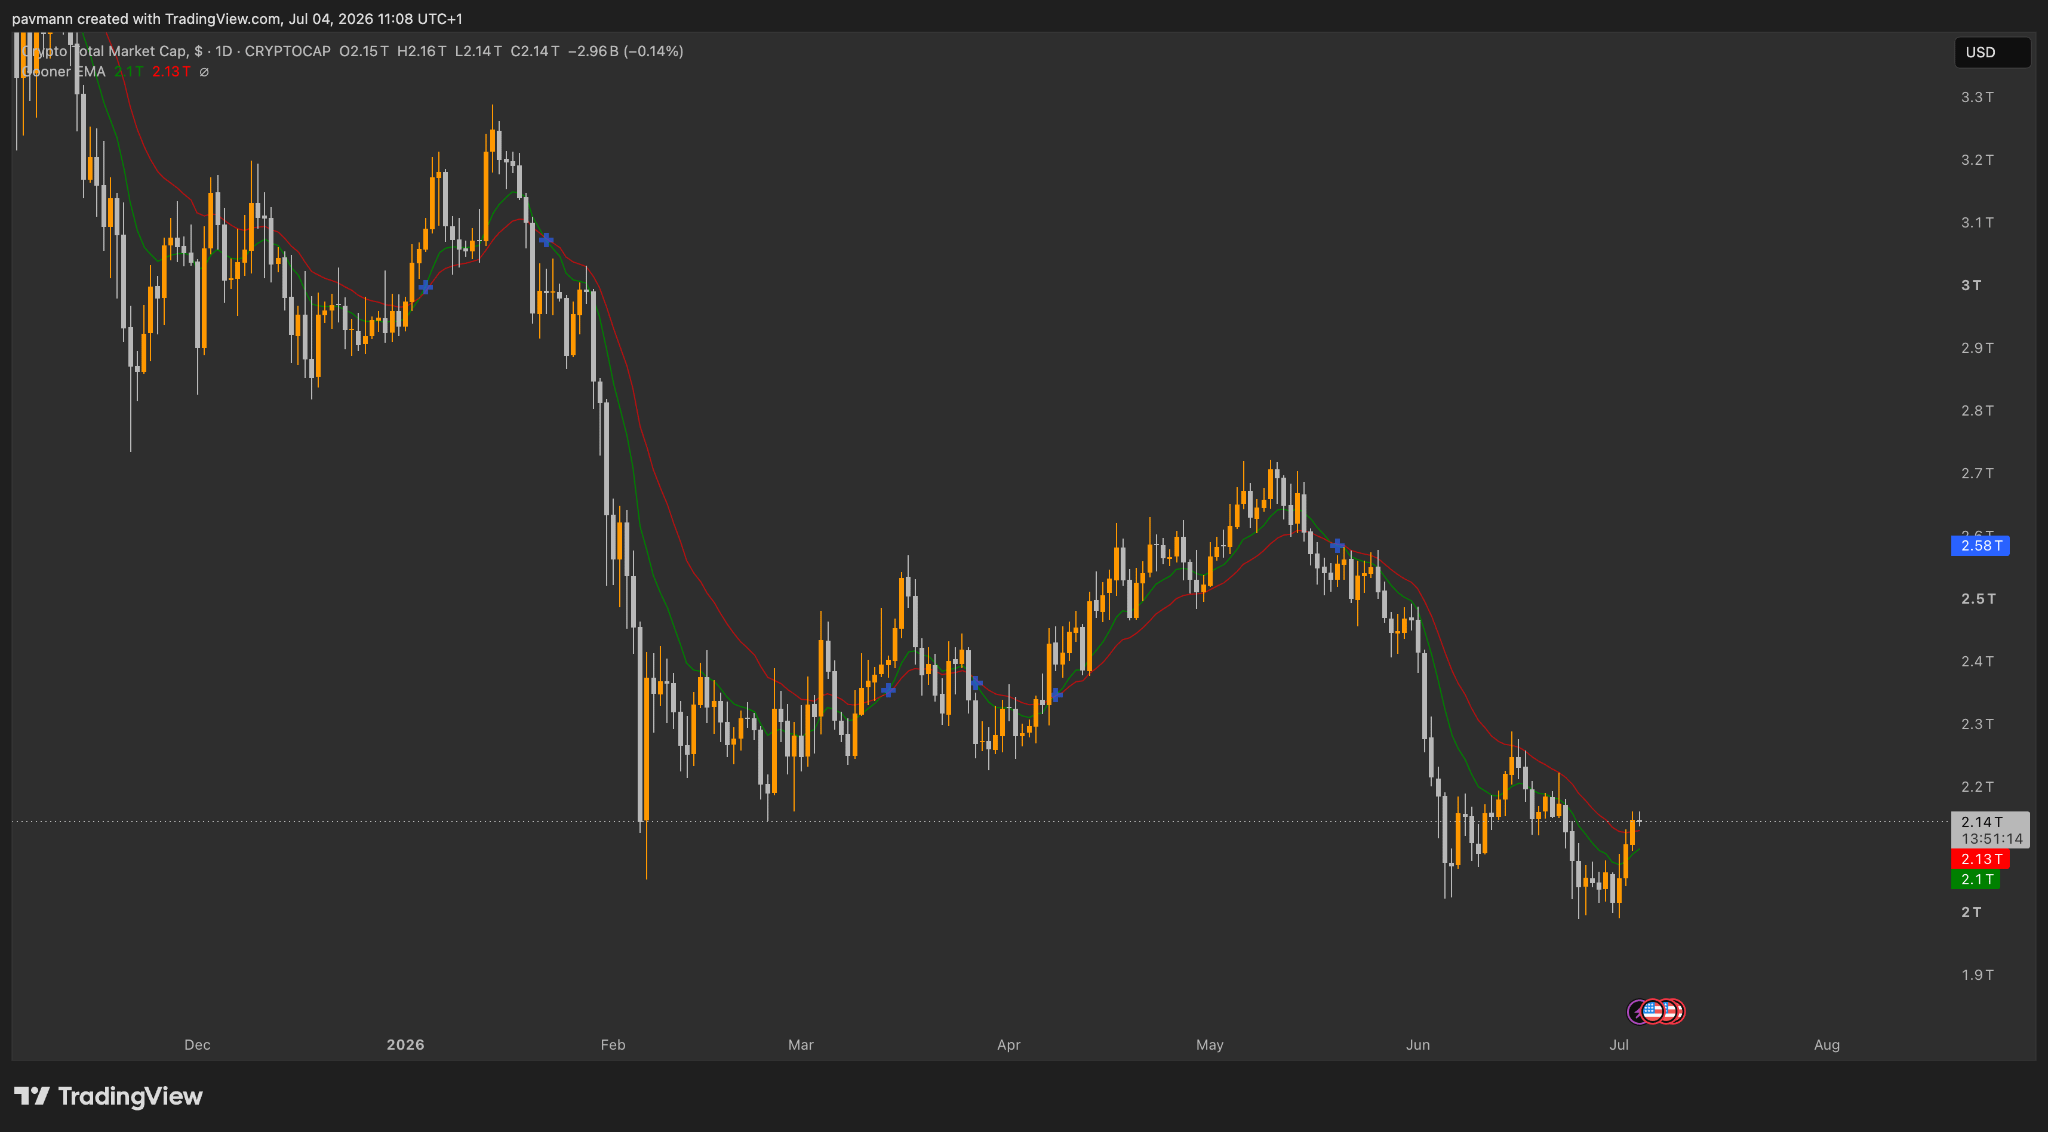
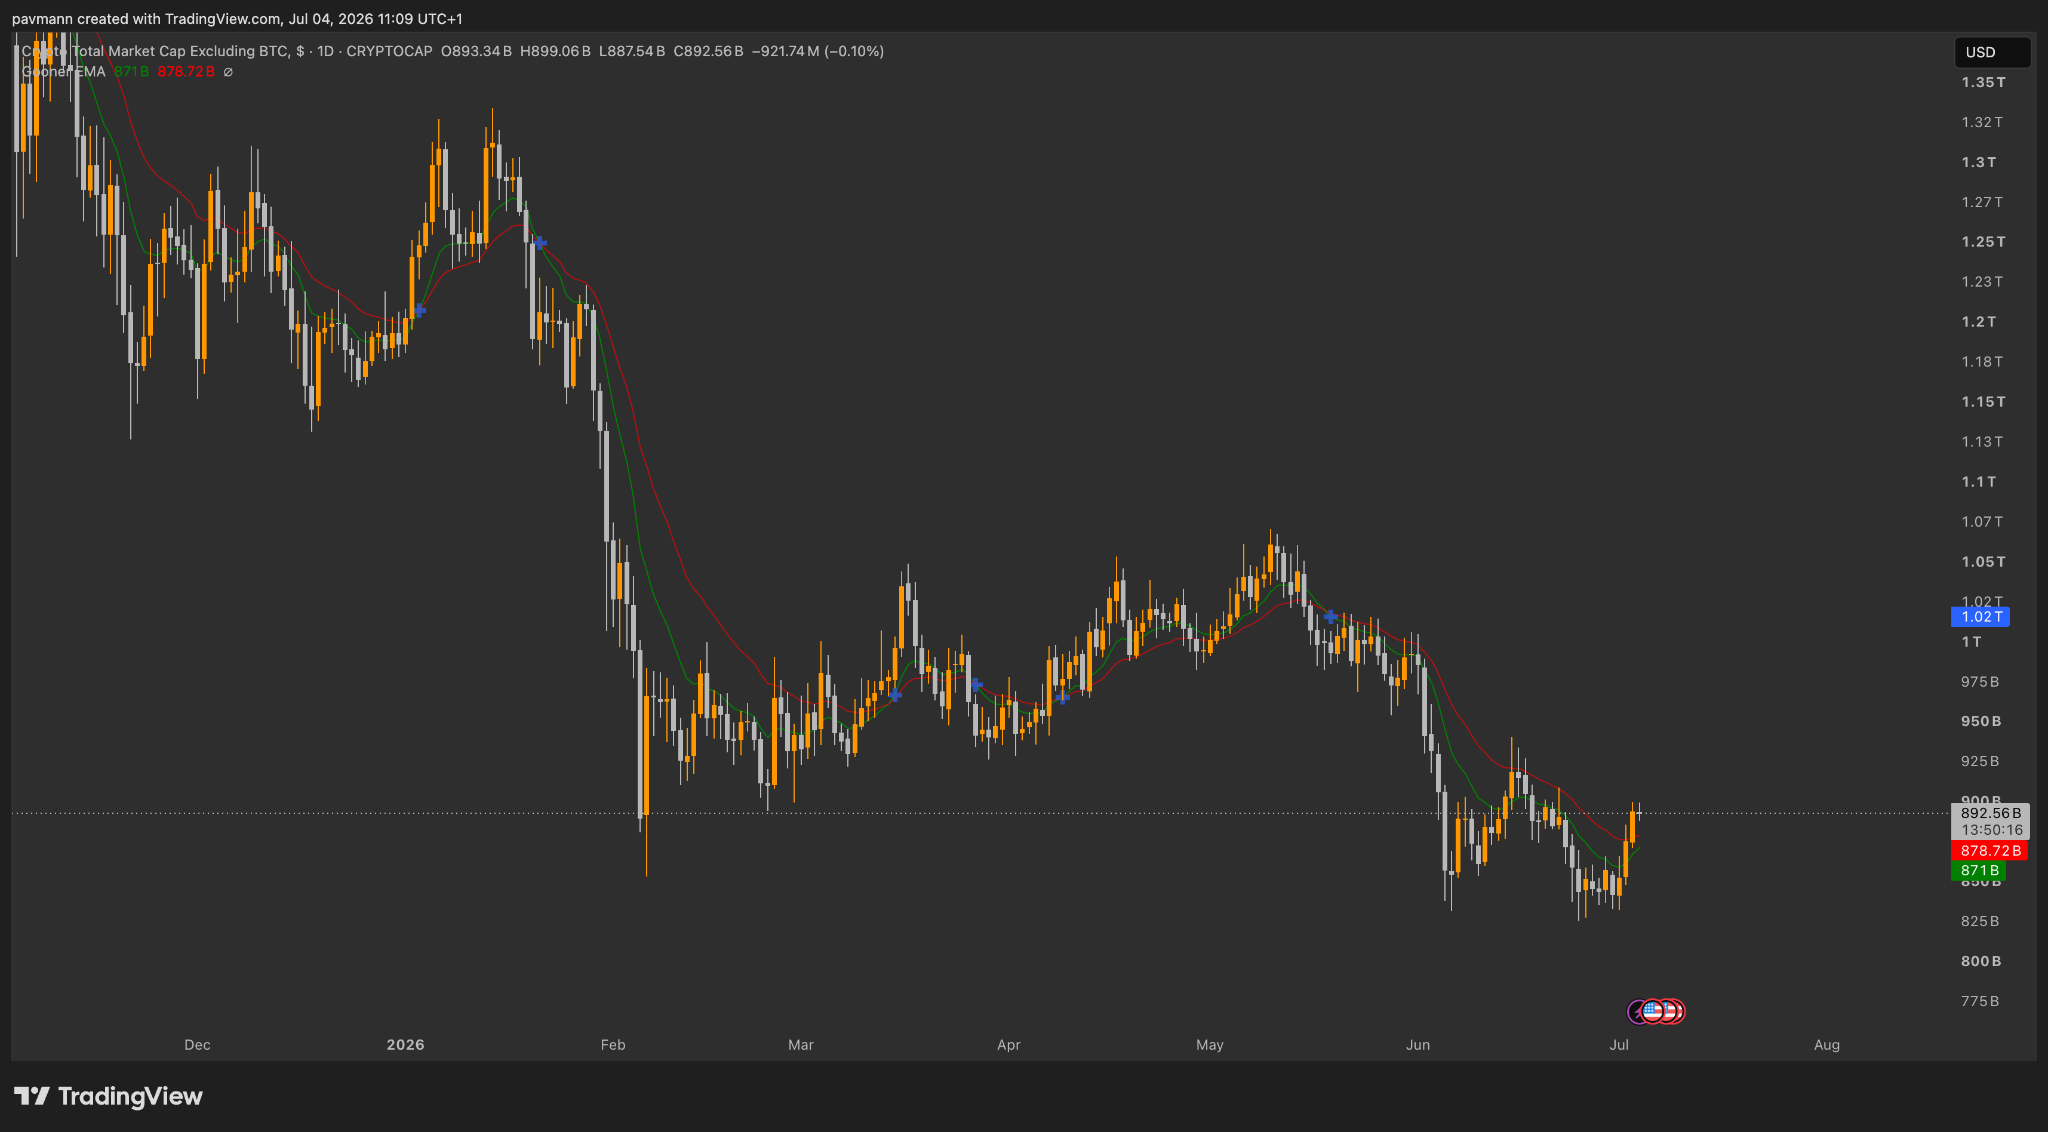
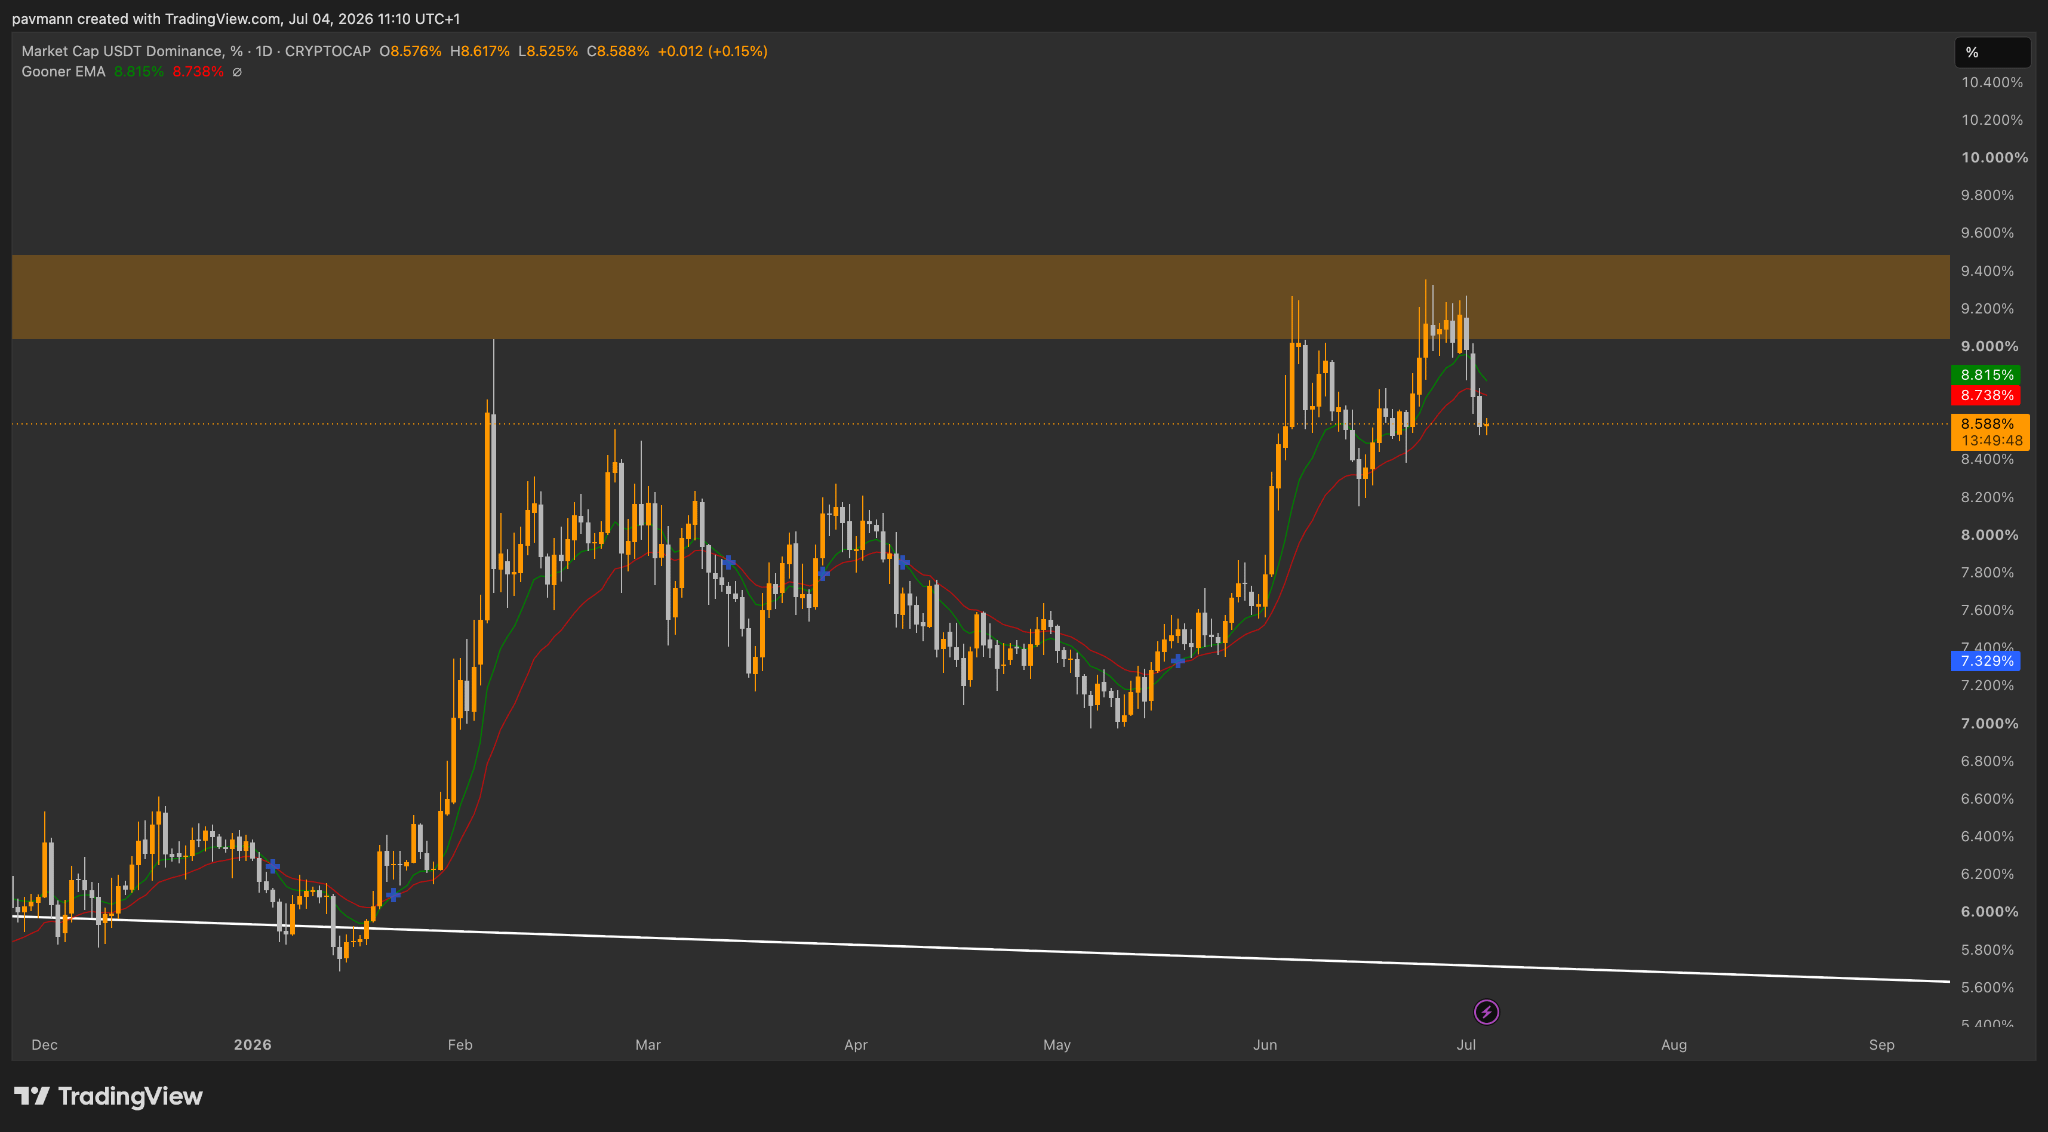
So to conclude, what I’m essentially getting at here is that I think we’re pretty close to a bottom across these charts. What we saw this week, with price dropping down into the levels we did, could genuinely end up being a bottom for the market if I’m honest with you. But I think it’s way too soon to say that with any real conviction right now.
The reason I say that is because my bias is still leaning towards us tapping into that liquidity sitting below us at least one more time. If we do see a rejection here in Bitcoin, and we’ll find out over the next few days, then to me that just reaffirms that idea. Now, whether we go all the way down to 48K is a completely different story, and that’s something I’ll address over the coming weeks depending on how the price action develops. I want to be clear here, I’m not saying that a rejection in Bitcoin sends us straight down to 48K. What I’m saying is that I think we come back to take the liquidity around 57K that we left behind this week.
LINKS:
This newsletter is free because we love sharing our insights with the community. If you enjoy it and find value in our work, consider supporting Pav’s and Will’s Beer/Coffee Fund by donating $XRP to our newsletter donation wallet below. Cheers!
$XRP donation wallet: r3qf2nALyhFwC46QqZ5gJHpF3cjr5gRcoV
Trade XRP Memes here:
https://firstledger.net/?ref=6NRu4StwrImq
Trade on MEXC: https://www.mexc.com/register?inviteCode=mexc-1etb1
Trade on WEEX using this link: https://www.weex.com/login?from=https%3A%2F%2Fwww.weex.com%2FnewbieActivities%3Fid%3D520%26type%3DBEGINNER_TASK%26vipCode%3Duspf
Trading Different (Liquidity Map) - https://t.co/3ks3QMT5VJ?ssr=true
No posts
Comments
Nothing yet. Say the first thing.
Sign in to join the conversation.