
The content below represents the personal views and opinions of the authors. It should not be considered as investment or financial advice.
The market is in pain right now. It’s not just isolated to crypto. If you look across to South Korea, they’ve had to pause their stock market trading twice this week because of 8% down days, triggering their circuit breakers.
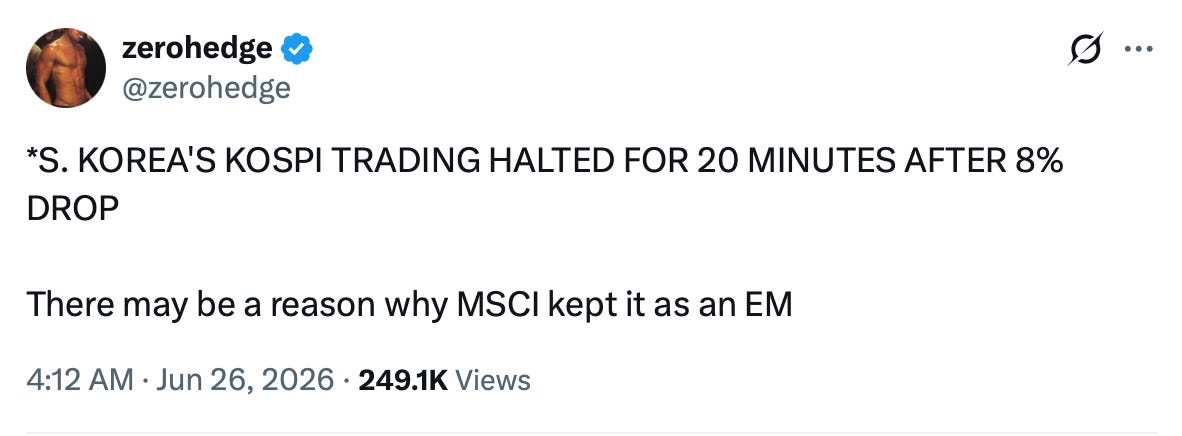
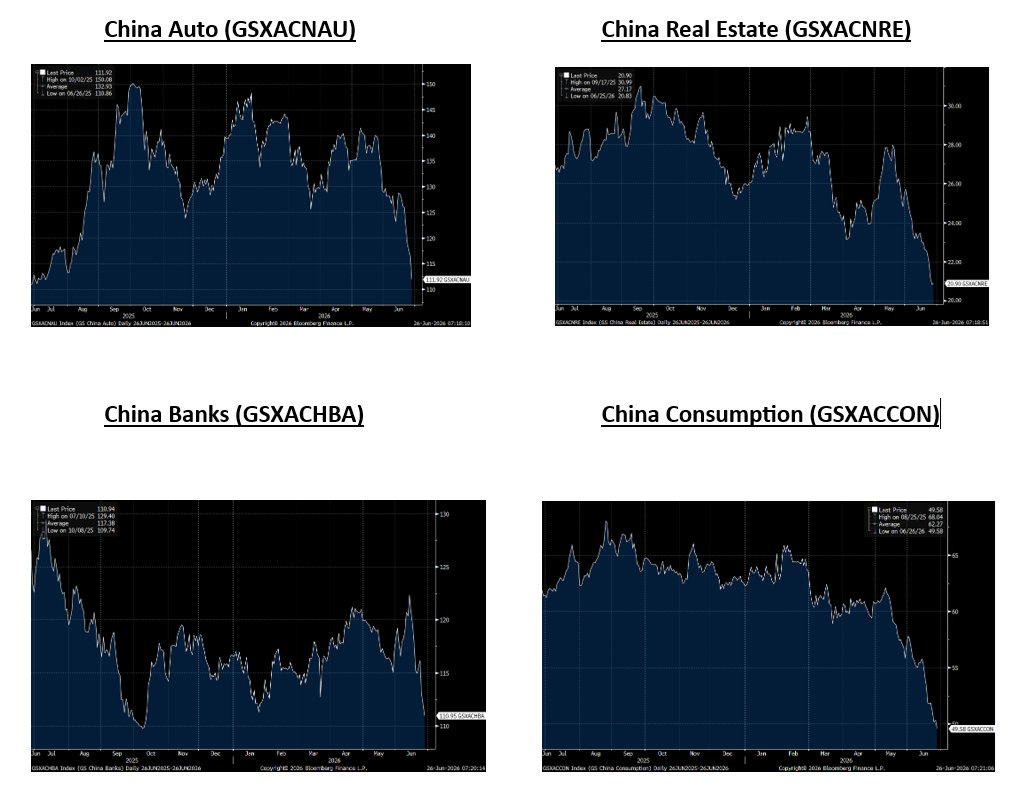
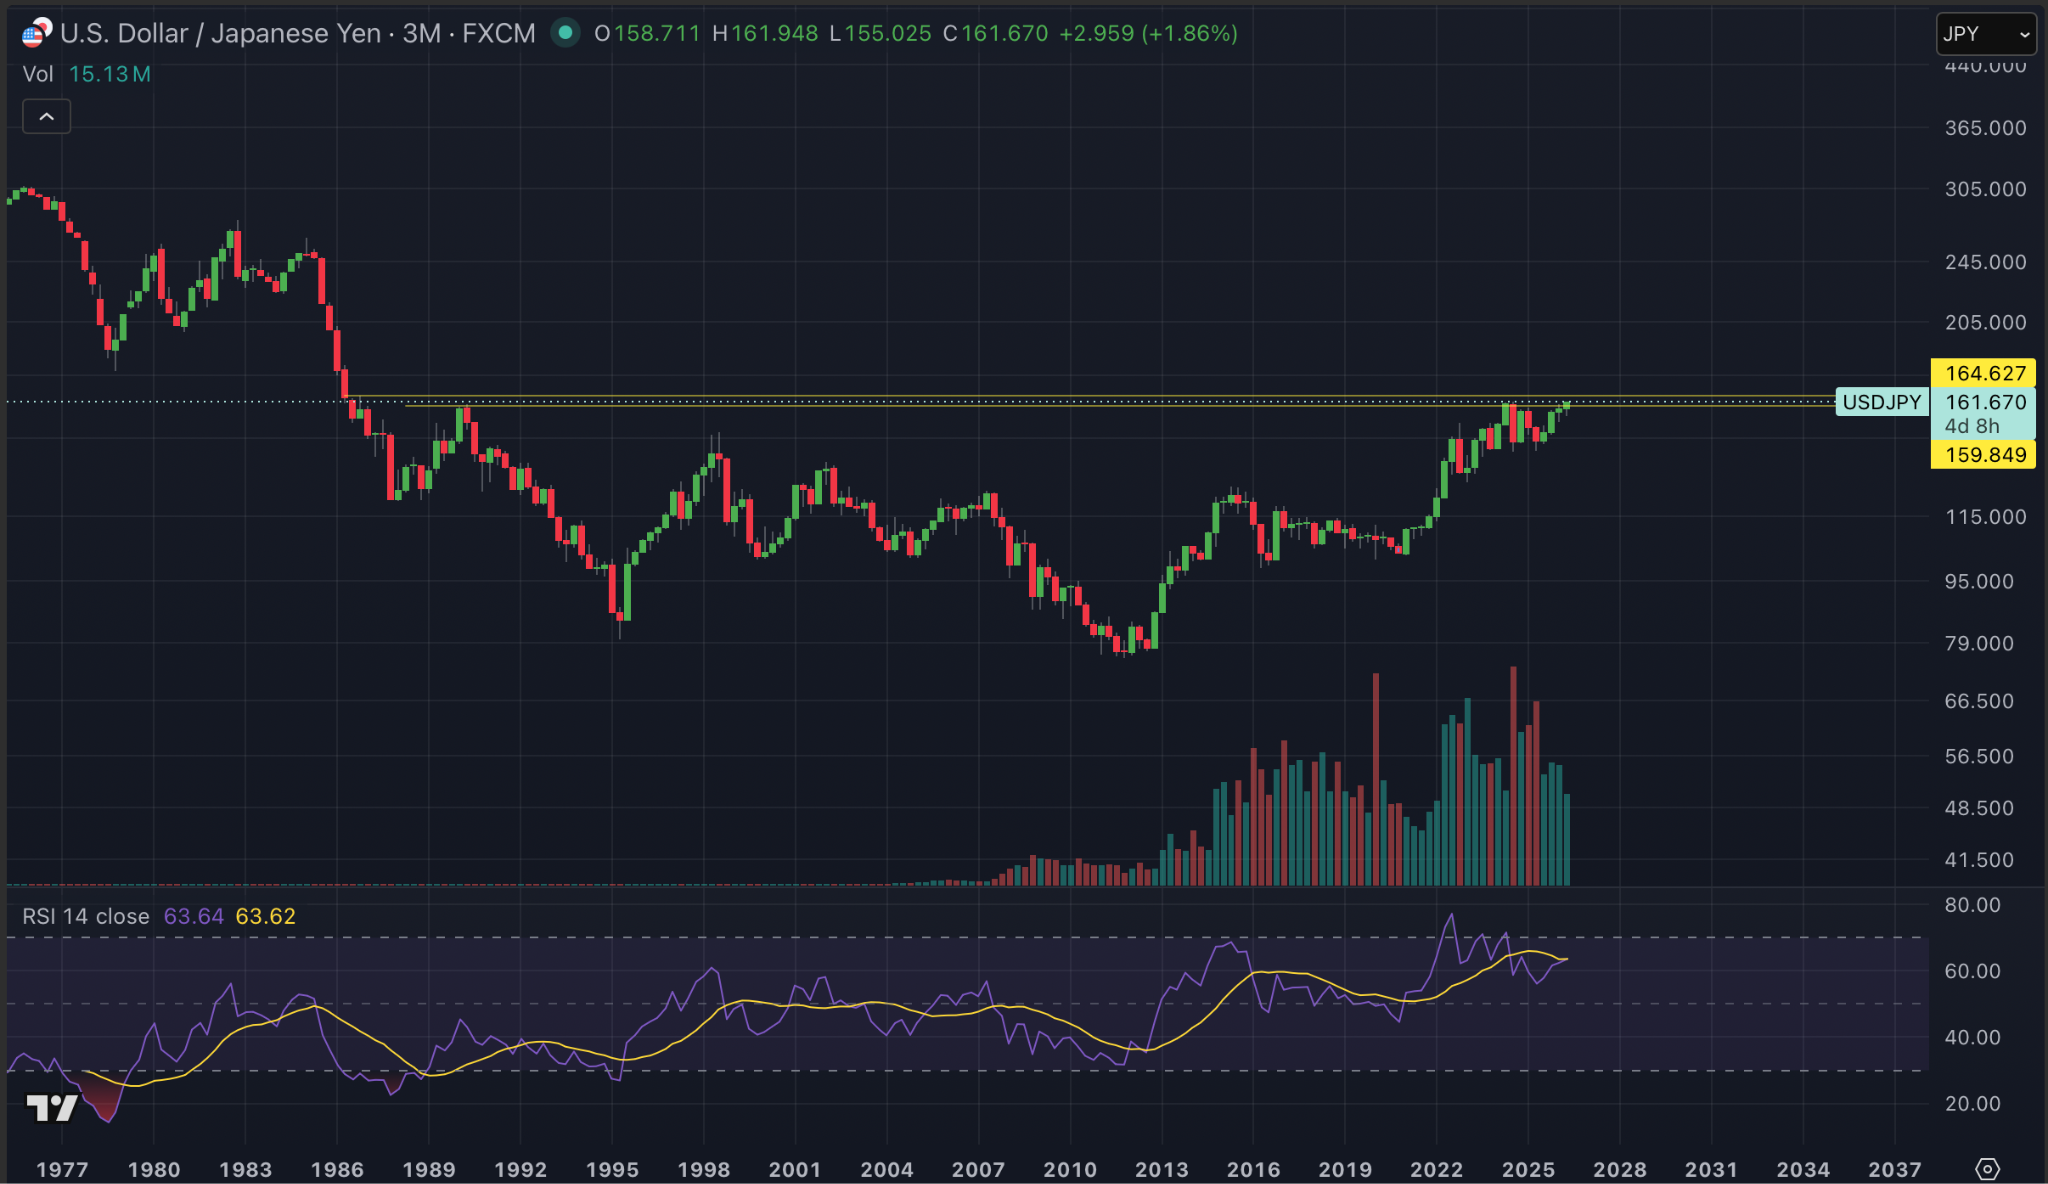
Multiple countries in Asia seem to be struggling, notably China, looking at the graphs below. But we’ve also been flagging, over and over again, what I think is the most important chart in the macro landscape right now: the Japanese yen versus the US dollar, sitting right at 40 year resistance.
Each time we’ve hit this level over the last few months, we’ve seen direct intervention by the Japanese government. And as I’ve discussed on YouTube and written about before, Scott Bessent went to Japan before Trump went to meet Xi Jinping in China. There’s clearly a strong understanding between Japan and the US.
Japan is obviously one of the biggest, if not the biggest, holders of US Treasuries in the world. A lot of people in the crypto space have also been talking about the yen carry trade. Japan is a massive exporter, and there are millions of repercussions if this chart breaks out to the upside.
I think it would trigger direct international intervention in the currency markets, maybe something along the lines of the Plaza Accord, rebalancing currencies around the world. It could potentially be that significant of a catalyst for markets.
If that doesn’t happen, when I say direct intervention, I mean we’ll likely see an increase in liquidity and capital pushed into the FX markets. I actually think that would be bullish for assets like crypto.
Exactly how and when this happens, I don’t know. I don’t know whether we see one final flush lower in asset prices first to finish off and capitulate the last of the weak hands, maybe catching people trying to long a little too early.
But I think this all adds to my broader perspective that whatever happens over the next month or two will likely mark the bottom of this period.
Whether price is already at that level now and we simply go on to form a bullish divergence, I don’t know.
Whether we have to plunge a little deeper first, I don’t know.
But to me, the macro environment is setting up for either a reversal back to the upside or a complete collapse of the current world order.
Why I don’t think it will be Armageddon.
Well, first off, as I’ve said, the greed of man. But secondly, something that’s telling me from a technical perspective that we’re potentially getting close to a reversal is the oil price.
I don’t know how people aren’t looking at this chart and thinking we’re either going to see an extreme rally in assets, or we’re moving into a deflationary period rather than an inflationary one.
We’ve had every excuse and opportunity under the sun for oil to rip over the last few months, yet oil is back to pretty much pre-war levels. The war isn’t officially over. We just have an MOU, a Memorandum of Understanding, that gives us a 60 day ceasefire. What happens after that, I don’t know.
But it’s insane to see oil trading at $69 right now.
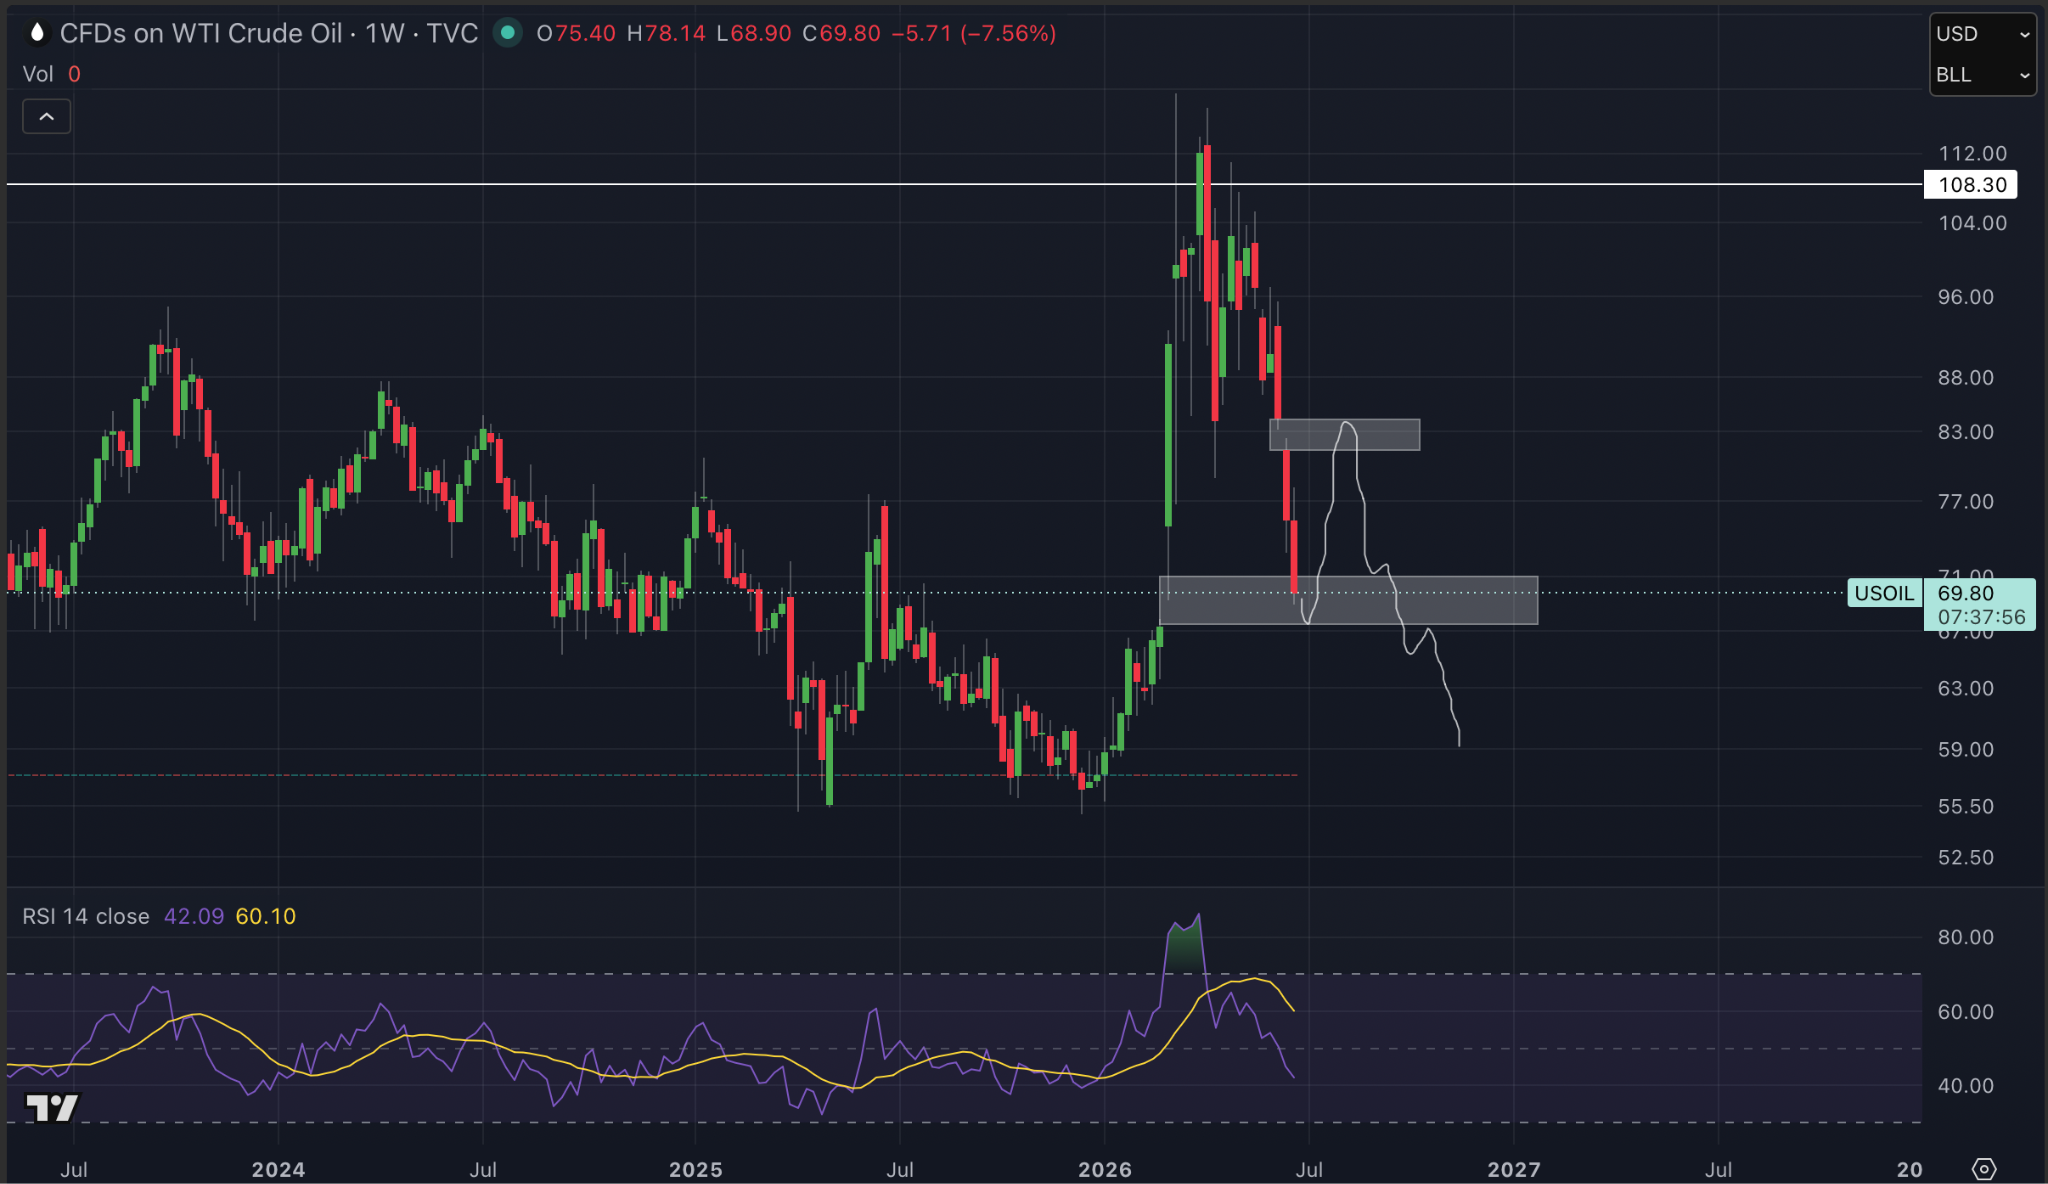
To me, this reinforces what I’ve been speculating on for months, that these issues were mainly supply side driven. It also reinforces the idea that there isn’t huge demand for oil right now.
If there was huge demand for oil, that’s when you could argue the economy was running hot. That’s when you could argue inflation was something to genuinely worry about.
But I actually think the opposite is true.
In my opinion, the inflation prints have largely been one offs and almost entirely supply driven. If that’s the case, they should come back down just as quickly as they went up.
In fact, even this month PCE came in slightly lower than expected. Remember, that number is still pricing in the higher oil prices from one or two months ago.
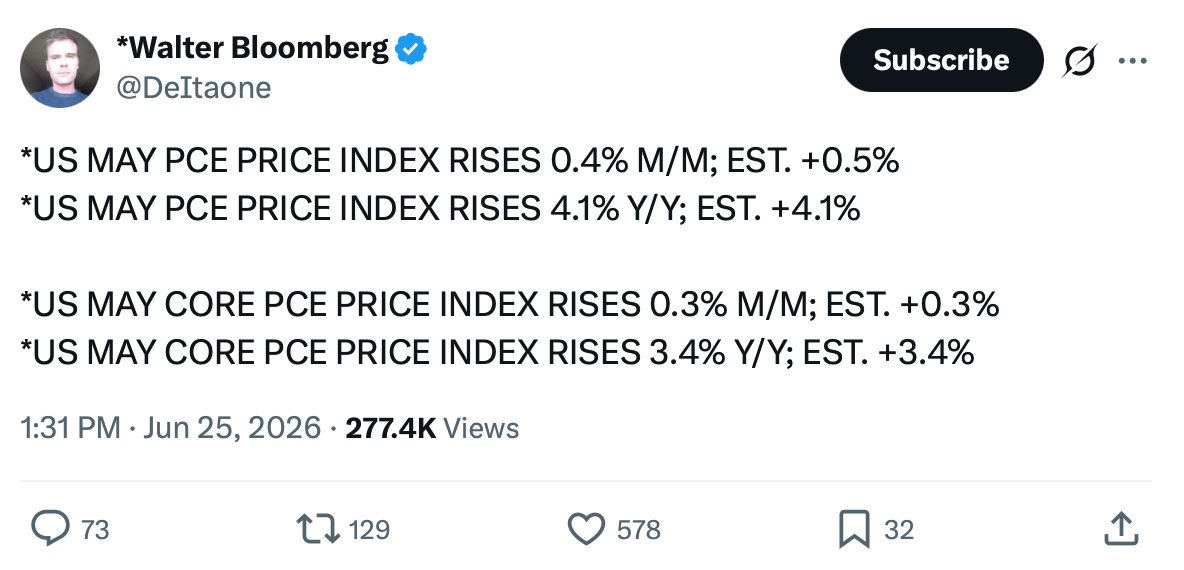
To me, that’s telling us there is a real possibility that Kevin Warsh comes out and starts beating the drum for growth in the US.
And if he aligns with what the Trump administration wanted him to do when he took the position, then I think he has the excuse to cut rates here, or at least begin signalling that rate cuts are coming.
A lot of people still say that’s impossible. There are still plenty of people arguing that the Fed doesn’t have the data to justify doing that.
But when Warsh came out last week, as I discussed, and said he was moving away from forward guidance, why do you think he did that?
In my opinion, it’s so he can turn on a dime and say, “Actually, do you know what? We want growth. We want to keep pumping money into these AI companies because we think they’re going to solve our productivity problem.”
And if you look around, inflation was largely supply side driven. There doesn’t actually appear to be a huge demand issue right now.
In fact, how can oil prices be as low as they are if there really is an overheating economy?
Going into the midterms, I think this sets the US up for a significant stimulus package or a much weaker monetary policy stance, perhaps after some sort of catalyst like a global FX crisis stemming from the issues in Japan.
I think we’re setting up extremely close to the catalyst that sparks full bull mode for markets.And to me, this is something that gold is potentially already sniffing out.
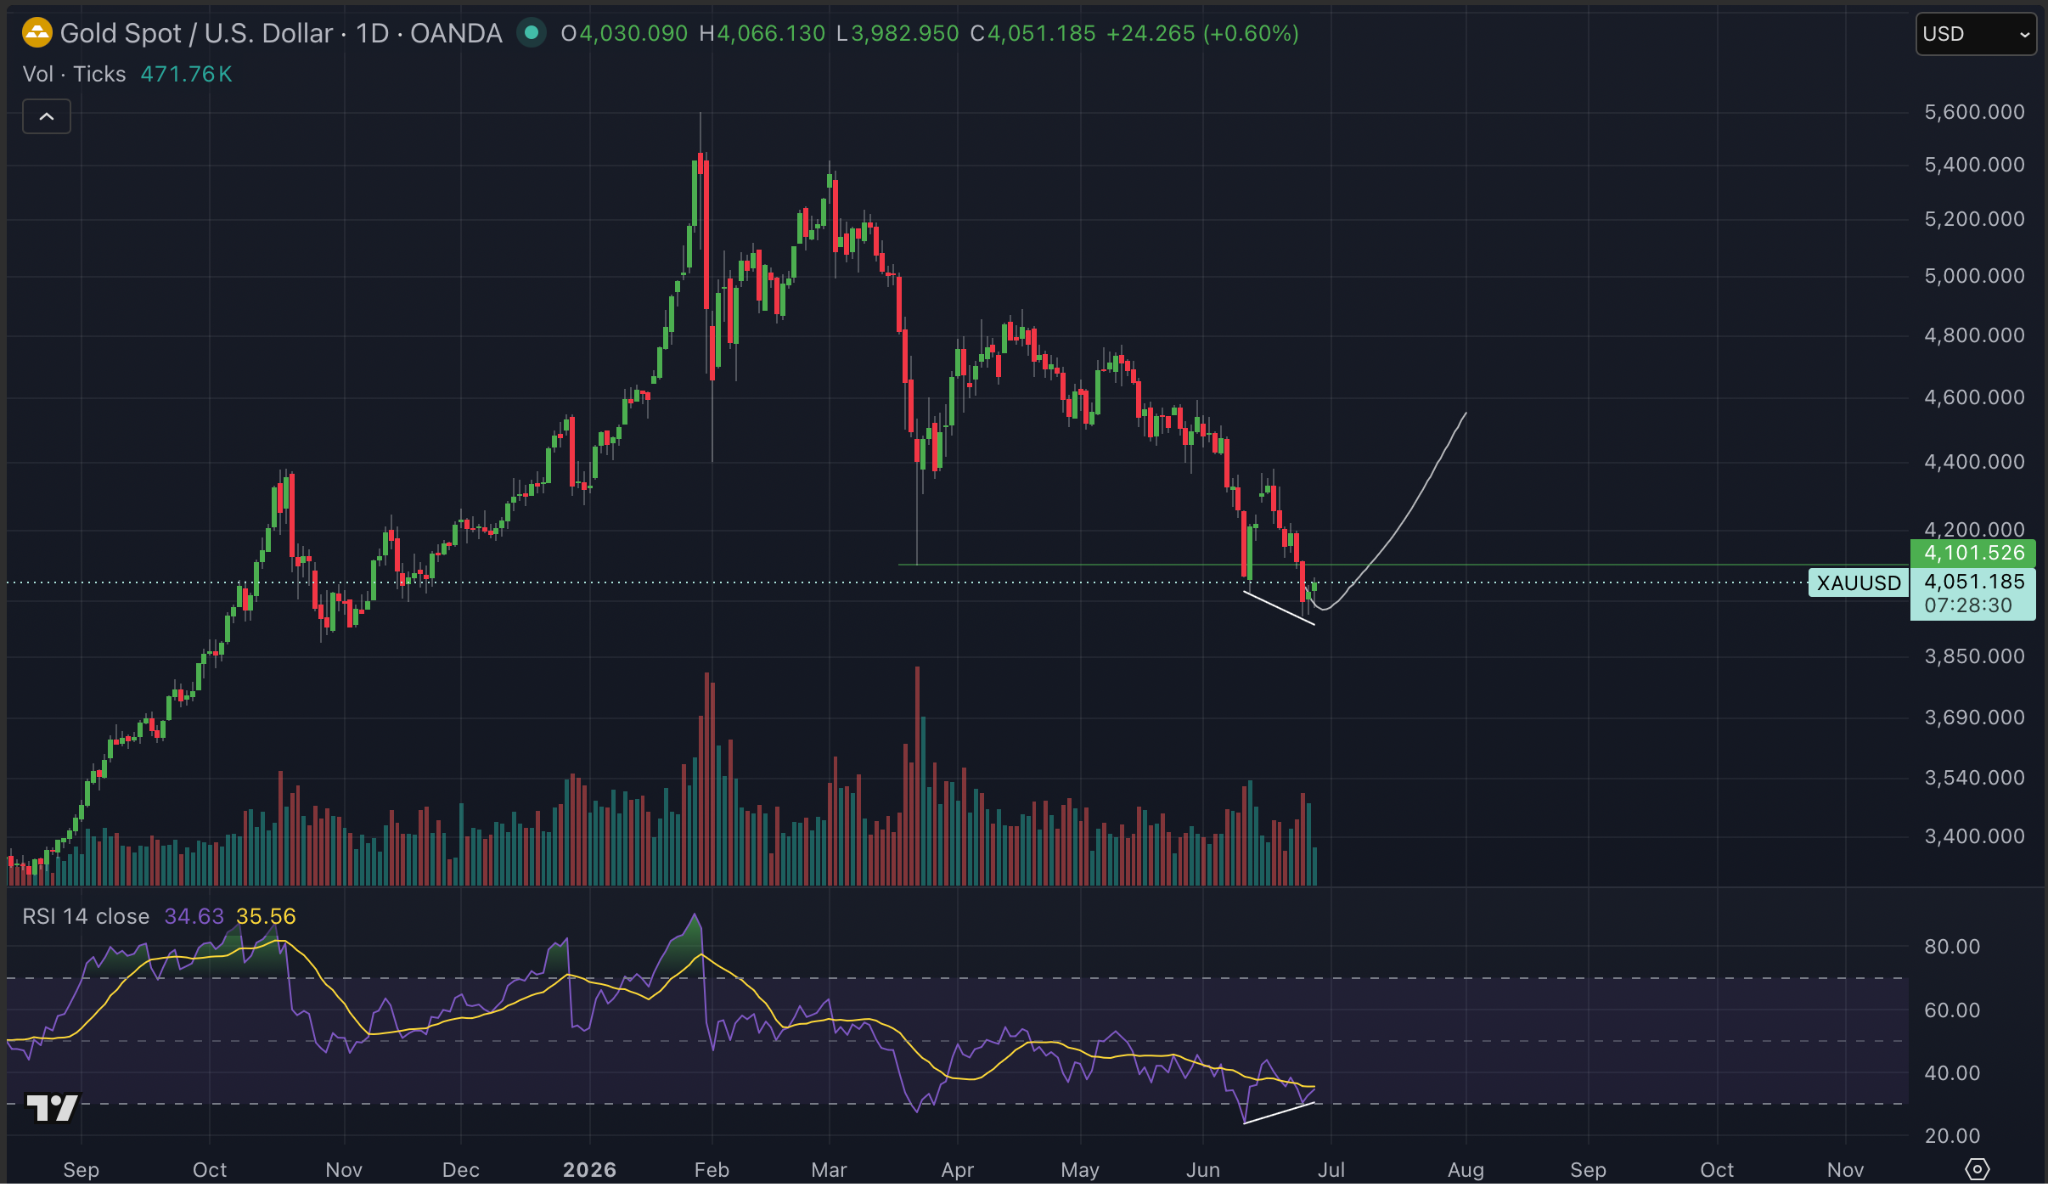
What we can see is that gold has swept its March lows and put in what looks like an exciting bullish divergence on both the daily and the four hourly timeframes, right as I’m laying out this setup for potential uncertainty around the world.
People appear to be starting to move capital back into gold.
Now, obviously, this is an early call, but keep your eye on gold here because it looks to be recognising exactly what I’ve been discussing.
This newsletter obviously focuses on crypto, but I think the macro is so important here because, if I’ve got the read right on what I think is coming, then it sets crypto up to really experience the brunt of this potential liquidity, or intervention, whatever is about to come.
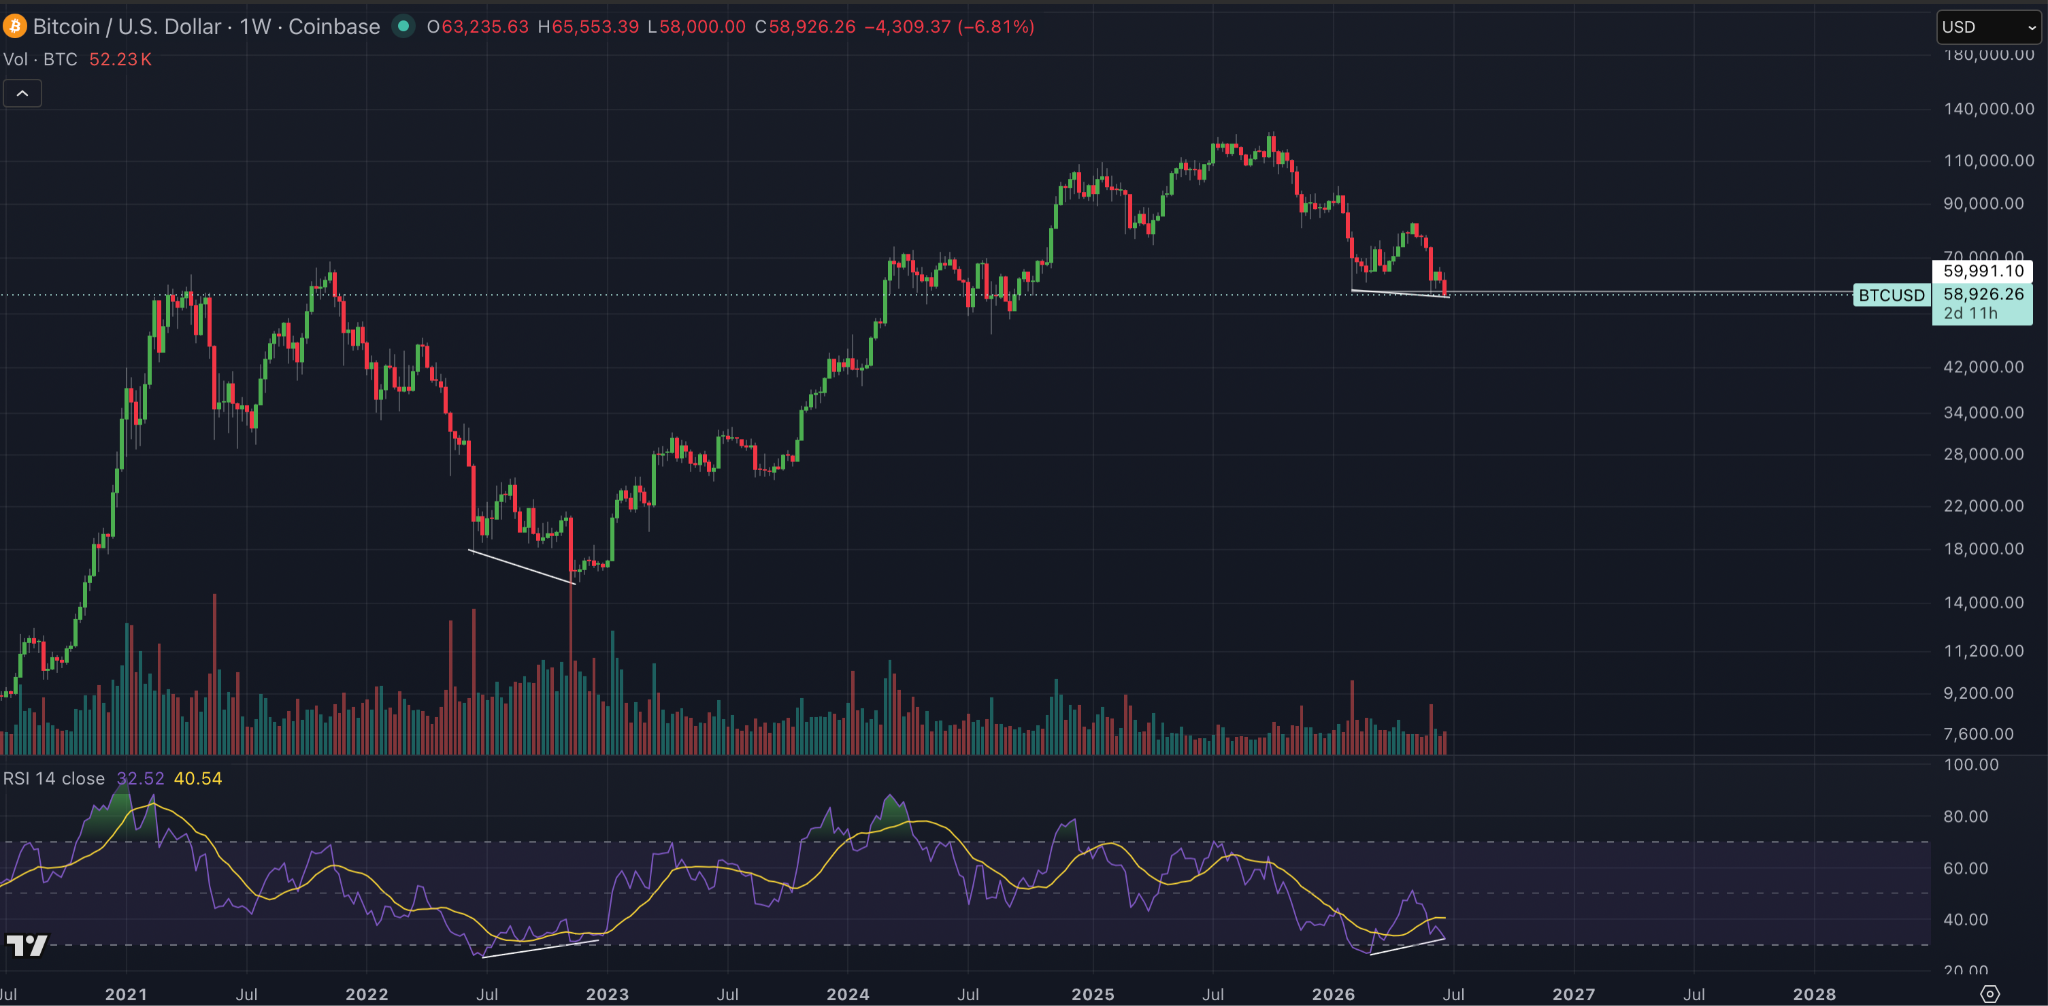
Crypto has been beaten down, and I have no idea why it’s disconnected so heavily from other assets. A lot of people are trying to make sense of it, and obviously the most common explanation is the four year cycle. I’m still not sold on that thesis.
I think something may have broken, maybe during the October 10th liquidation. I feel like that’s maybe why Binance still aren’t getting their MiCA licence when, with the amount of money they’ve got, you would expect them to. I think they might have identified something. I don’t know what that might be, and this is pure speculation, but that’s just how I feel.
Now, I also feel like most of that move has been worked out of the market. I think what we’re seeing now is mainly sentiment damage and, for a lot of people, portfolio damage.
Structurally, though, when you look at the market, with extreme fear in sentiment and the potential for an influx of liquidity based on macro uncertainty, a lot of that liquidity could find its way into crypto.
Especially when you’re seeing companies like SpaceX IPO. People are going to have realised massive financial gains from that. And if extra liquidity is then pushed into the market, where does it go?
Does it flow into an asset that’s already worth $2.5 trillion from the SpaceX IPO alone, where 95% of the supply has only just unlocked?
Or does it flow into something like Bitcoin that’s still roughly 50% below its highs while everything else is running pretty hot?
I think commodities like gold will be the indicator if they start to move again. I actually think crypto will outperform gold this time, but I think gold is something you need to watch for this potential next move, alongside crypto.
If you look at Bitcoin on the weekly timeframe, we’ve got a bullish divergence and a very similar structure to previous cycles. The only real question is whether the time element still matters.
If you’re a four year cycle theorist, then that would bring us into Q3 this year for the bottom. I don’t think that has to happen, but you have to give it some weight because we are now close enough for that to be a realistic possibility.
DCAing here into solid assets is absolutely what I would be doing.
I’m going to cover XRP now as well, and where I’d specifically be bidding on XRP.
Personally, I think it’s a bid here. I think it’s almost full portfolio deployment. You don’t have to rush all your capital in at once, but if you want to be involved in crypto, I think you need to be seriously allocating at these prices.
XRP specifically here.
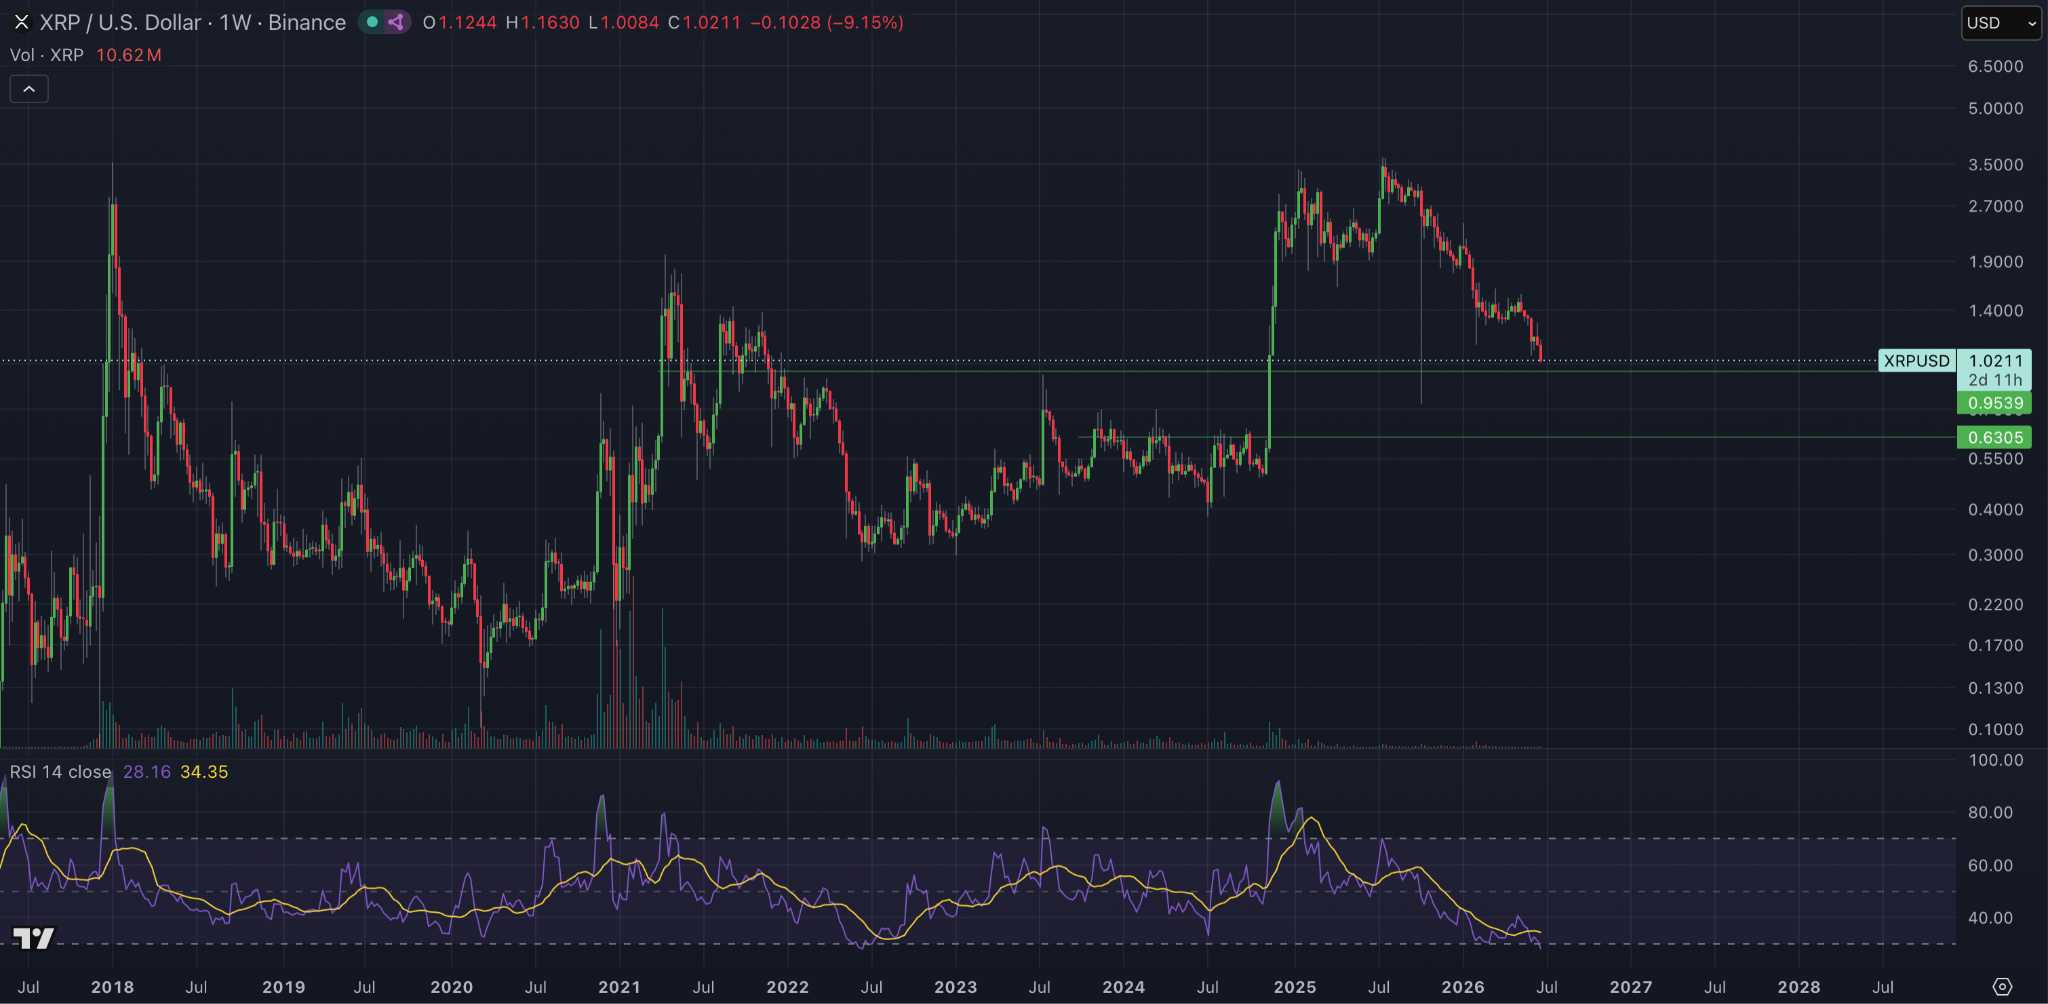
On the chart that you can see, you’ll notice two horizontal green lines. These are where I’d be bidding. Between those two levels, if you’re looking at the three month timeframe, there’s key support in both areas.
We obviously also have the October 10th wick that I’d be watching. It’s still on this Binance chart and hasn’t been filled. That’s around the 80 cent area, roughly 77.25 cents.
I know all of this sounds awful, and it feels awful for me too, as I’m majority allocated to XRP.
But I left this chart on the weekly timeframe because you can see that, for only the second time in history, we’re hitting the oversold area on the weekly RSI. We’re also the most oversold we’ve ever been on the monthly timeframe.
To me, these are historical buying opportunities for XRP.
Personally, I’m going to have a stab at 93 cents with some leverage. Low leverage, but I’m going to have a stab there, and then I’ll look to add to my margin if we come a bit lower.
If you believe crypto is going to be part of the future, which I do, and you believe we’re very close to seeing significant legislation in the US, then I think XRP will be a major beneficiary of that.
The chart is telling you that XRP is the most beaten up it has ever been in terms of both momentum and sentiment.
To me, it’s time to be placing your bids and allocating some capital.
And if you can’t watch the downside volatility, turn your laptop off, place your bids, and see if they get filled.
A year from now, I think this picture will look significantly different, and I believe price will be much higher than it is at the time of writing.
I haven’t done this in a while, but this week I’m just going to walk through what I’m seeing overall by presenting a few charts I’m looking at right now.
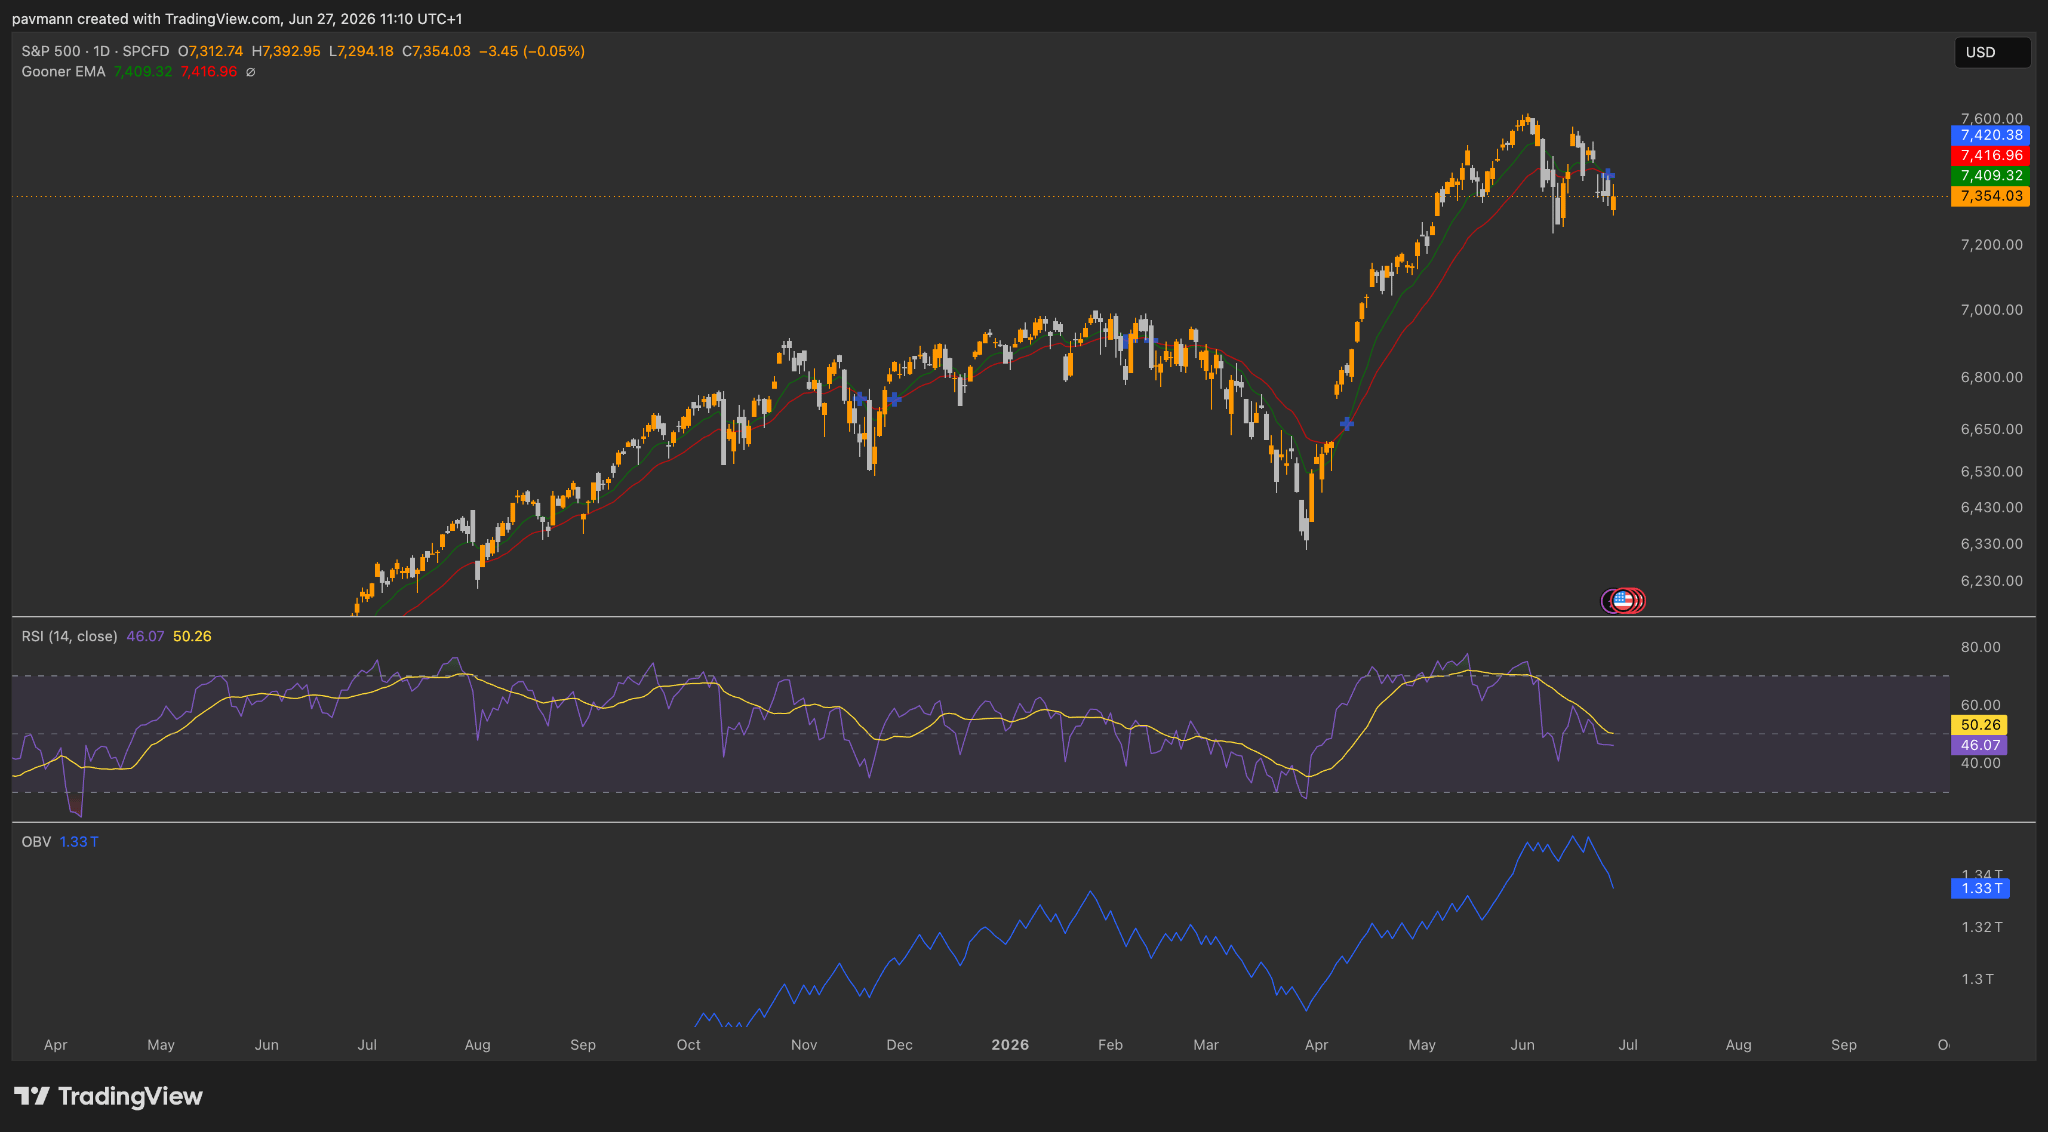
Starting things off with the S&P 500. What we’re seeing at the moment is a bit mad, because the S&P and crypto appear to have decoupled, and this is something people have been speculating about for years. Whether that correlation would hold, whether it would break, whether crypto would eventually find its own identity as an asset class. But I’d be careful betting that decoupling is permanent, because I think leaning too hard on that narrative right now is a risky position to take.
When I look at the S&P on the daily, it’s starting to look like we could be heading into at least a short term bearish period. A few things are standing out to me.
The first is the Gooner EMA, which is a TradingView indicator that plots the 11 and 22 EMAs and flags when they cross bullish or bearish. Like any EMA-based tool, it needs to be taken with a pinch of salt. But right now on the daily we are seeing a bearish cross, and the hit rate on this particular indicator is actually fairly high, so it’s worth paying attention to. On top of that, the RSI is struggling to reclaim the 50 level, which historically tends to act as the dividing line between bullish and bearish momentum on this kind of timeframe. And if you look at the OBV, volume is dropping off, which is not what you want to see if you’re expecting a sustained push higher.
Put those three things together and the picture that emerges is one of a market that looks tired in the short term rather than one that is building for another leg up.
And if that’s what plays out on the S&P, I think we have to be honest with ourselves and acknowledge that crypto probably doesn’t escape it entirely, however much we’d prefer otherwise.
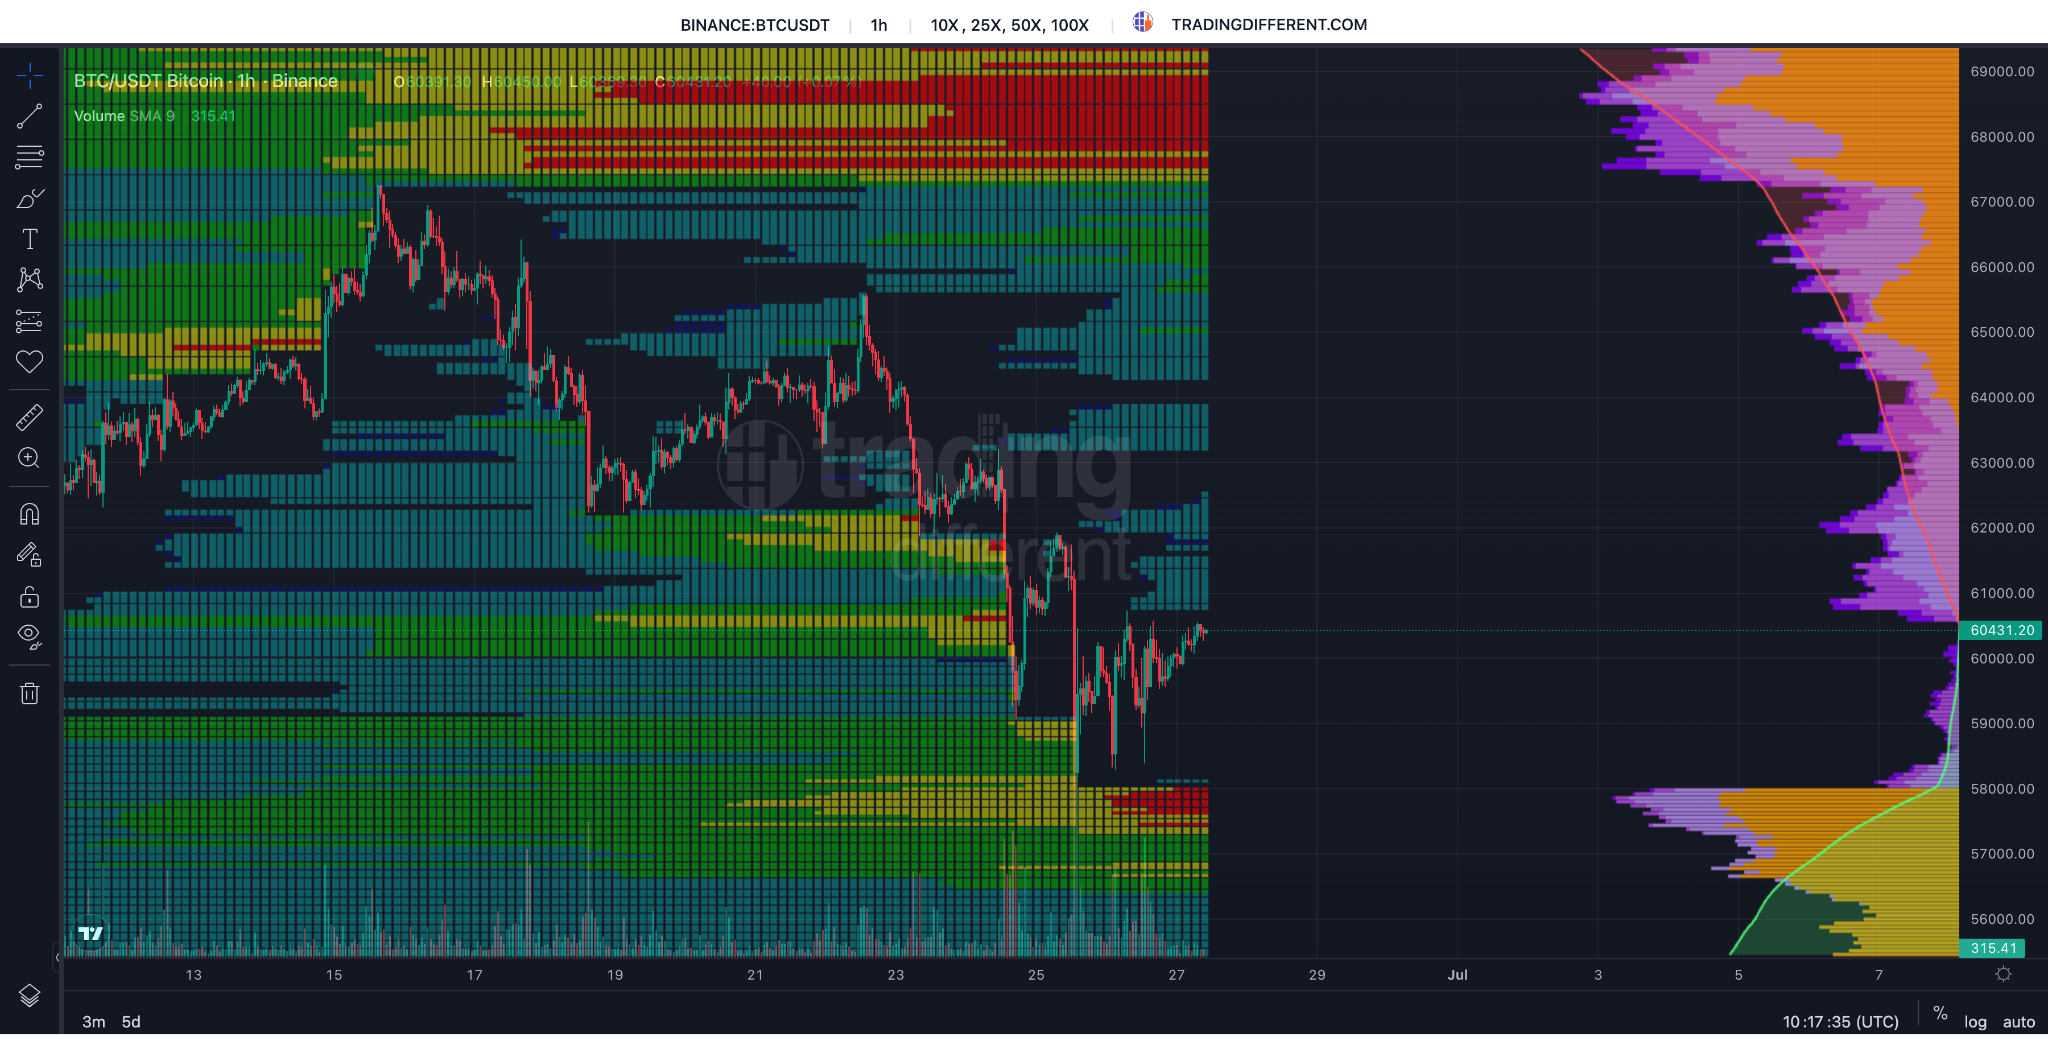
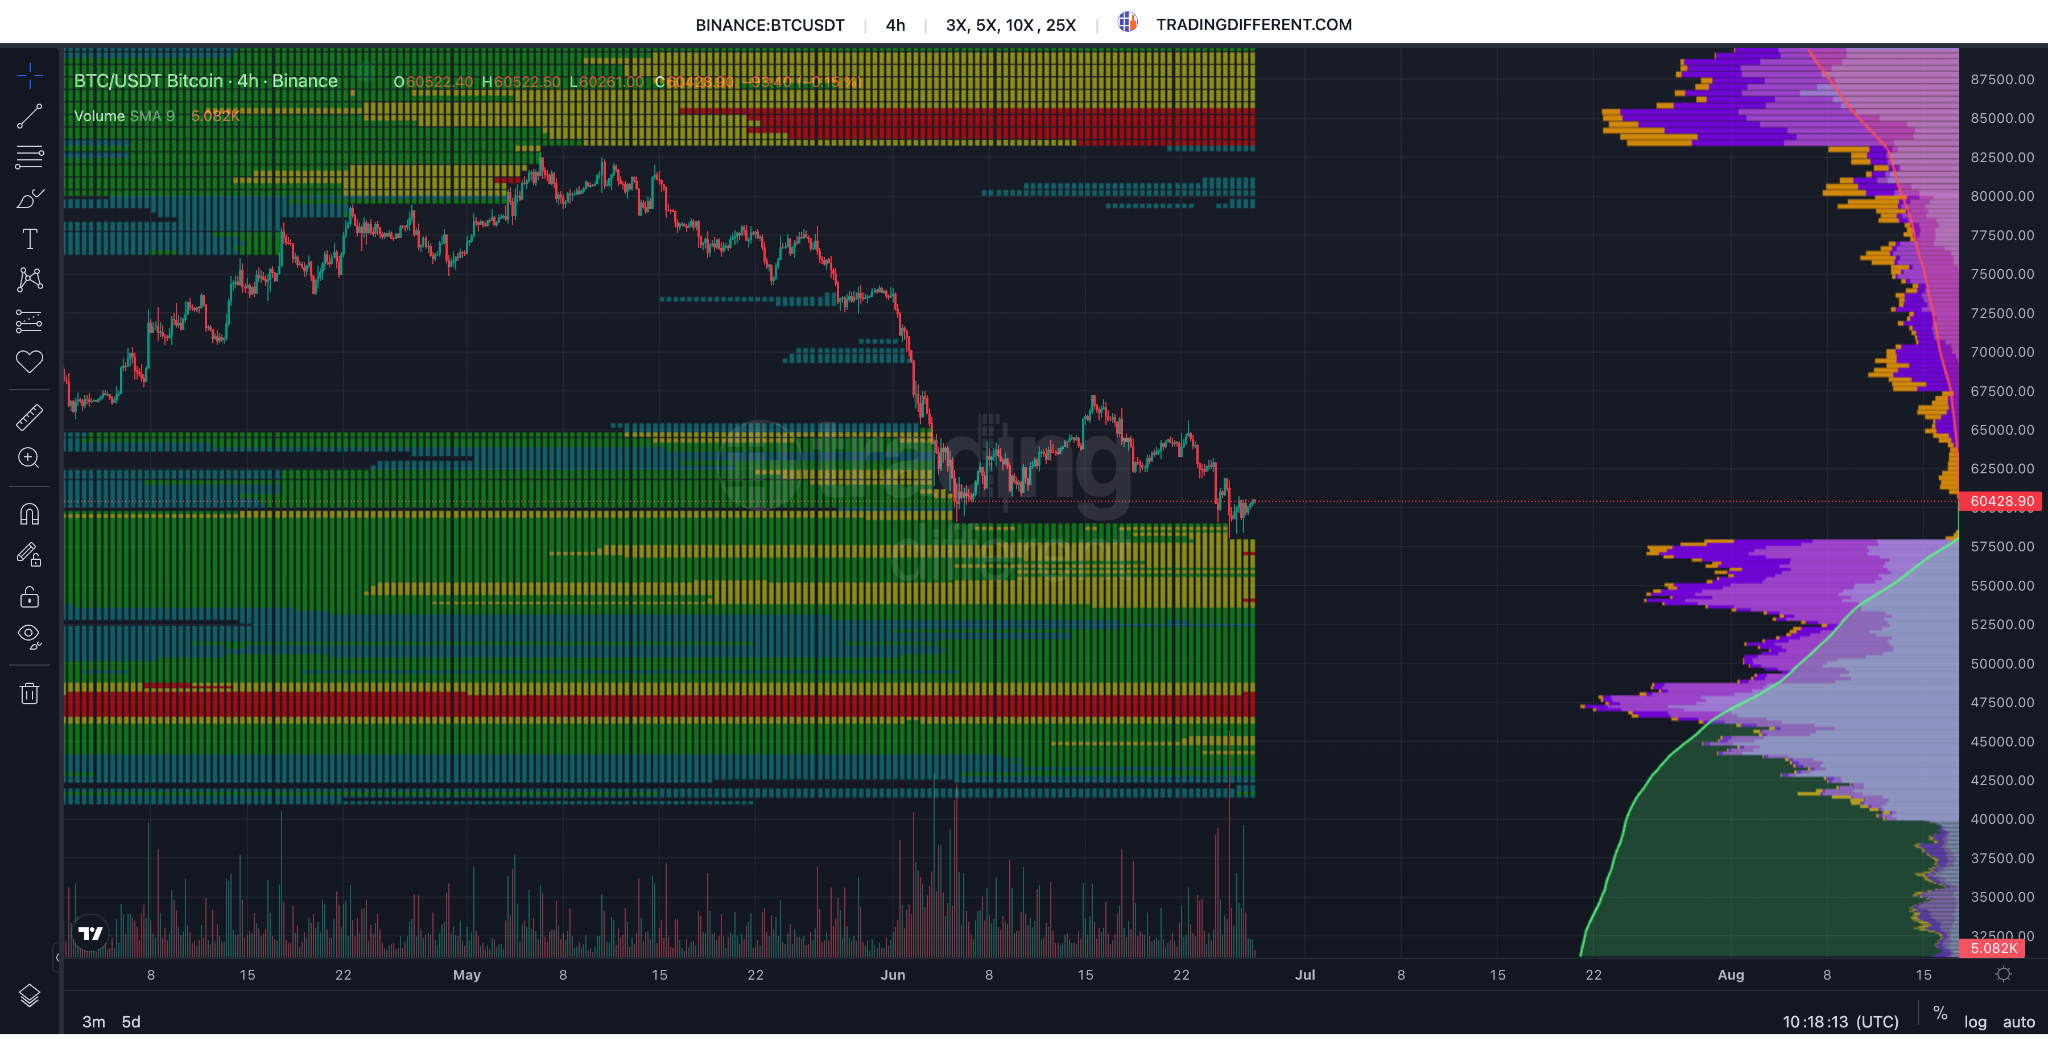
So what does all of this mean for Bitcoin? As if we haven’t had enough pain already.
When I look at the hourly timeframe, there is liquidity sitting around $57,000. And when you zoom out to the four hour, the picture gets a little more uncomfortable, because there is some pretty heavy liquidity sitting around $48,000. Do we go all the way down there? Honestly, I’m not sure. There’s certainly a chance of it. But what I do think is that right now it’s dangerous to be actively hunting for longs.
We are still in a downtrend. Until we see clear invalidations of that structure, the default assumption has to be that we continue lower and eat into that liquidity below us. That’s just how this works. You follow the structure until the structure tells you otherwise.
Now, flip the scenario. If we do start to see those invalidations, then we all know what’s sitting above us. A serious amount of liquidity. We’ve talked about it week after week. The upside case hasn’t gone anywhere, it’s just a matter of when the market decides to go and get it.
But for now, patience over conviction. The trend is the trend until it isn’t.
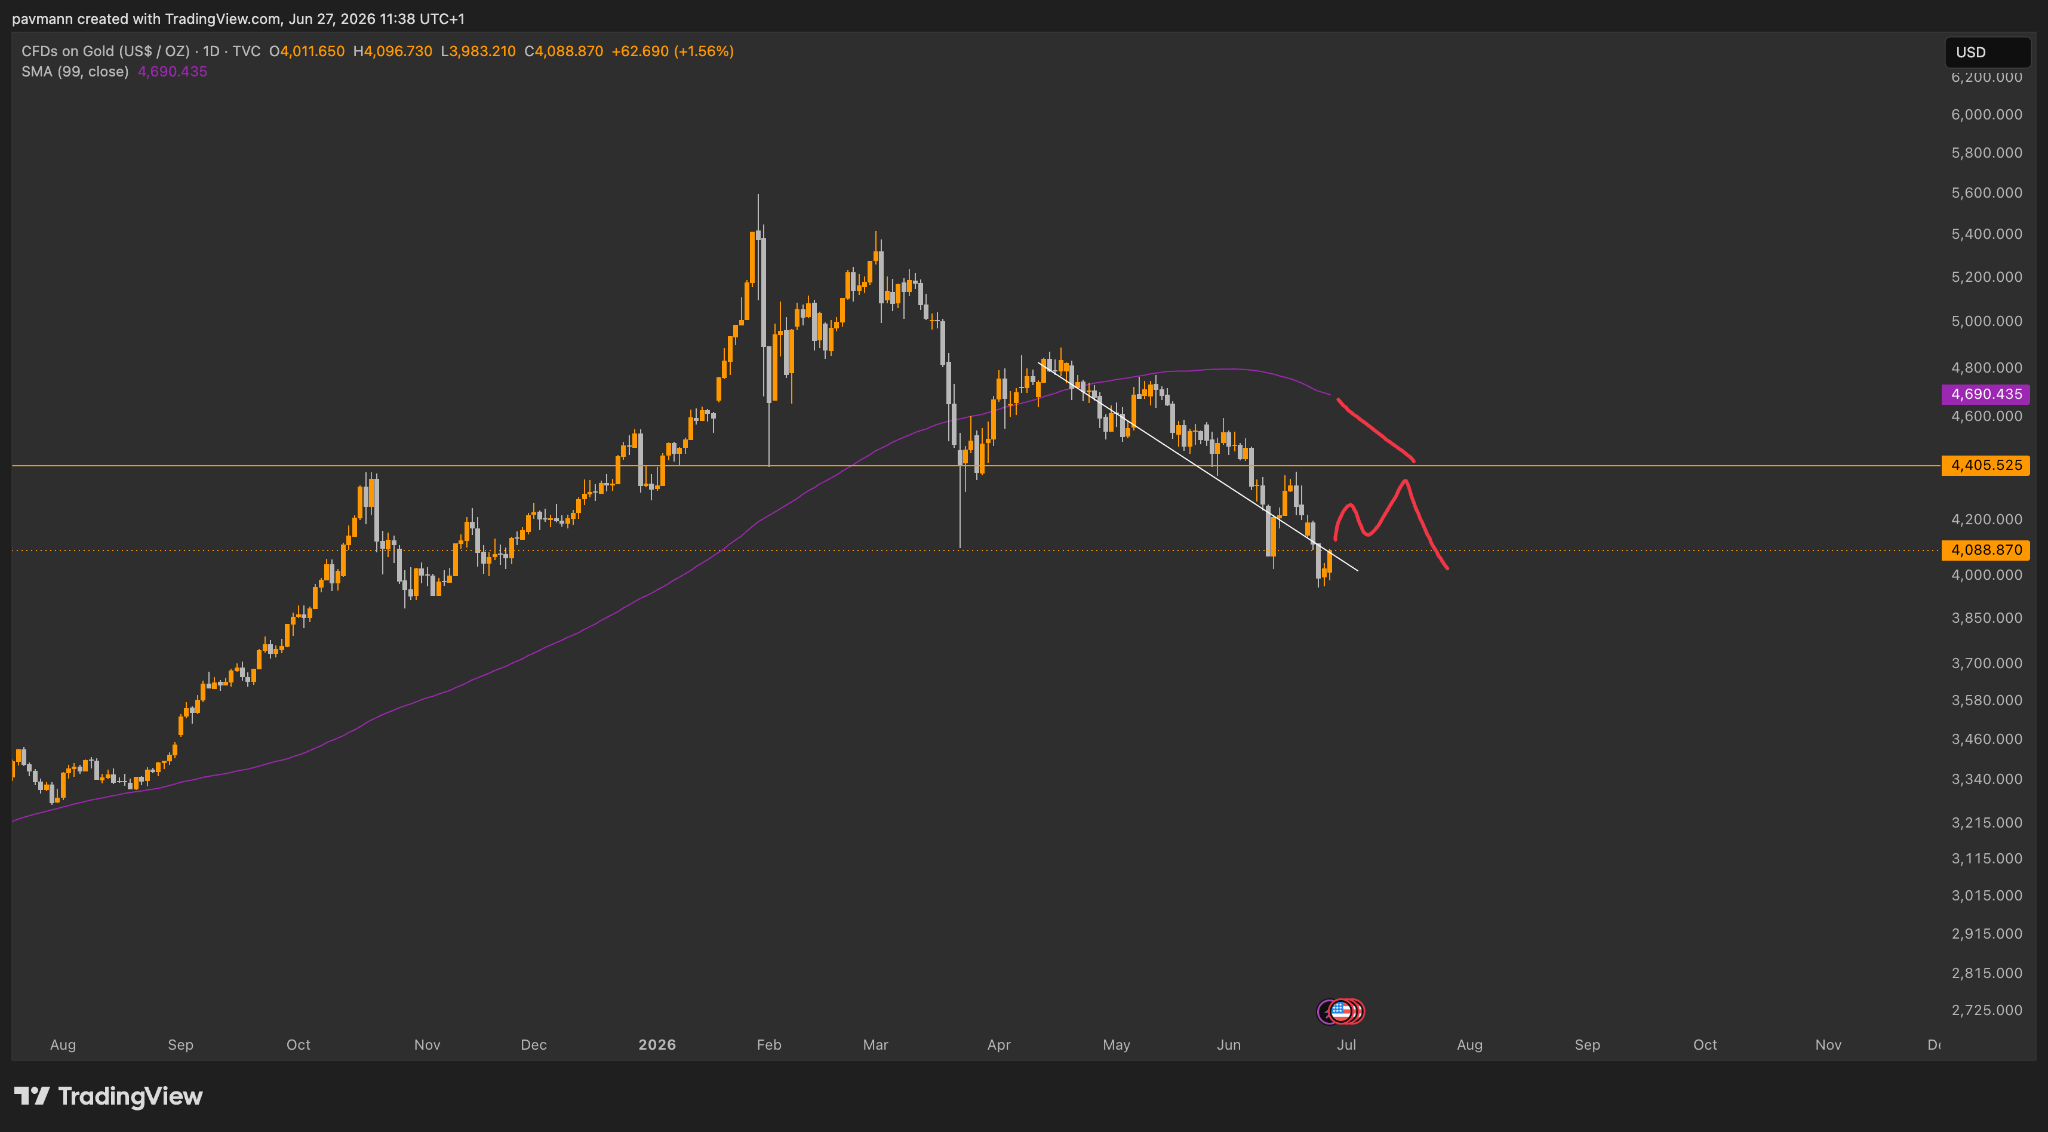
I’m not entirely sure how I feel about gold right now, but I do think there’s one area on the chart that will tell us a lot about what the next six months of price action looks like.
If gold rallies up into this resistance zone, where the orange line and the 99 SMA on the daily converge, that’s where things get really interesting. The 99 SMA on the daily gold chart has been a massive area of inflection historically, and when you combine that with the overhead resistance sitting right at the same level, you’ve got a confluence that’s hard to ignore.
For me personally, if we get that rally up into that zone and price starts to show signs of struggling, that’s a good risk to reward short. I’m not forcing anything here, and I want to see how price actually reacts when it gets there before pulling the trigger. But that’s the area I’m watching, and I think the reaction to it will go a long way in telling us which direction gold is heading for the rest of the year.
LINKS:
This newsletter is free because we love sharing our insights with the community. If you enjoy it and find value in our work, consider supporting Pav’s and Will’s Beer/Coffee Fund by donating $XRP to our newsletter donation wallet below. Cheers!
$XRP donation wallet: r3qf2nALyhFwC46QqZ5gJHpF3cjr5gRcoV
Trade XRP Memes here:
https://firstledger.net/?ref=6NRu4StwrImq
Trade on MEXC: https://www.mexc.com/register?inviteCode=mexc-1etb1
Trade on WEEX using this link: https://www.weex.com/login?from=https%3A%2F%2Fwww.weex.com%2FnewbieActivities%3Fid%3D520%26type%3DBEGINNER_TASK%26vipCode%3Duspf
Trading Different (Liquidity Map) - https://t.co/3ks3QMT5VJ?ssr=true
No posts
Comments
Nothing yet. Say the first thing.
Sign in to join the conversation.