
The content below represents the personal views and opinions of the authors. It should not be considered as investment or financial advice.
I think an important place to start this week’s newsletter is by touching on the MOU that was signed between the US and Iran regarding a 60 day ceasefire and the reopening of the Strait of Hormuz.
Now, since that agreement was signed on Wednesday, there has been the usual back and forth. There have been claims and counterclaims, and reports that elements of the agreement were effectively violated following Israeli actions in Lebanon. As always with situations like this, there is going to be political posturing and disagreement between nations that are still fundamentally at odds with one another. But for me, the important part is the market reaction.
Or more specifically, the lack of one.
Even with the signing of the agreement, the subsequent uncertainty, and the constant flip-flopping around the situation, we have not really seen oil move materially higher. That is something I have been discussing for quite a while now.
I still think oil probably has room for a relief rally, perhaps back towards the $83 area, before potentially continuing lower. But if you think back to what I have been saying for months in this newsletter, the core view has remained the same.
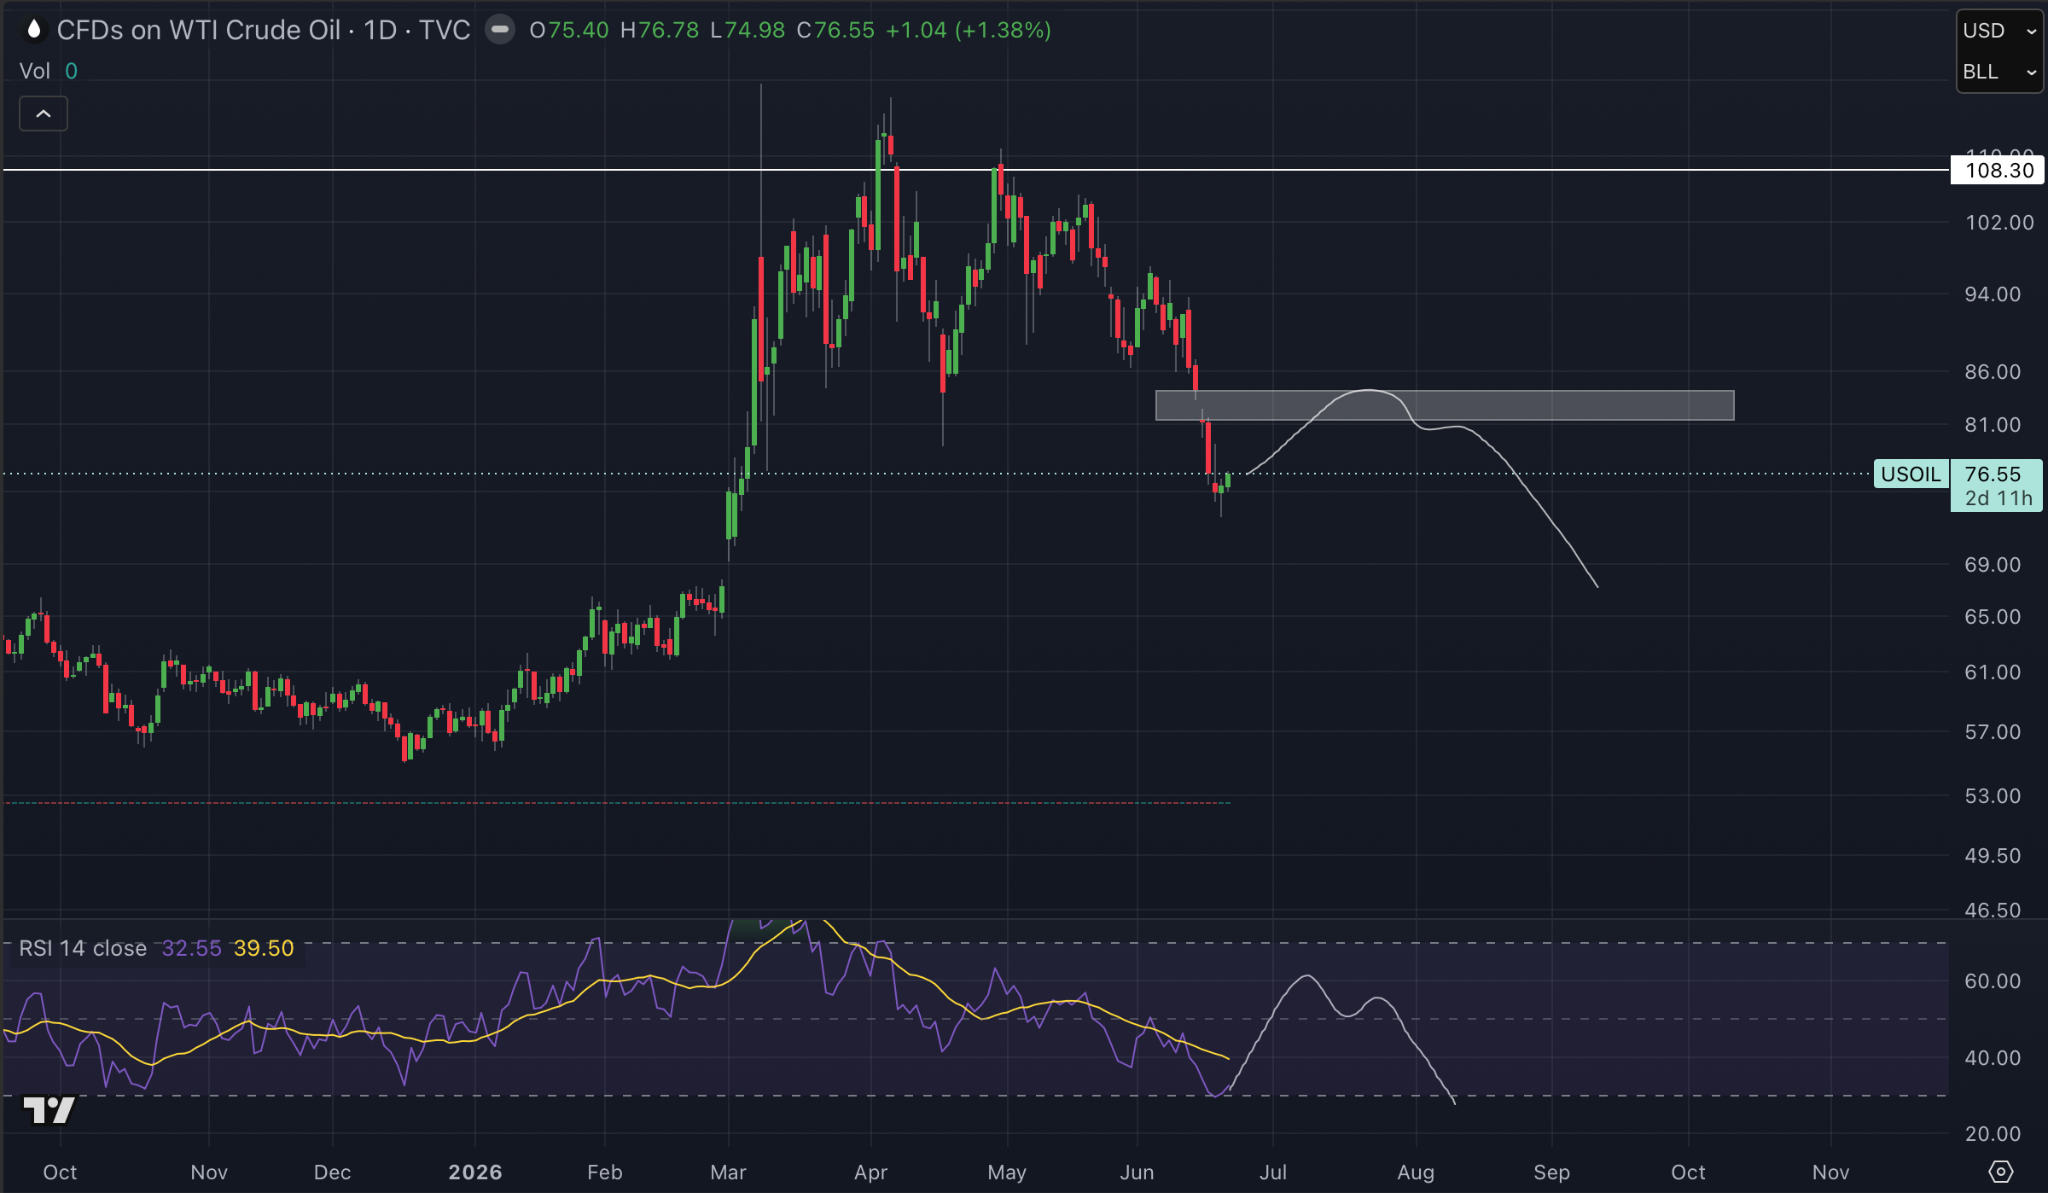
I thought oil would come down. I repeatedly said that $108 was the line in the sand, and that from there oil would either be brought lower naturally or brought lower artificially.
My argument has always been that this was primarily a supply side issue, and so far that appears to be what the market is telling us. Oil now finds itself trading around $76 per barrel, significantly below the highs we were discussing just a few months ago.
And why is that important? Because it supports the broader framework I have been outlining for what could come next economically. It supports the idea that inflation pressures may continue to ease, and that gives policymakers more room to manoeuvre.
That brings us to the new Fed Chair, Kevin Warsh. A lot of people viewed his first speech as relatively hawkish, but what stood out to me was that he essentially avoided giving meaningful forward guidance. And while some people interpreted that negatively, I actually think it leaves him with maximum flexibility going forward. It gives him the ability to completely change his stance if conditions require it.
And that is exactly what I think happens as we move closer towards the midterms. The reason I believe Warsh was put into this position is because he is ultimately going to align with what the administration wants to achieve.
And my view has not changed.
I continue to think that the Trump administration wants stronger asset prices, stronger growth, and a generally risk-on environment heading into the political cycle ahead.
That is why, despite all of the doom and gloom that still exists across markets, I continue to believe we are setting up for what could be a surprisingly bullish environment for assets.
And specifically, for crypto.
So now that we have tried to neutralise some of the negative narratives around markets, let’s explore what this could mean for crypto.
What I want to do here is look at the Bitcoin lows. We have discussed this on YouTube this week, but I wanted to get it down on paper as well because I think it is an important discussion.
Specifically, I want to look at the similarities and differences between the current low and previous cycle lows.
A lot of people compare what we are seeing today to the 2022 cycle, which is completely fair. It is the most recent cycle, so it is naturally the one people remember most clearly.
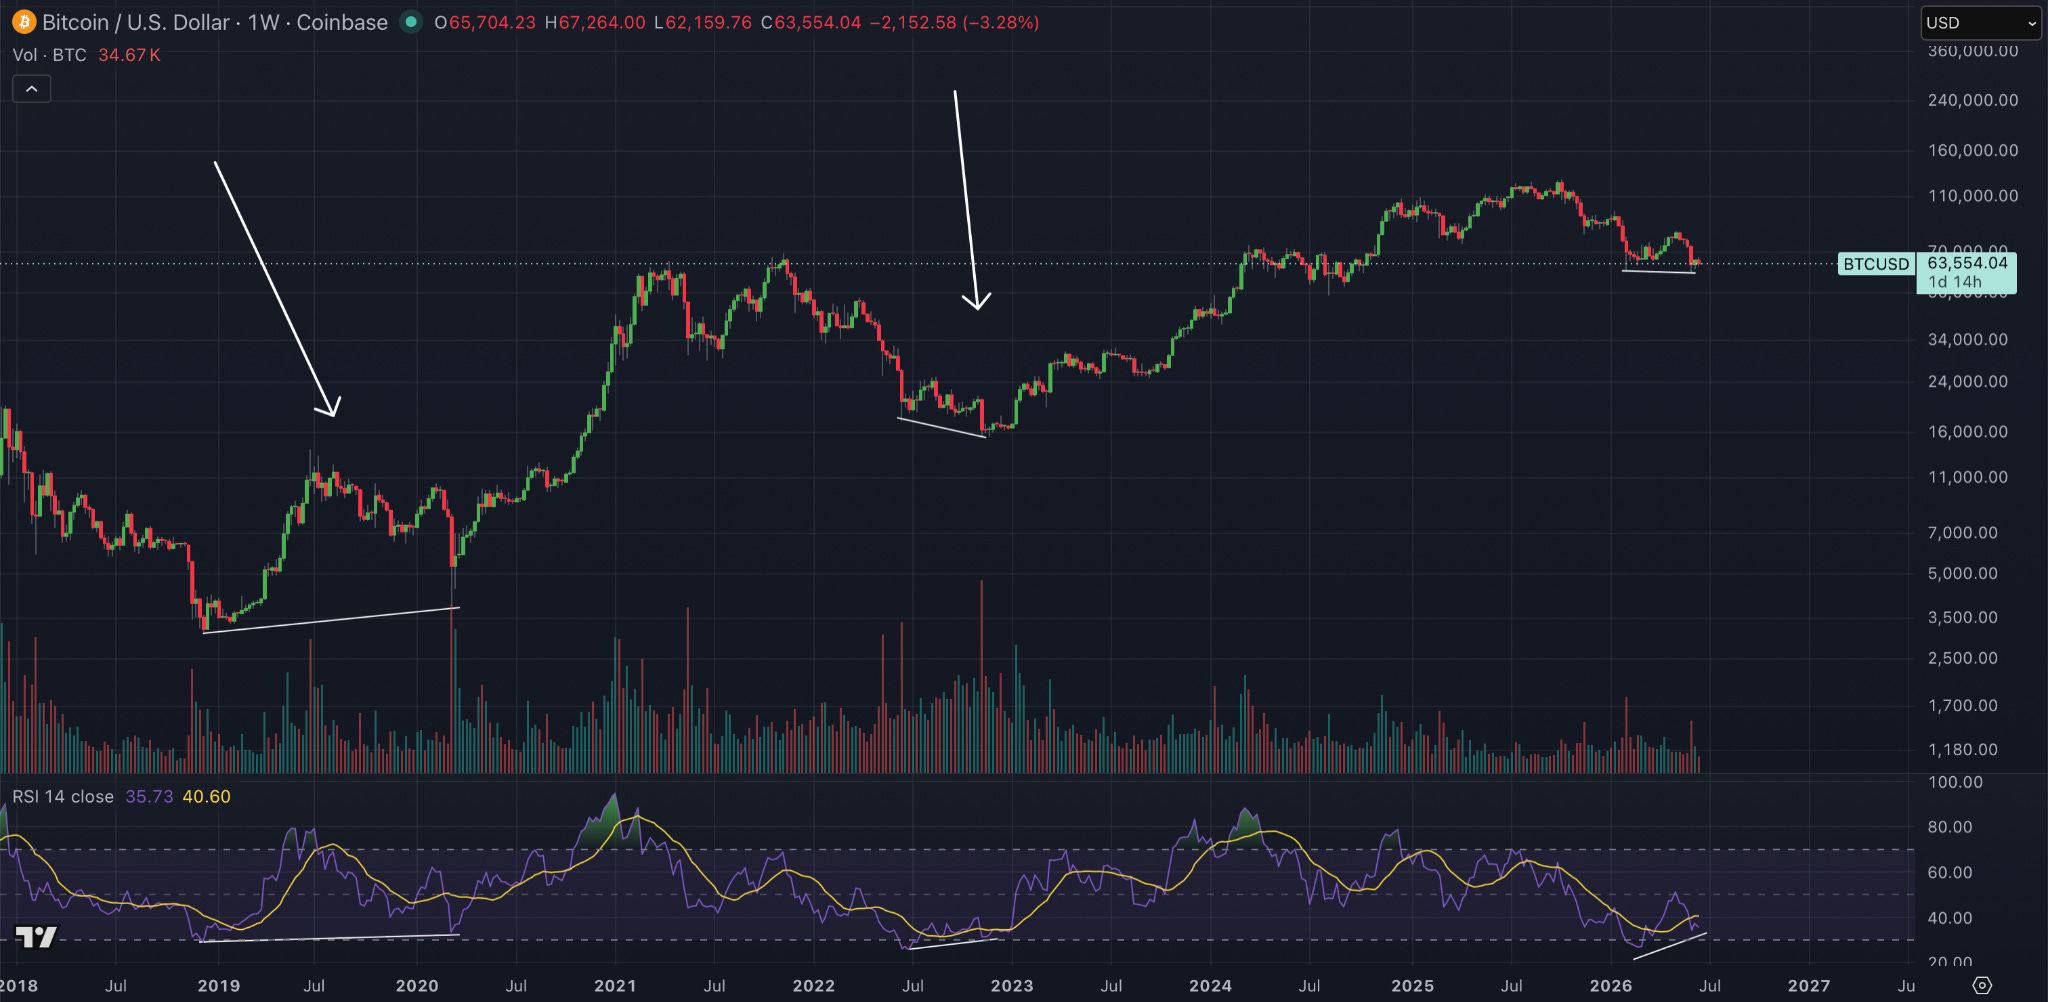
But one thing I think is obvious when you look across Bitcoin’s history is that there are different ways for Bitcoin to form a bottom. The 2018 bottom looked different to the 2022 bottom. However, there is one common theme. Every single time Bitcoin has reached the oversold area on the weekly RSI during a bear market, that has marked the lowest point in momentum for the cycle. Once Bitcoin has entered that oversold area, the RSI has never gone lower afterwards.
Now, in the 2022 cycle, it took roughly four months for the market to fully work out that low. We eventually went on to make a lower low in price, but importantly, we made a higher low on the RSI. That was a classic bullish divergence.
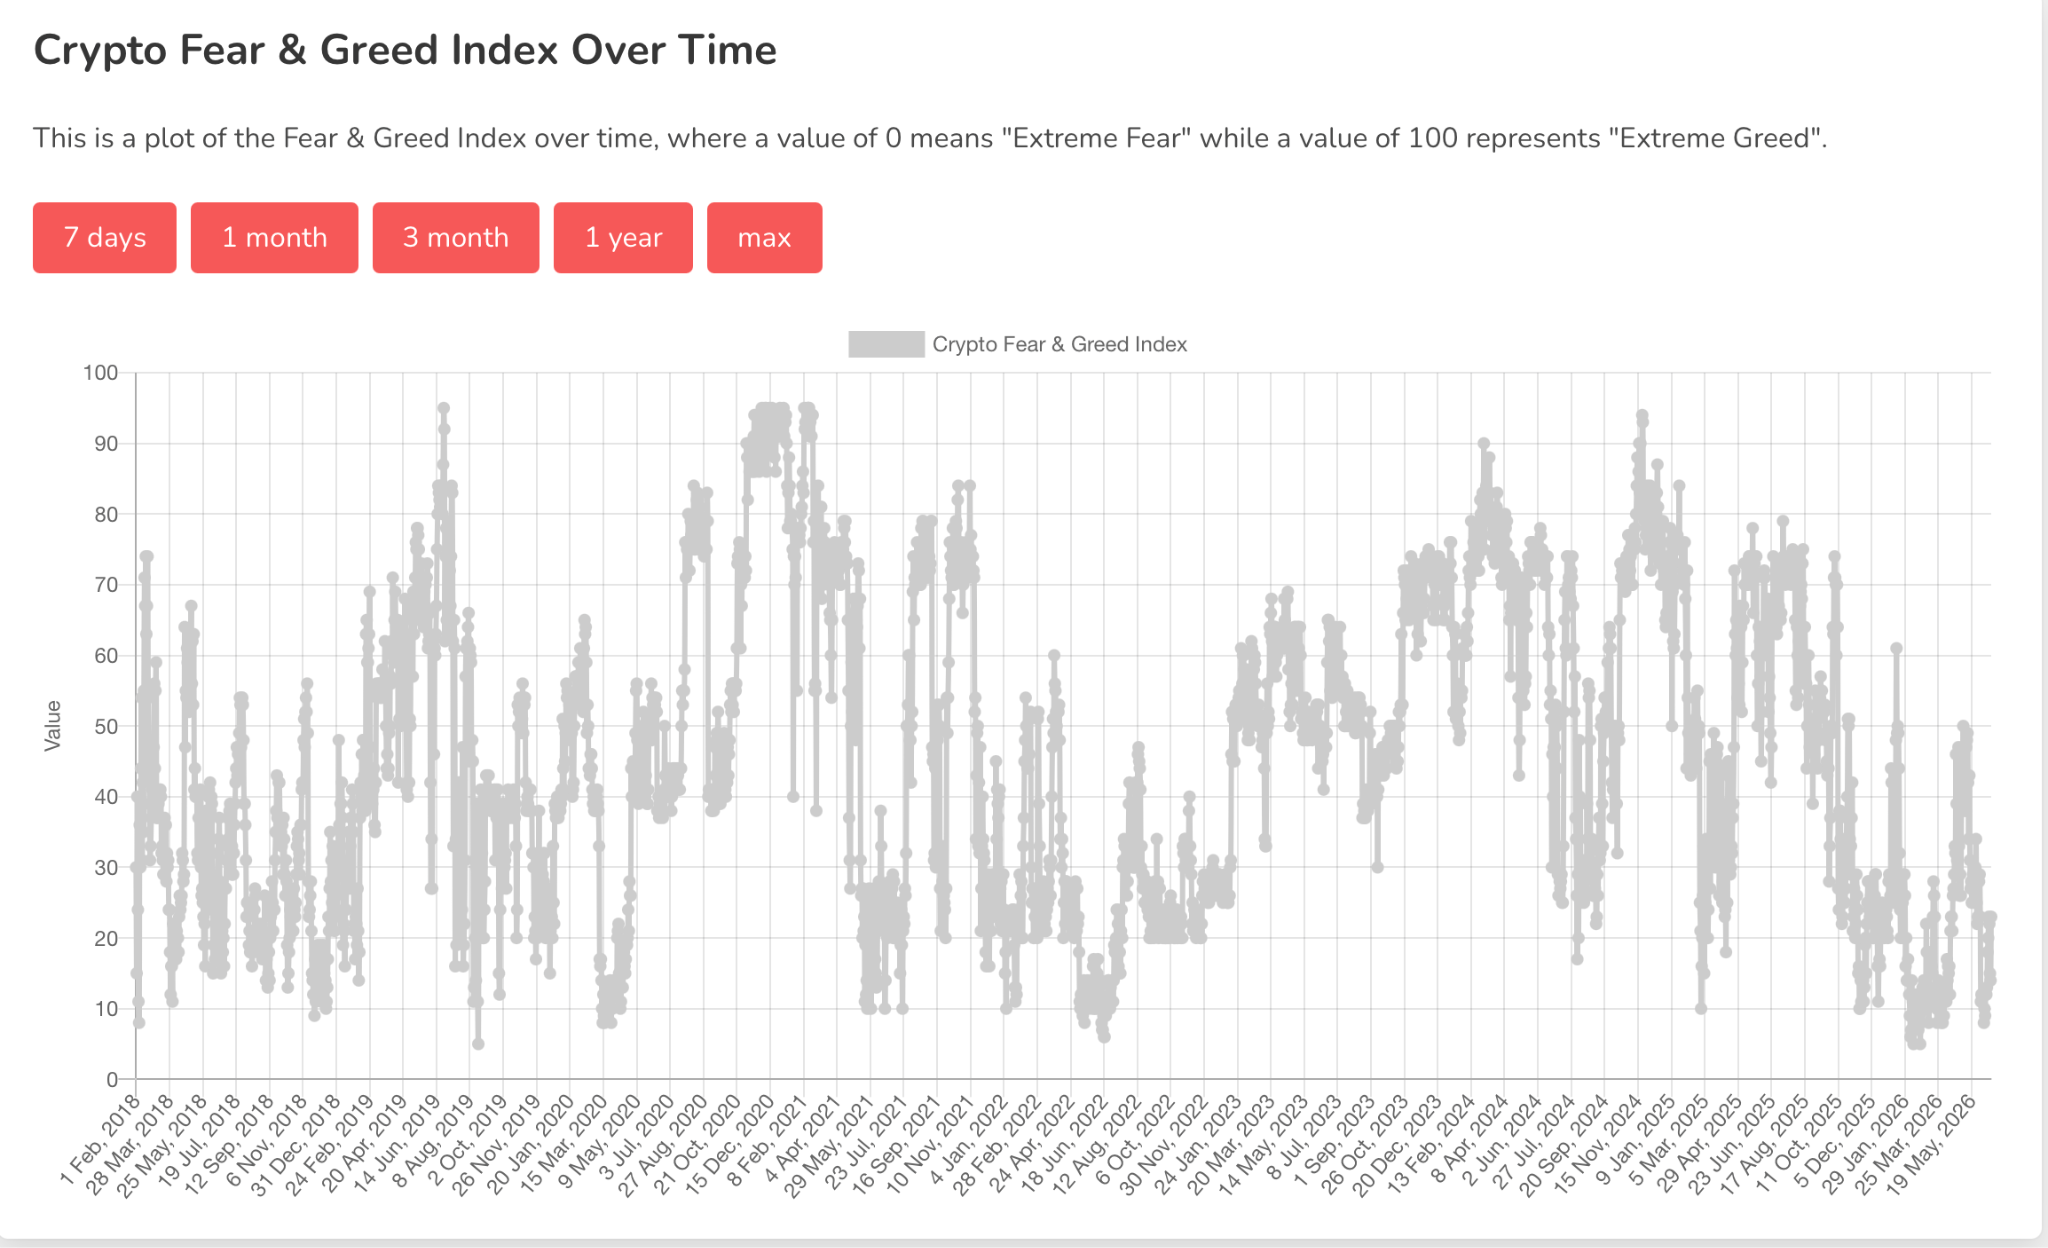
You can also see this reflected in the Fear and Greed Index. The true emotional low came in June 2022. Then, even when Bitcoin went on to make a lower low during the FTX collapse in October and November, Fear and Greed never made a new low. Sentiment had already bottomed.
Now compare that to the 2018-2019 bear market.
In that cycle, we chopped around the lows for roughly three months before breaking out aggressively. Then, around a year later, after rallying nearly 300%, we had the COVID-19 crash. But even during the COVID crash, Bitcoin never returned to the oversold weekly RSI area. In fact, we did not revisit the same depths in either momentum or price.
Now let’s bring that discussion forward to today. In the current cycle, we formed a low in March after pushing deeply into the oversold area on the weekly RSI. In fact, we went deeper than the 2018 bear market and reached levels very similar to those seen in 2022.
Then, two weeks ago, we wicked below the February low, sweeping the liquidity that sat beneath it. At the same time, we formed a higher low on the RSI.
In other words, we created what would be a weekly bullish divergence, assuming this level continues to hold. And I think that is a very fair discussion to have. There is still a huge amount of negative sentiment dominating the conversation right now. Everywhere you look there are reasons to be bearish.
But if you step back and look purely at the technical structure, there is a legitimate argument that we may already be looking at a macro bottom.
Now, that does not mean we cannot continue chopping around these levels for a few more months. It also does not mean we cannot revisit the lows again, as we did in 2022. But on the other side of the argument, if you compare today’s setup to 2018, there is also a very real possibility that the low is already in. The reason I bring all of this up is because, regardless of which scenario plays out, this is beginning to look like a deep value area.
If you are a strict four-year cycle theorist, then you could argue there are still three or four months left before the final cycle low is confirmed. But if you are looking at this purely from a technical perspective, there is absolutely a case to be made that the lows are already behind us.
And if that turns out to be true, then this period will likely be remembered as a fantastic opportunity to accumulate crypto assets generally.
Personally, I would not be accumulating Bitcoin here, and I will explain why in a moment. But I wanted to first lay out the structural similarities and differences between previous cycle lows and the potential bottoming formation that we are seeing today.
So I said above that I would not be buying Bitcoin specifically right here, and why is that? Well, if we look at the ETH/BTC chart, which I think is one of the most attractive charts in crypto right now, there is a pretty compelling discussion to be had.
Especially when you consider that the amount of FUD surrounding Ethereum on my timeline right now is the highest I can honestly remember seeing. The criticism is coming from every direction. People are questioning the Ethereum Foundation. People are saying there is not enough funding to continue development. Others are claiming Ethereum has failed entirely. And then you have long term holders who have held for years, some of them seven years or more, who are underwater and questioning whether they made the right decision.
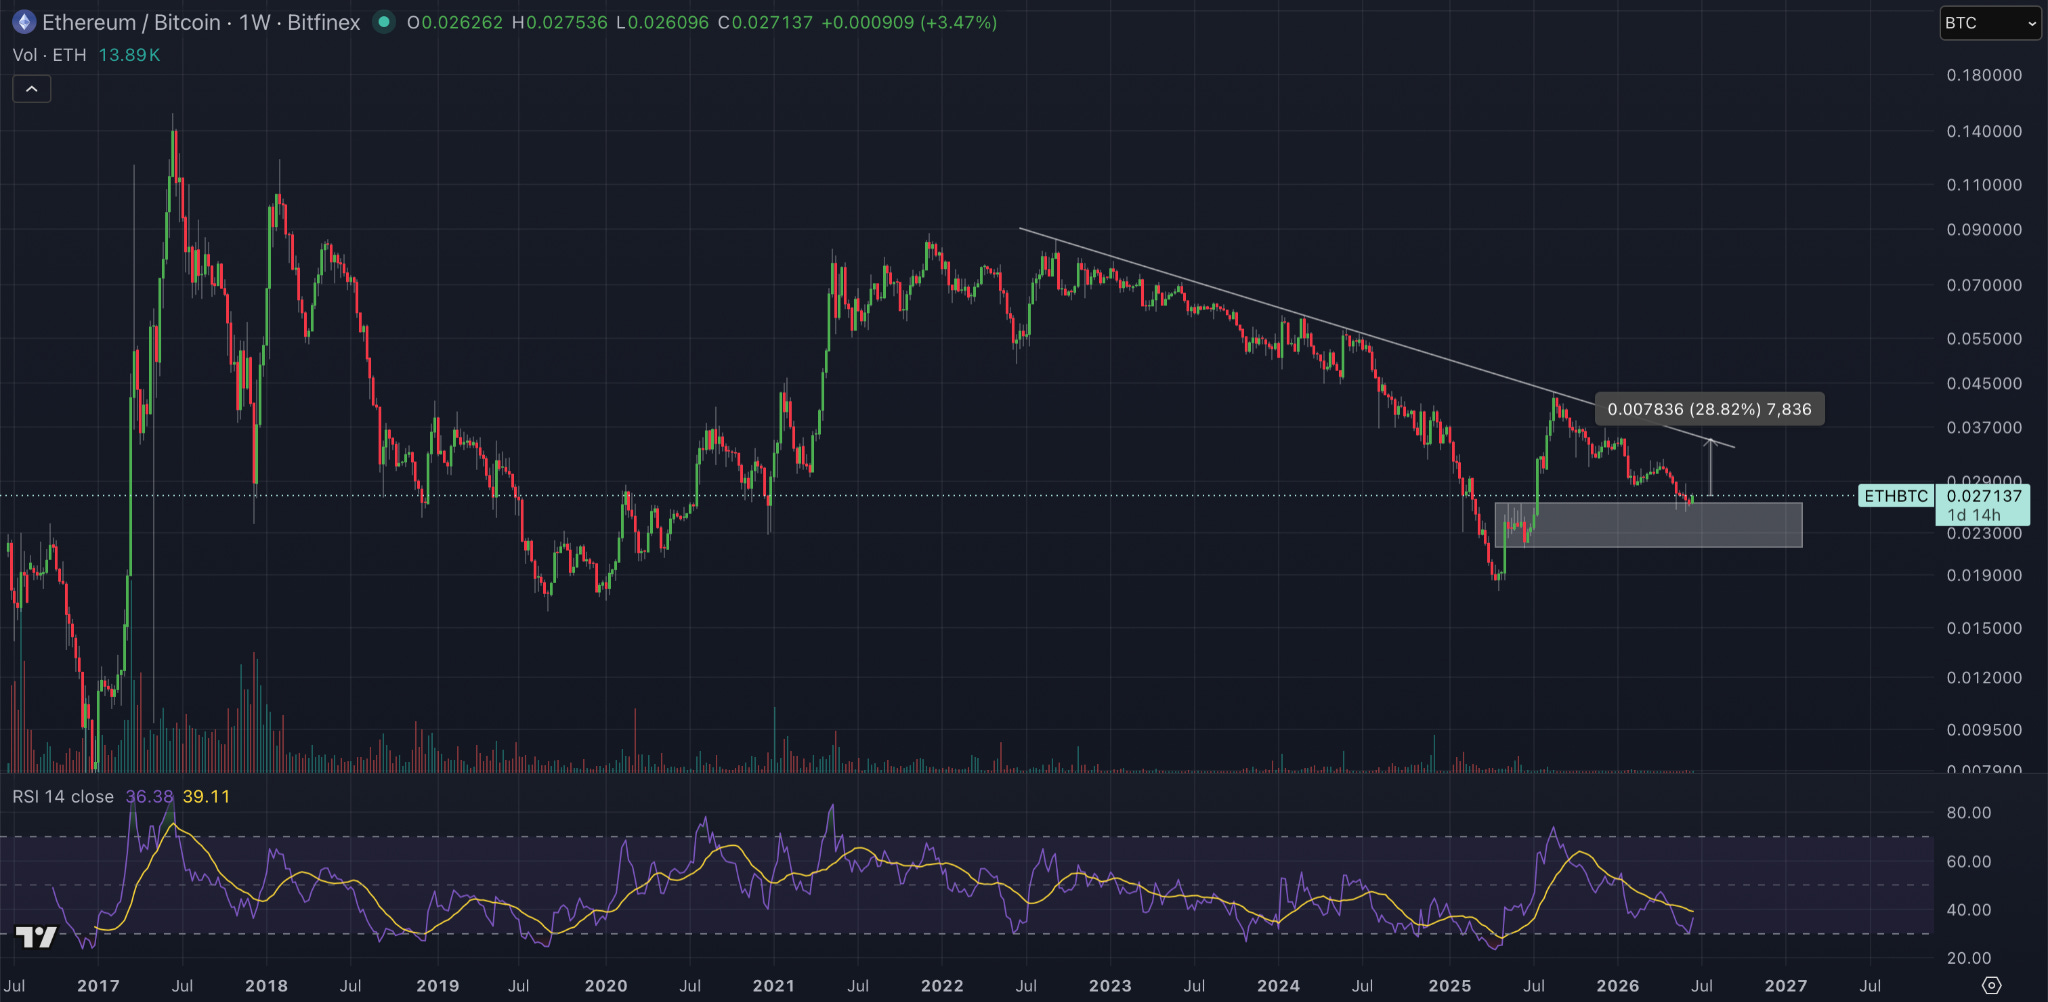
Those sorts of moments are often capitulation moments. Now, I am not saying this is the exact low for Ethereum. There is definitely a technical argument that it could still go lower. But when I look at the ETH/BTC chart, what I see is a very clear backtest of a major order block. At the same time, we are approaching the oversold area on the weekly RSI once again, which has historically been an area where ETH has at least managed to produce a meaningful bounce against Bitcoin.
What I am looking at here is the possibility that Ethereum could outperform Bitcoin by around 28% in the short to medium term.
And because of that, if I were choosing between accumulating Bitcoin or accumulating Ethereum at this exact moment, I would personally choose Ethereum. The logic is actually quite similar to what happened with XRP during the SEC lawsuit. Back then, sentiment around XRP was awful. Everyone had given up on it. The FUD was relentless.
And if you look back now, it was actually one of the better accumulation periods in XRP’s recent history. That is the comparison I keep coming back to with Ethereum.
You have an asset that many people have completely written off, a market structure that is approaching historically significant levels, and a chart that suggests there may be meaningful relative upside against Bitcoin if sentiment begins to shift.
When I combine the sentiment picture with the technical setup on ETH/BTC, it creates what I think is a fairly attractive accumulation area.
Whether you like Ethereum as an asset or not is a separate discussion.
But from a risk versus reward perspective, I think there is a reasonable argument that it makes sense here.Continuing that point, I want to touch again on TOTAL2 because structurally it is showing almost exactly what we would want to see if a major low were forming.
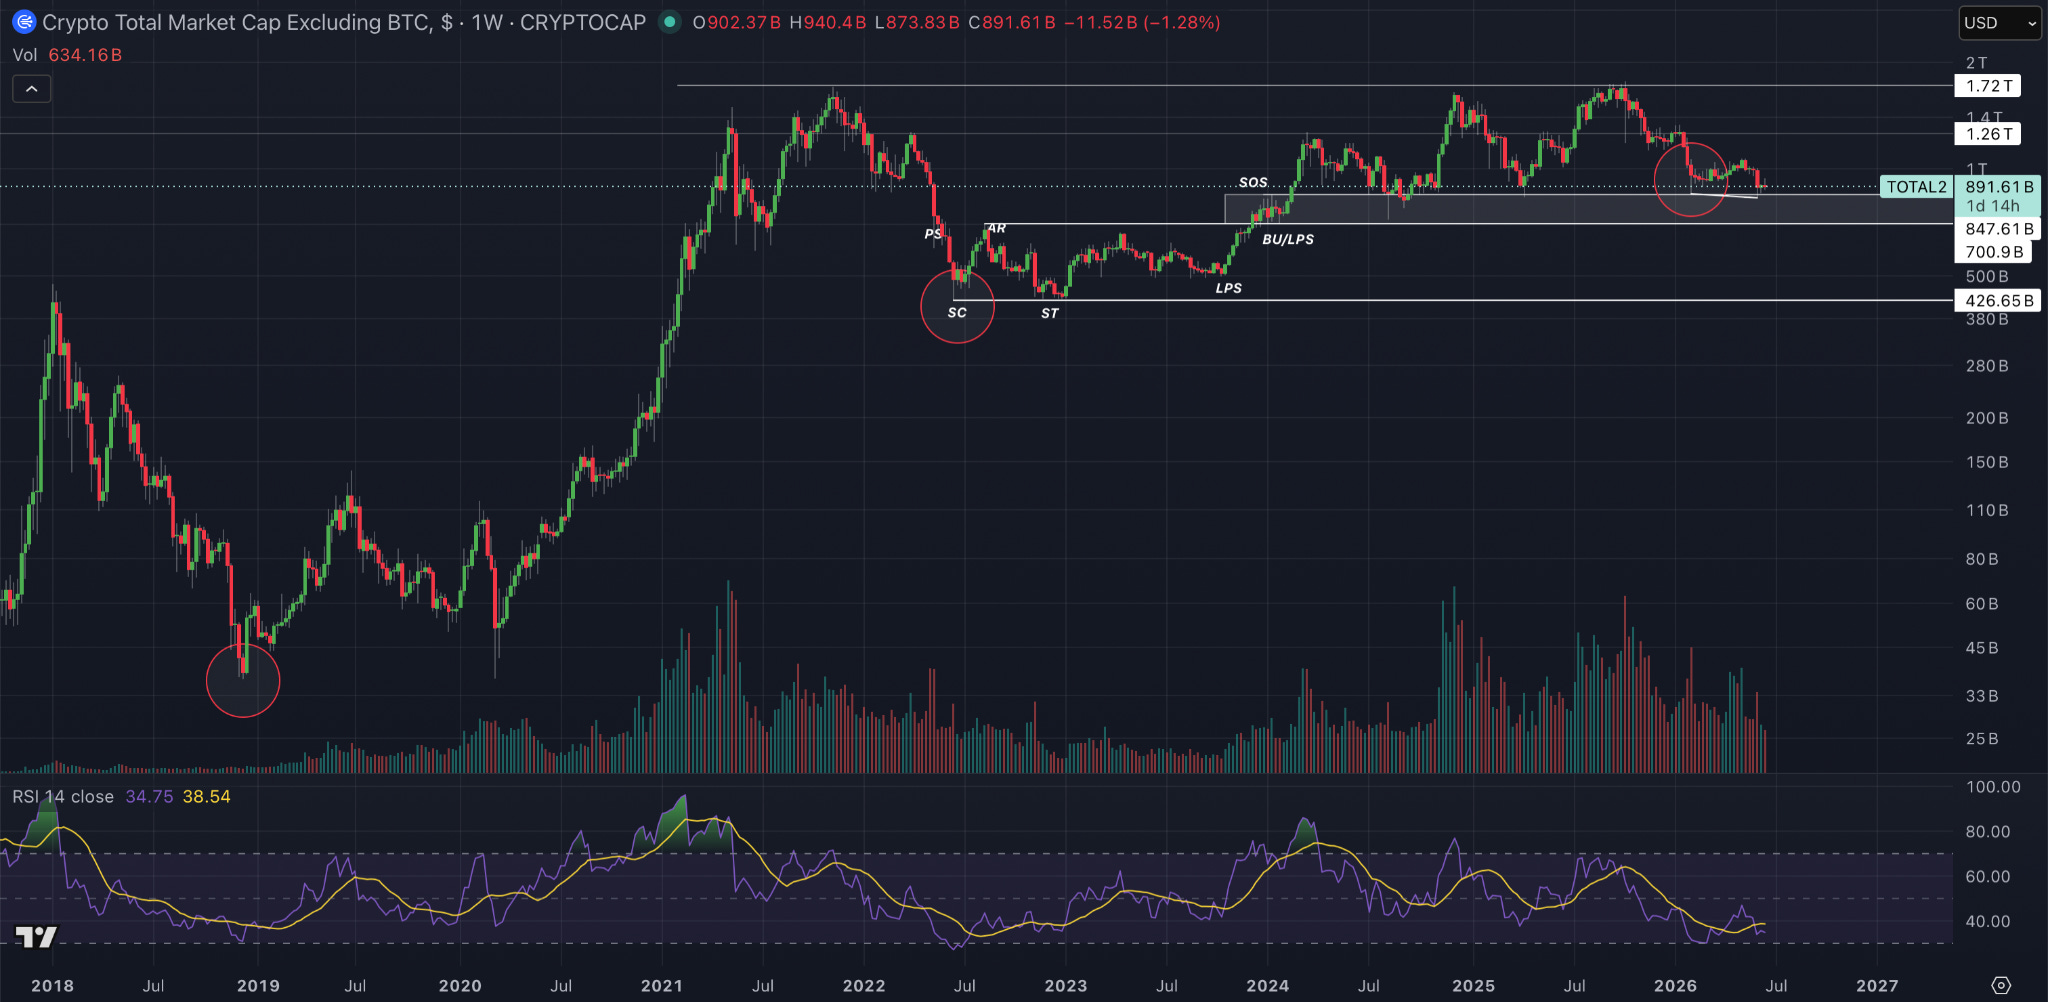
As we’ve discussed throughout this year, all of the technical conditions have now been met. We touched the oversold area on the weekly RSI. We then came back and retested that area. And now we have formed a higher low on the RSI.
That exact sequence has occurred in the previous bear markets as well. In fact, it has happened in two out of two prior bear market bottoms, and now we have the same setup developing again.
Does that guarantee this is the low? Of course not. Nothing in markets is guaranteed. But what I can say is that the technical conditions we were looking for back in February have now been fulfilled. At the time, I said that although touching the oversold area often marks the low in momentum, there was still a possibility that we would need to come back and retest that level before the market could move higher.
Well, now we have done exactly that. So the big question becomes whether time is the missing ingredient. In other words, does the four year cycle still matter enough that we need additional months of consolidation before moving higher? Or are the technical conditions alone enough this time?
I genuinely do not know the answer. But what I do know is that if you remove the time component and look purely at structure, momentum, and historical precedent, then TOTAL2 is presenting one of the strongest bottoming arguments anywhere in crypto right now.
And that is why I keep coming back to the same conclusion.
If I am looking to accumulate something in this environment, I would rather be looking at quality altcoins than Bitcoin. Not because I dislike Bitcoin, but because the technical structure across TOTAL2 is, in my opinion, one of the cleanest and most compelling setups currently available. It is genuinely one of my favourite charts in the entire market right now.
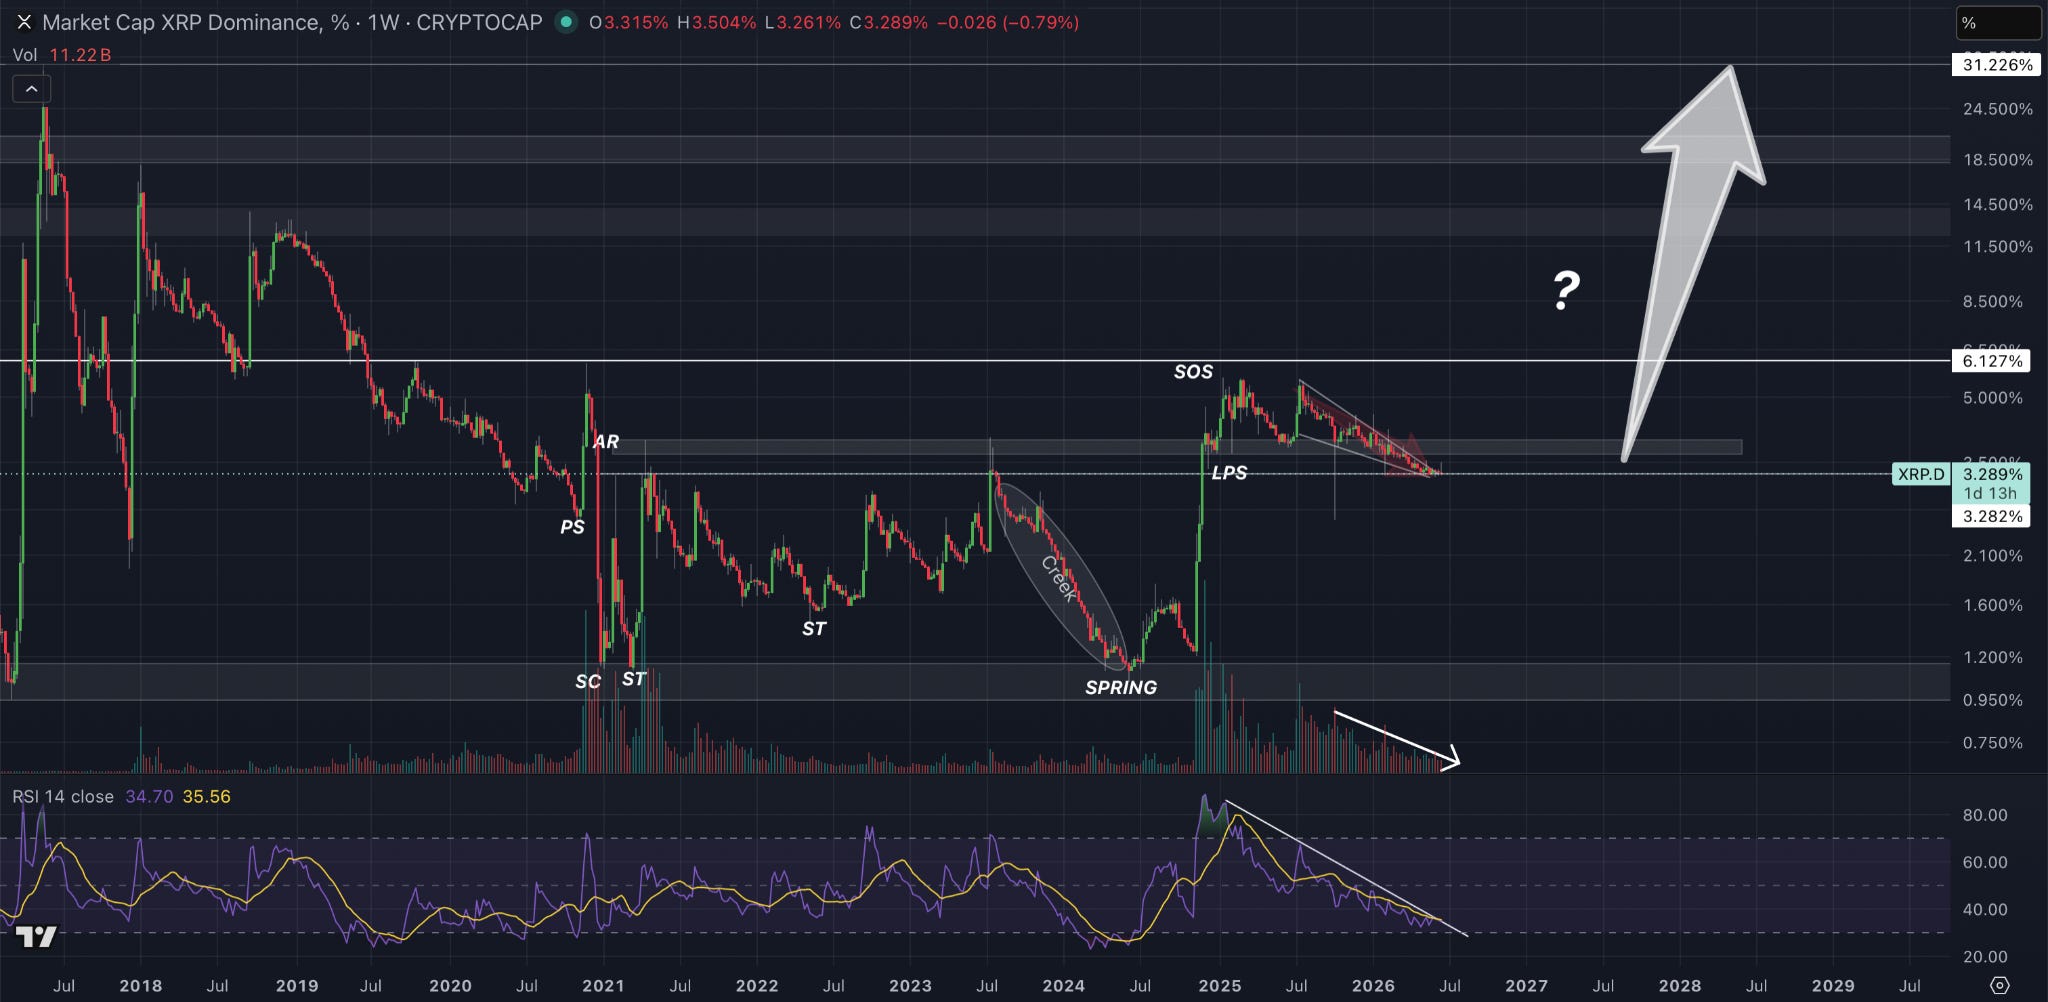
Another chart we’ve been discussing a lot in this newsletter is XRP dominance, which, on the weekly timeframe, remains at what I would describe as a decision point.
The RSI is extremely compressed and coiled up, looking like it is preparing for a significant move. Volume has been decreasing as price has drifted lower into what was previous resistance and is now attempting to hold that same level as support.
Last week, it looked like we might finally get the breakout. Since then, however, we have retraced that move. Honestly, XRP is an extremely frustrating chart right now.Everything looks like it is building towards a move, but the market keeps delaying the resolution.
I have also continued to discuss the possibility that XRP could come back and sweep the liquidity sitting around the $1 level on the daily timeframe.
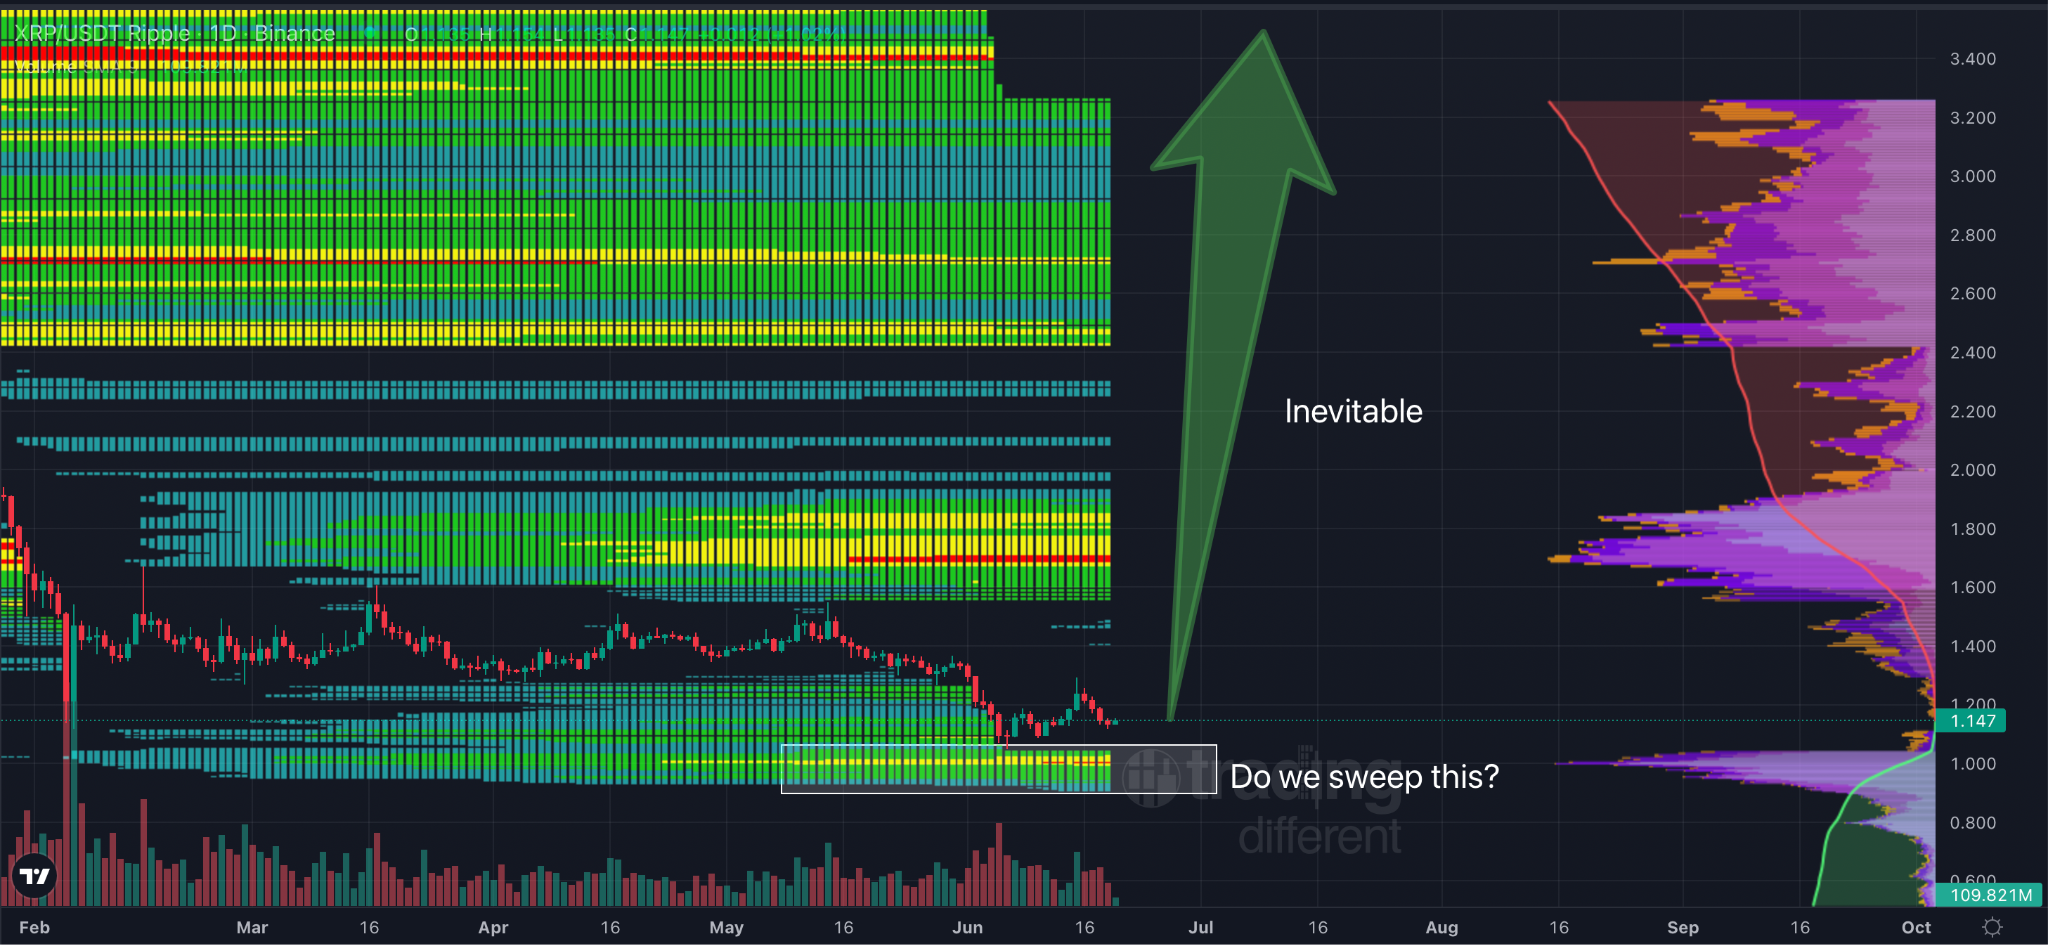
Does it have to do that? No. But these types of moves are common. Markets often form a range, sweep the lows to remove liquidity and shake out participants, and then move higher afterwards. That does not mean it will happen here, but it is a possibility that remains on the table.
The reality is that we are all waiting for the same thing. We are waiting for the move. And I still think that move is coming.When I look at the XRP chart and the XRP dominance chart together, I still think they look attractive, especially when compared to Bitcoin from a risk versus reward perspective.
The upside potential for XRP remains enormous.
And when you combine that with the broader narrative developing around crypto in the United States, it becomes even more interesting.
We have already seen the Trump administration become increasingly comfortable with taking strategic positions in emerging technologies. For example, we have seen involvement around AI companies and discussions around the government taking more active roles in shaping strategic industries.
My view is that this approach will eventually extend into crypto as well.
Especially as we move towards 2027, with tokenisation initiatives beginning to go live, the DTCC preparing to bring assets on chain, and crypto increasingly becoming part of the legacy financial system rather than existing outside of it.
If that is the direction we are heading, then I think projects that are positioned around utility, payments, settlement, custody, and tokenisation stand to benefit significantly.
And in that world, I think Ripple and XRP sit very high on the list.
I have said for years that if we ever truly enter the utility phase of crypto, the phase we have all been speculating about for most of my time in this industry, then XRP should be one of the major beneficiaries.
What is interesting to me is that while people talk about that possibility, I do not think they have actually priced it in. We speculate on it. We debate it. We argue about it on social media. But I do not think the market has genuinely priced in what a successful utility-driven future for XRP could look like.
And that is why, despite all the frustration, despite the range, and despite the constant delays, I continue to find the setup incredibly compelling.
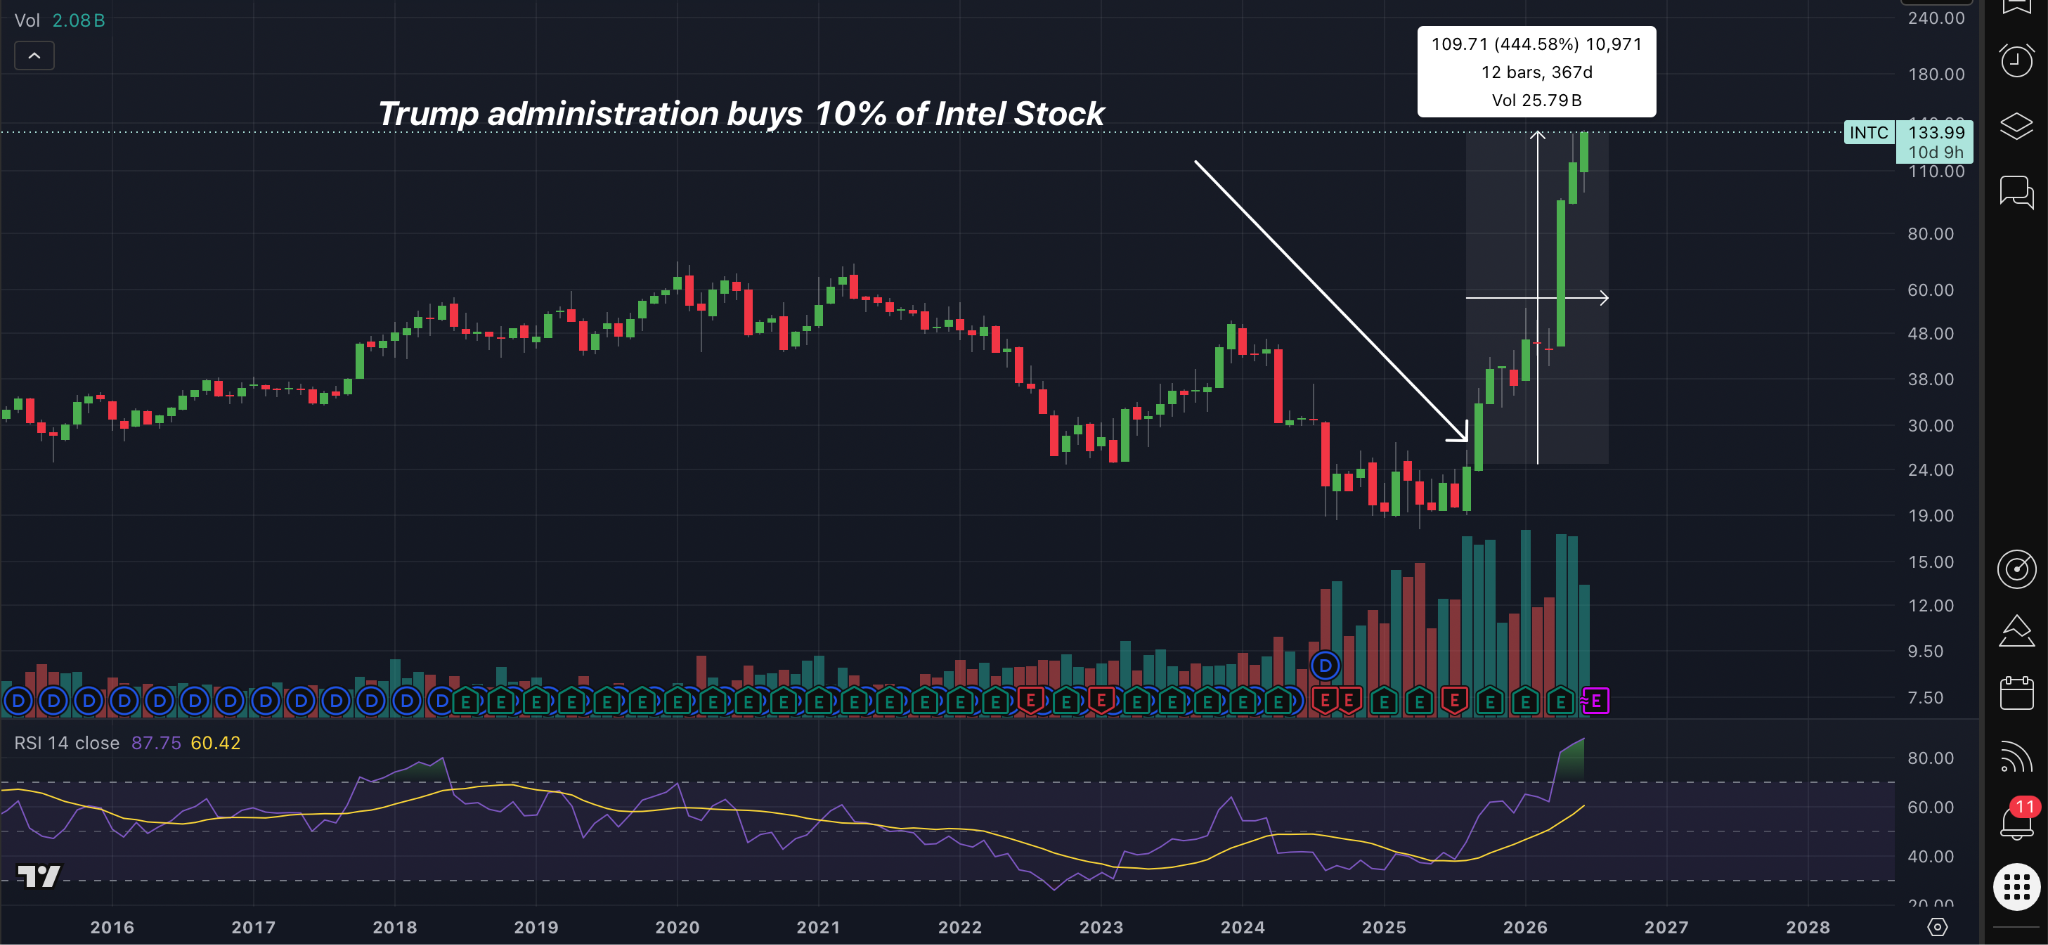
Just FYI, this is where Trump’s administration bought Intel stock. Don’t think that can’t / won’t happen to a crypto company….
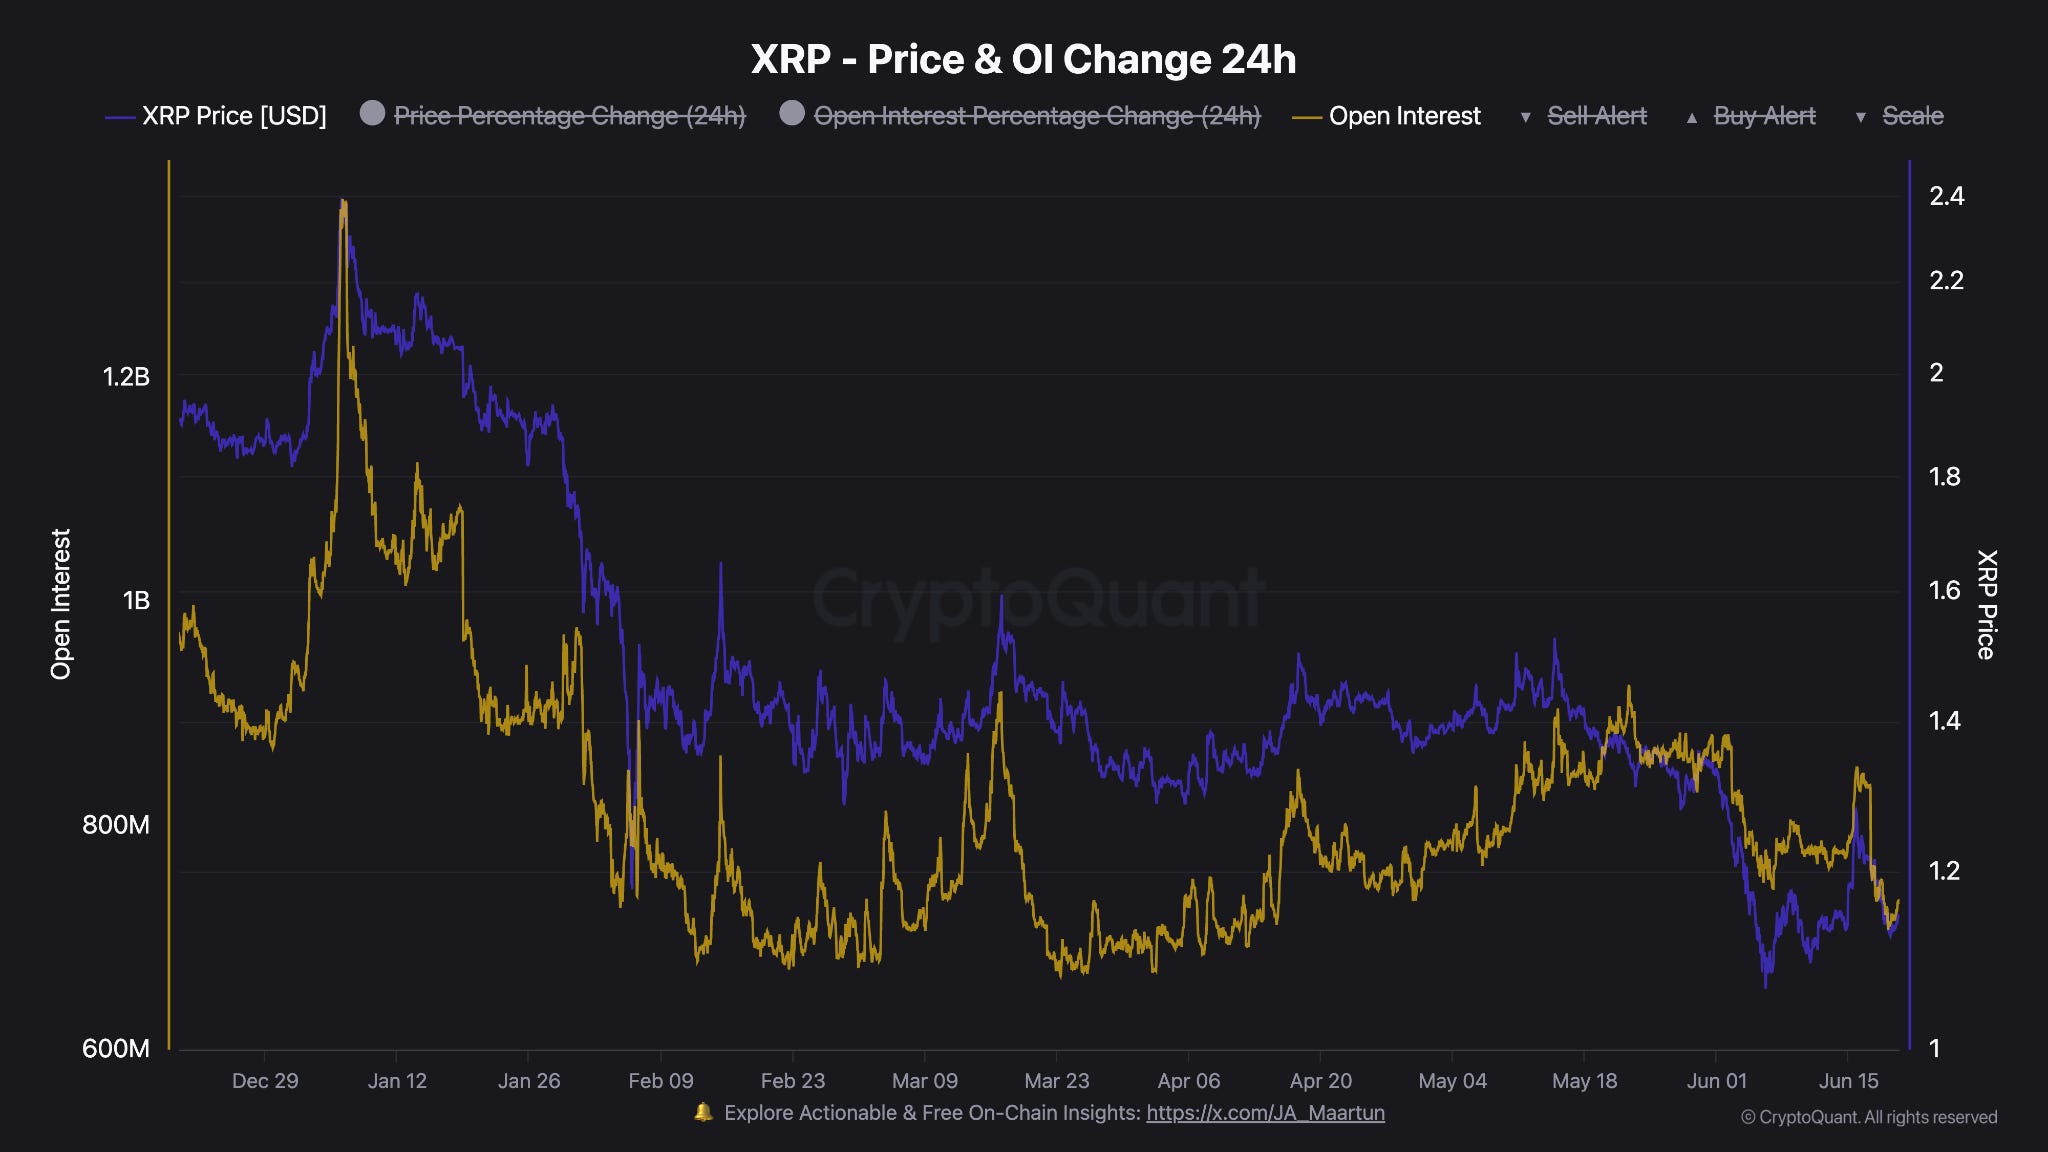
Seeing as this is our 200th edition, I thought there was only one token worth talking about. You already know which one… XRP, and more specifically I want to talk about the open interest.
Cast your mind back to the end of last year and the very start of this one. Open interest on XRP went through the roof. And it lined up almost perfectly with that explosive price action we saw at the time. Since then, it has gradually bled back down. Then in May, we saw OI start to creep back up again, only to be followed by another gradual flush from the middle of May right through to where we are now.
What is interesting is where it is landing. It is finding its way back toward what is starting to look like a base. A floor that keeps getting tested and keeps holding.
When I look at this alongside my broader thesis on Bitcoin, and the idea that we are somewhere near the bottom of this range whether that ultimately means $55,000 or not, XRP appears to be telling a similar story. The open interest structure is not screaming panic or looks like its about to flush again. It is quietly doing what bottoming looks like, resetting, stabilising, and building a base.
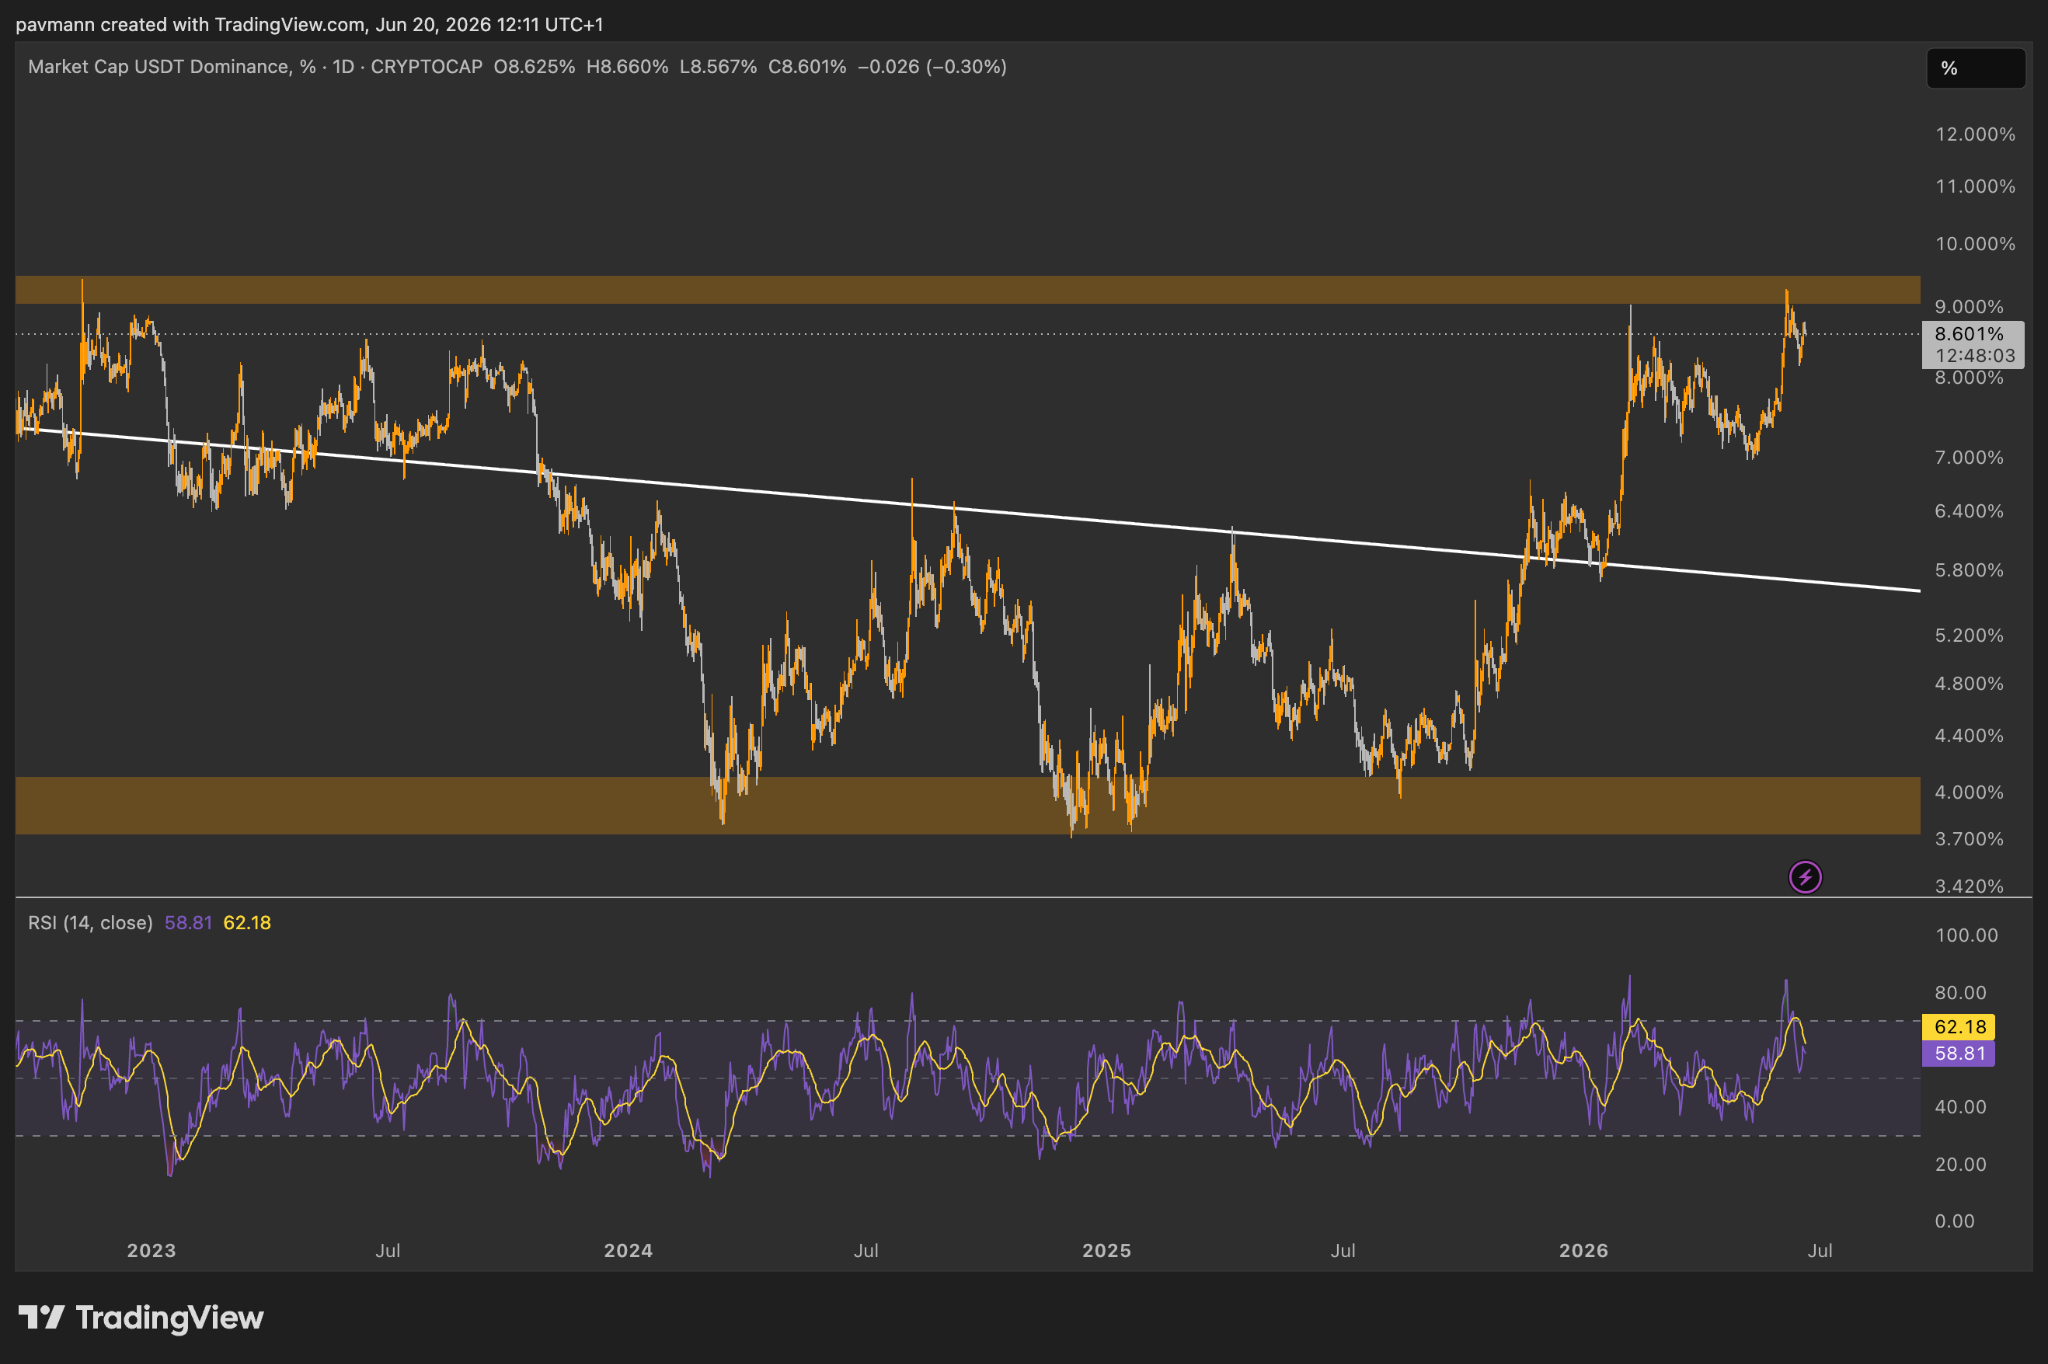
You guys know how much I love this chart. I keep coming back to it because, time and time again, it has done a good job of flagging when momentum is about to shift.
Cast your mind back to when Bitcoin first tapped 60K. That was the exact moment USDT dominance hit the top of its range. It bounced there, consolidated, and then pushed back up to test that same area once more. But now, when you look at where the RSI is sitting relative to the moving average, it is trading below it and riding underneath it. And the direction of travel is starting to look pretty clear. It looks like it wants to roll over here. My guess is at least the descending white trendline.
I am not calling it confirmed just yet, but this is absolutely a chart I will be watching closely over the coming weeks. If USDT dominance continues to lose ground here and that RSI stays suppressed below the moving average, it would suggest capital is beginning to move back out of stables and into risk assets. That is typically when things start to get interesting. One to keep on the radar.
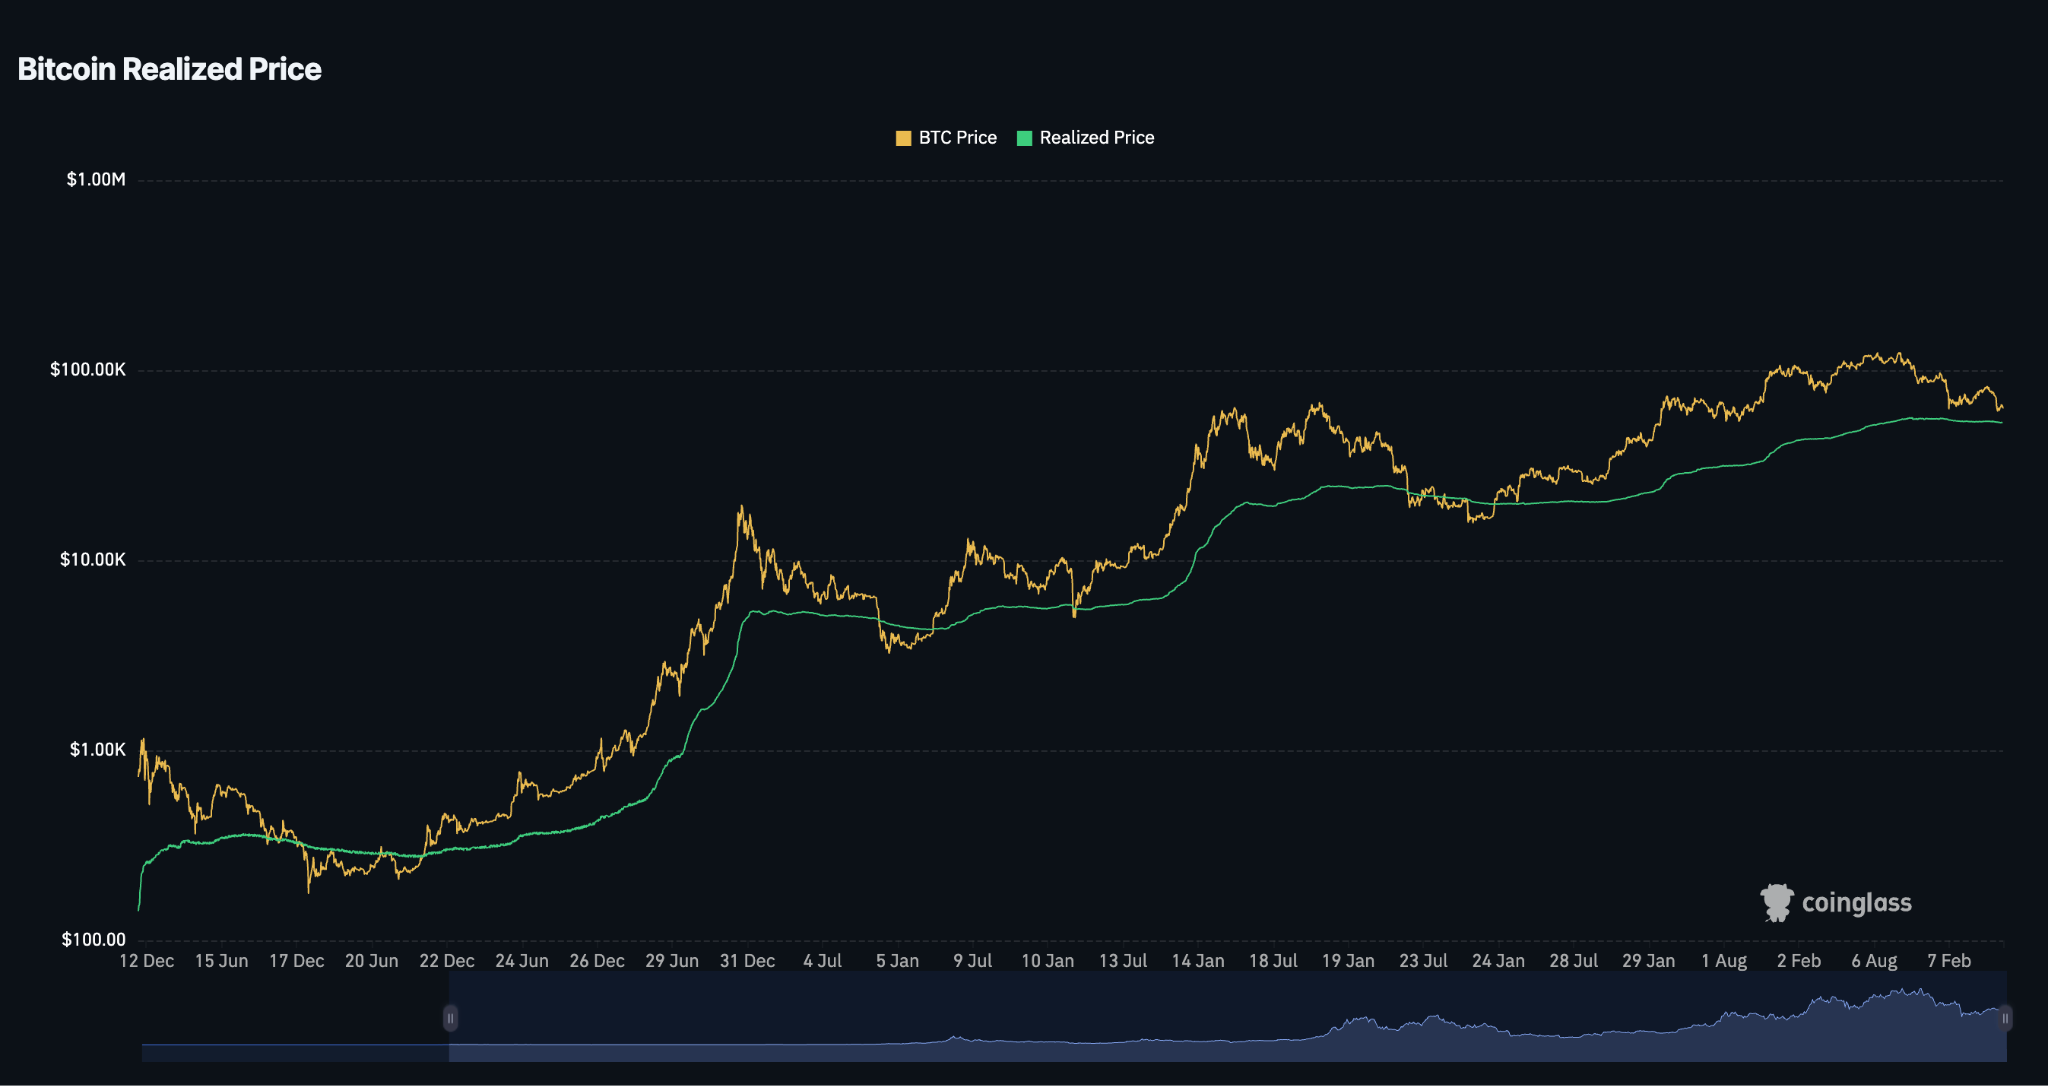
Now I want to be clear, none of what I am about to say is meant to contradict the USDT dominance picture I laid out above. I still think the broader setup is leaning bullish. But there is one indicator I used to speak about a lot that deserves a bit of airtime, and that is Bitcoin’s realized price.
For those unfamiliar, realized price is essentially the average price at which every Bitcoin last moved on-chain. It has historically acted as a key support level during bear markets, and right now it is sitting somewhere around fifty three thousand dollars.
This is part of why, even though I think we are in or around the bottom of this range, I am also comfortable saying that bottoms tend to be messy. They are rarely clean, and they can drag on for months. Within that kind of environment, a wick down toward realized price is absolutely on the table. It does not have to happen. There is no rule that says history repeats itself to the letter. But it does have a habit of rhyming, and we have already come fairly close to that level.
So this is less of a bearish call and more of a reality check. If we do see another leg lower over the coming months, that $53,000 region is the area I would be watching most closely as potential support. Just something to keep in the back of your mind as we navigate this period.
LINKS:
This newsletter is free because we love sharing our insights with the community. If you enjoy it and find value in our work, consider supporting Pav’s and Will’s Beer/Coffee Fund by donating $XRP to our newsletter donation wallet below. Cheers!
$XRP donation wallet: r3qf2nALyhFwC46QqZ5gJHpF3cjr5gRcoV
Trade XRP Memes here:
https://firstledger.net/?ref=6NRu4StwrImq
Trade on MEXC: https://www.mexc.com/register?inviteCode=mexc-1etb1
Trade on WEEX using this link: https://www.weex.com/login?from=https%3A%2F%2Fwww.weex.com%2FnewbieActivities%3Fid%3D520%26type%3DBEGINNER_TASK%26vipCode%3Duspf
Trading Different (Liquidity Map) - https://t.co/3ks3QMT5VJ?ssr=true
No posts
Comments
Nothing yet. Say the first thing.
Sign in to join the conversation.