
👋 Hey, Jon here!
This month I’m back with a full snapshot of Google Local Service Ad performance for June 2026, broken out by trade where the data supports it.
Make sure to check out our Data Lab, with an interactive Google LSA CPL by region by clicking here (public-facing, on our website!).
I’m also introducing something new this edition, prompted by a conversation with Nicholas Rau of Nextstar this week (shout out, Nick!): instead of only reporting single benchmark averages, I’m showing key metrics as ranges, including a scatter plot of cost per unique lead across every business in the sample. More on why below.
A few methodology notes before we get into the numbers:
This is a point-in-time snapshot of GLSA performance across 945 home services businesses on the SearchLight platform in June 2026, covering nearly $13.1M in spend.
The businesses selected for this sample had at least one paying customer attributed to GLSA during the period and verified data.
The average spend per business on GLSA during June from this sample was $13,844, up sharply from $9,678 in May.
It’s worth noting, in keeping with this month’s theme, that the median June spend was $6,070, with the middle 80% of businesses spending between $700 and $33,000.
The average is pulled up by large multi-location operators, so if your LSA budget is nowhere near $13.8K, it’s not a red flag.
A note on trade segmentation: Trade was identified from campaign naming conventions within the SearchLight platform (not a structured field in the data), so it’s directional, not absolute. Campaigns that clearly indicated a single trade (e.g., “LSA - Plumbing” or “ABC Heating & Air”) were classified accordingly.
Campaigns serving multiple trades or using generic names are grouped into a General / Multi-Trade bucket, which accounts for 40.8% of total spend.
With that context, let’s get into it.
🚨 It cost $62.56 per unique lead from Google LSAs in June, across 945 businesses and $13.1M in spend
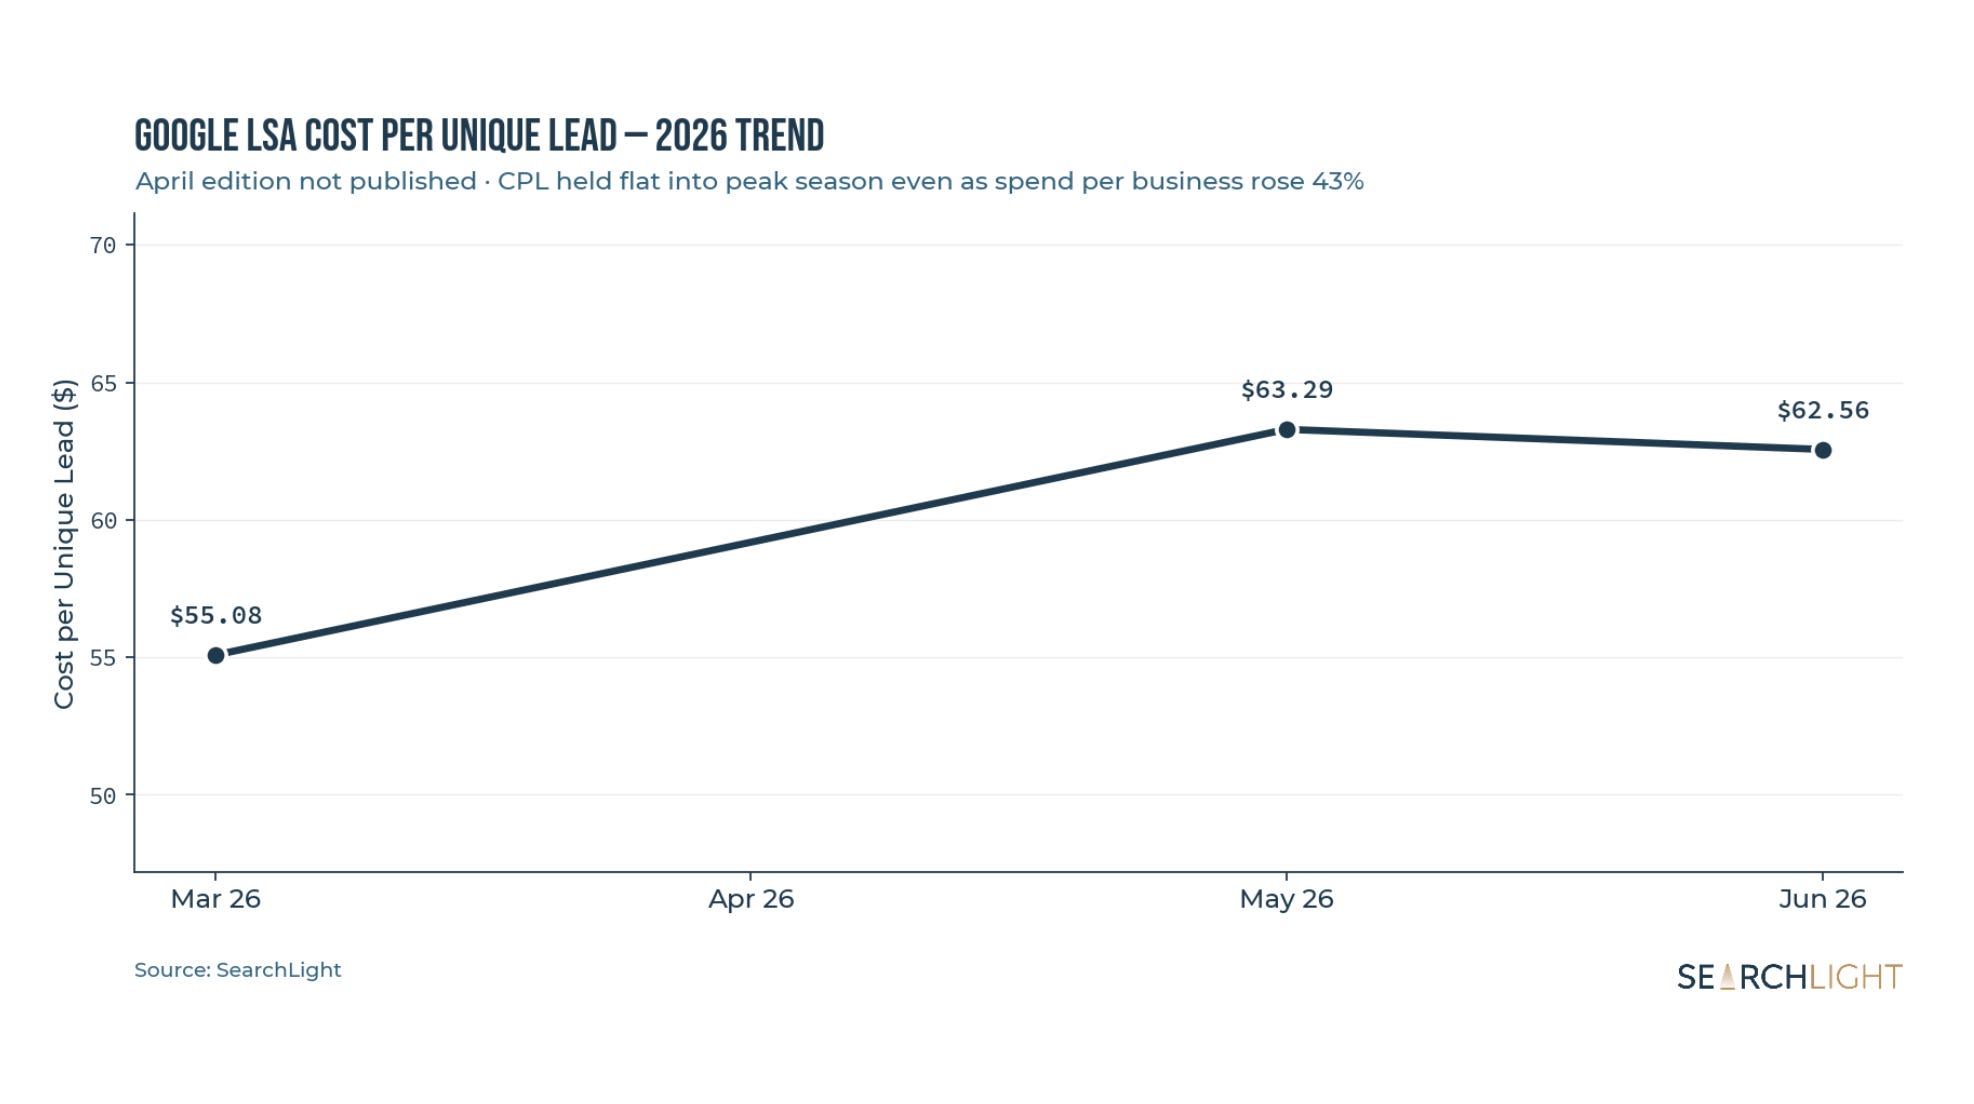
➡️ CPL held flat from May ($63.29) even as spend per business jumped 43% (avg $13,844; median $6,070)
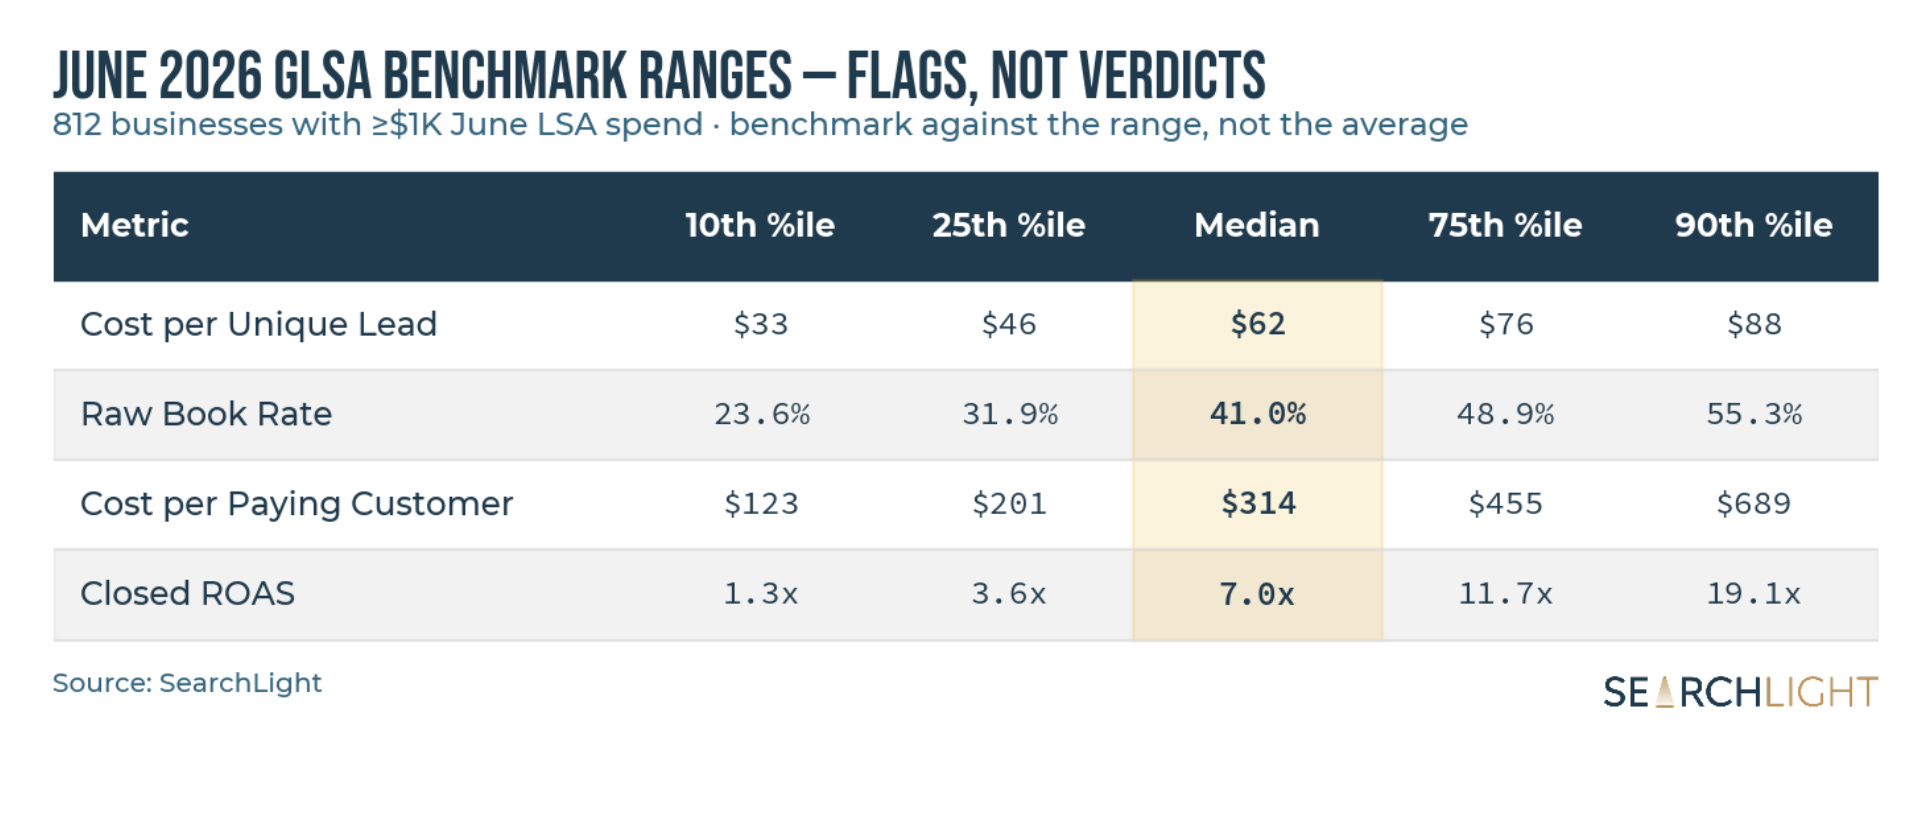
🚨 New: ranges, not just averages. The middle 80% of businesses paid between $33 and $88 per unique lead.
⬆️ New customers drove 67.3% of closed revenue on GLSA: 65.4% of bookings and 63.5% of paying customers were net-new, at a higher average ticket than existing customers
➡️ Raw book rate was 42.0% (middle 80% of businesses: 24% to 55%)
🚨 It cost $302.33 to acquire a paying customer (middle 80%: $123 to $689)
➡️ Closed ROAS was 7.78x in aggregate, but the middle 80% of businesses ranged from 1.3x to 19.1x. That’s the widest spread of any metric in this report
🚨 47.7% of GLSA revenue pipeline is sitting in unsold estimates at the close of the month, about $119K per business in June alone
Across the 945-business sample, GLSA generated 209,141 unique leads from 370,122 total conversions, at a cost per unique lead (CPL) of $62.56.
That means roughly 43.5% of raw conversions were duplicates or repeat touches, consistent with the 43% we saw in May, and a good reminder that raw conversion volume is not the same thing as unique leads.
On a per-business basis, the sample averaged 221 unique leads per business over the course of June, up from 153 in May. Summer demand showed up in volume.
CPL by trade:
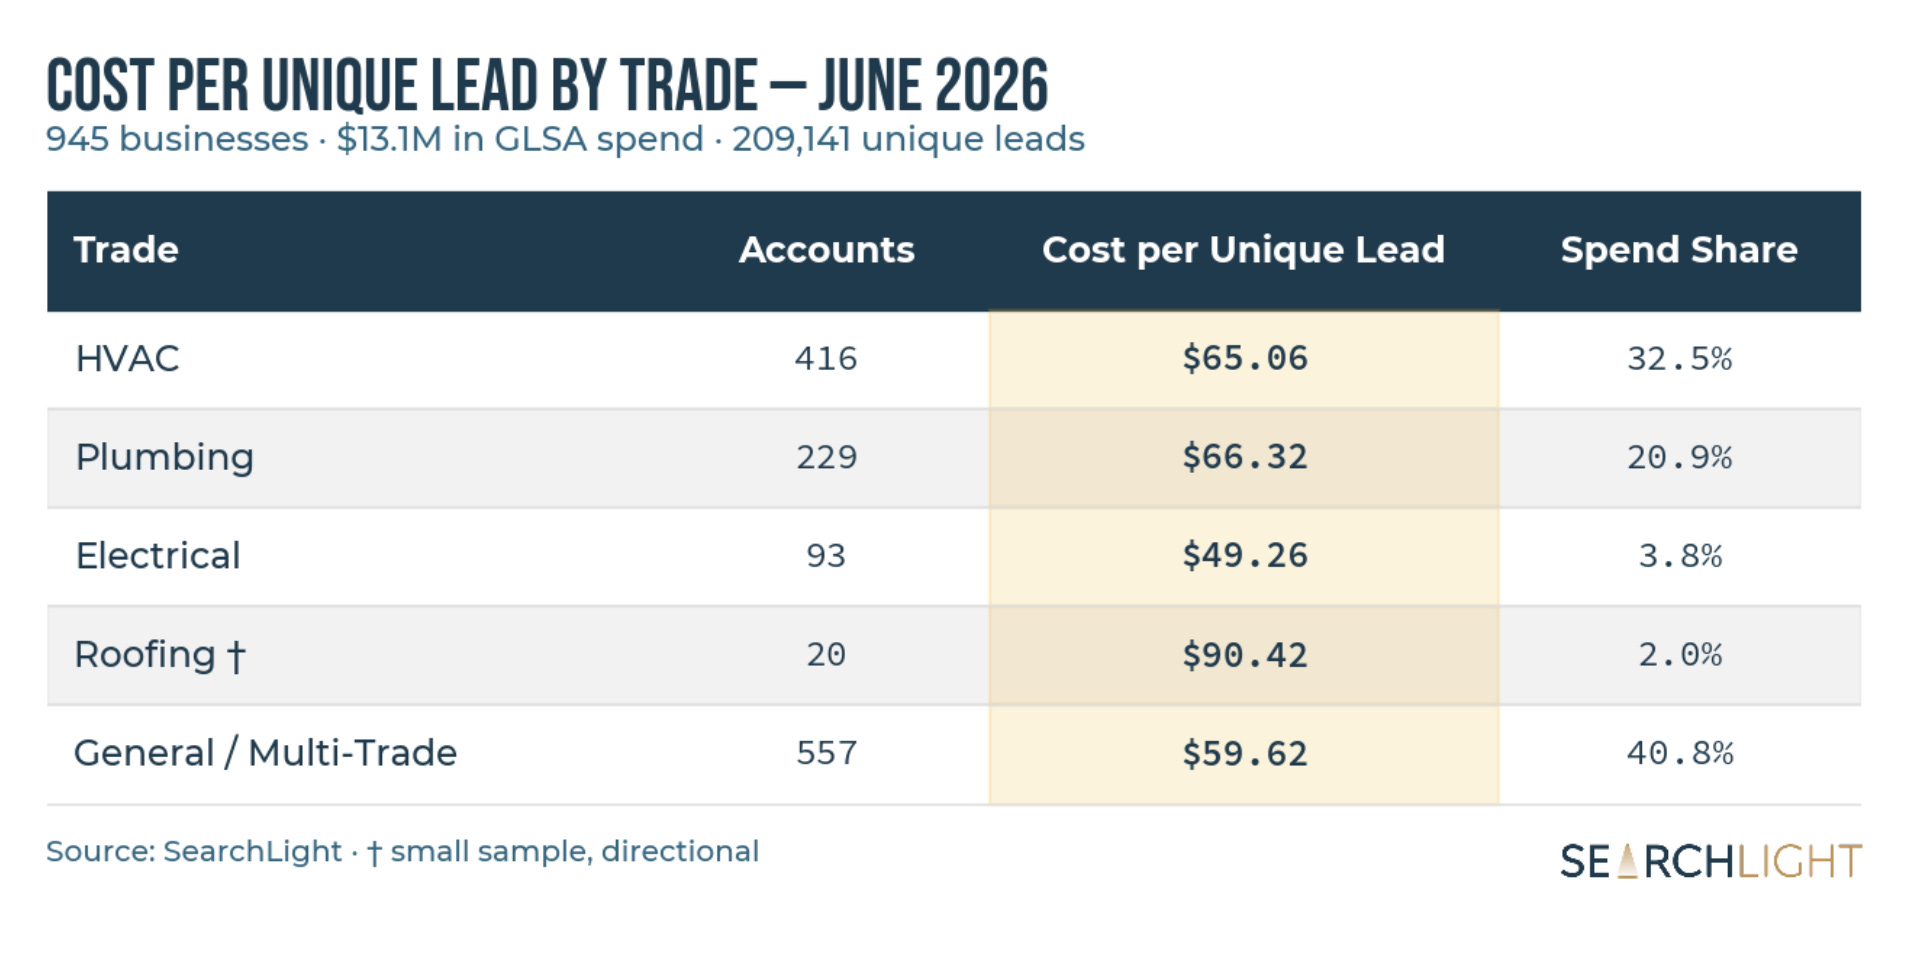
HVAC and Plumbing were nearly identical this month, separated by just over a dollar. Electrical remained the least expensive trade at $49.26, and with 93 accounts in the June sample (up from 21 in May), I’m more comfortable with that number than I was a month ago. Roofing’s $90.42 comes from just 20 accounts, so treat it as directional.
The trend: CPL was $55.08 in March, $63.29 in May, and $62.56 in June. Given that average spend per business rose 43% month over month, a flat CPL is actually a decent outcome.
Google’s pricing didn’t punish the sample for scaling into peak season.
Benchmarks can be tricky - your business and your market are different, but this newsletter, I wanted to provide ranges so you don’t get stuck on one number and think something is wrong.
If you want data like this for your business, book a demo with us.
A few days ago I was walking a partner (shout-out to Nick Rau, again) through our benchmark data, and he pushed back on something in the best way: when we publish a single average like “$63 per lead,” people treat it as a pass/fail threshold.
An operator sees a $75 CPL, compares it to $63, and concludes their LSA is not performing well.
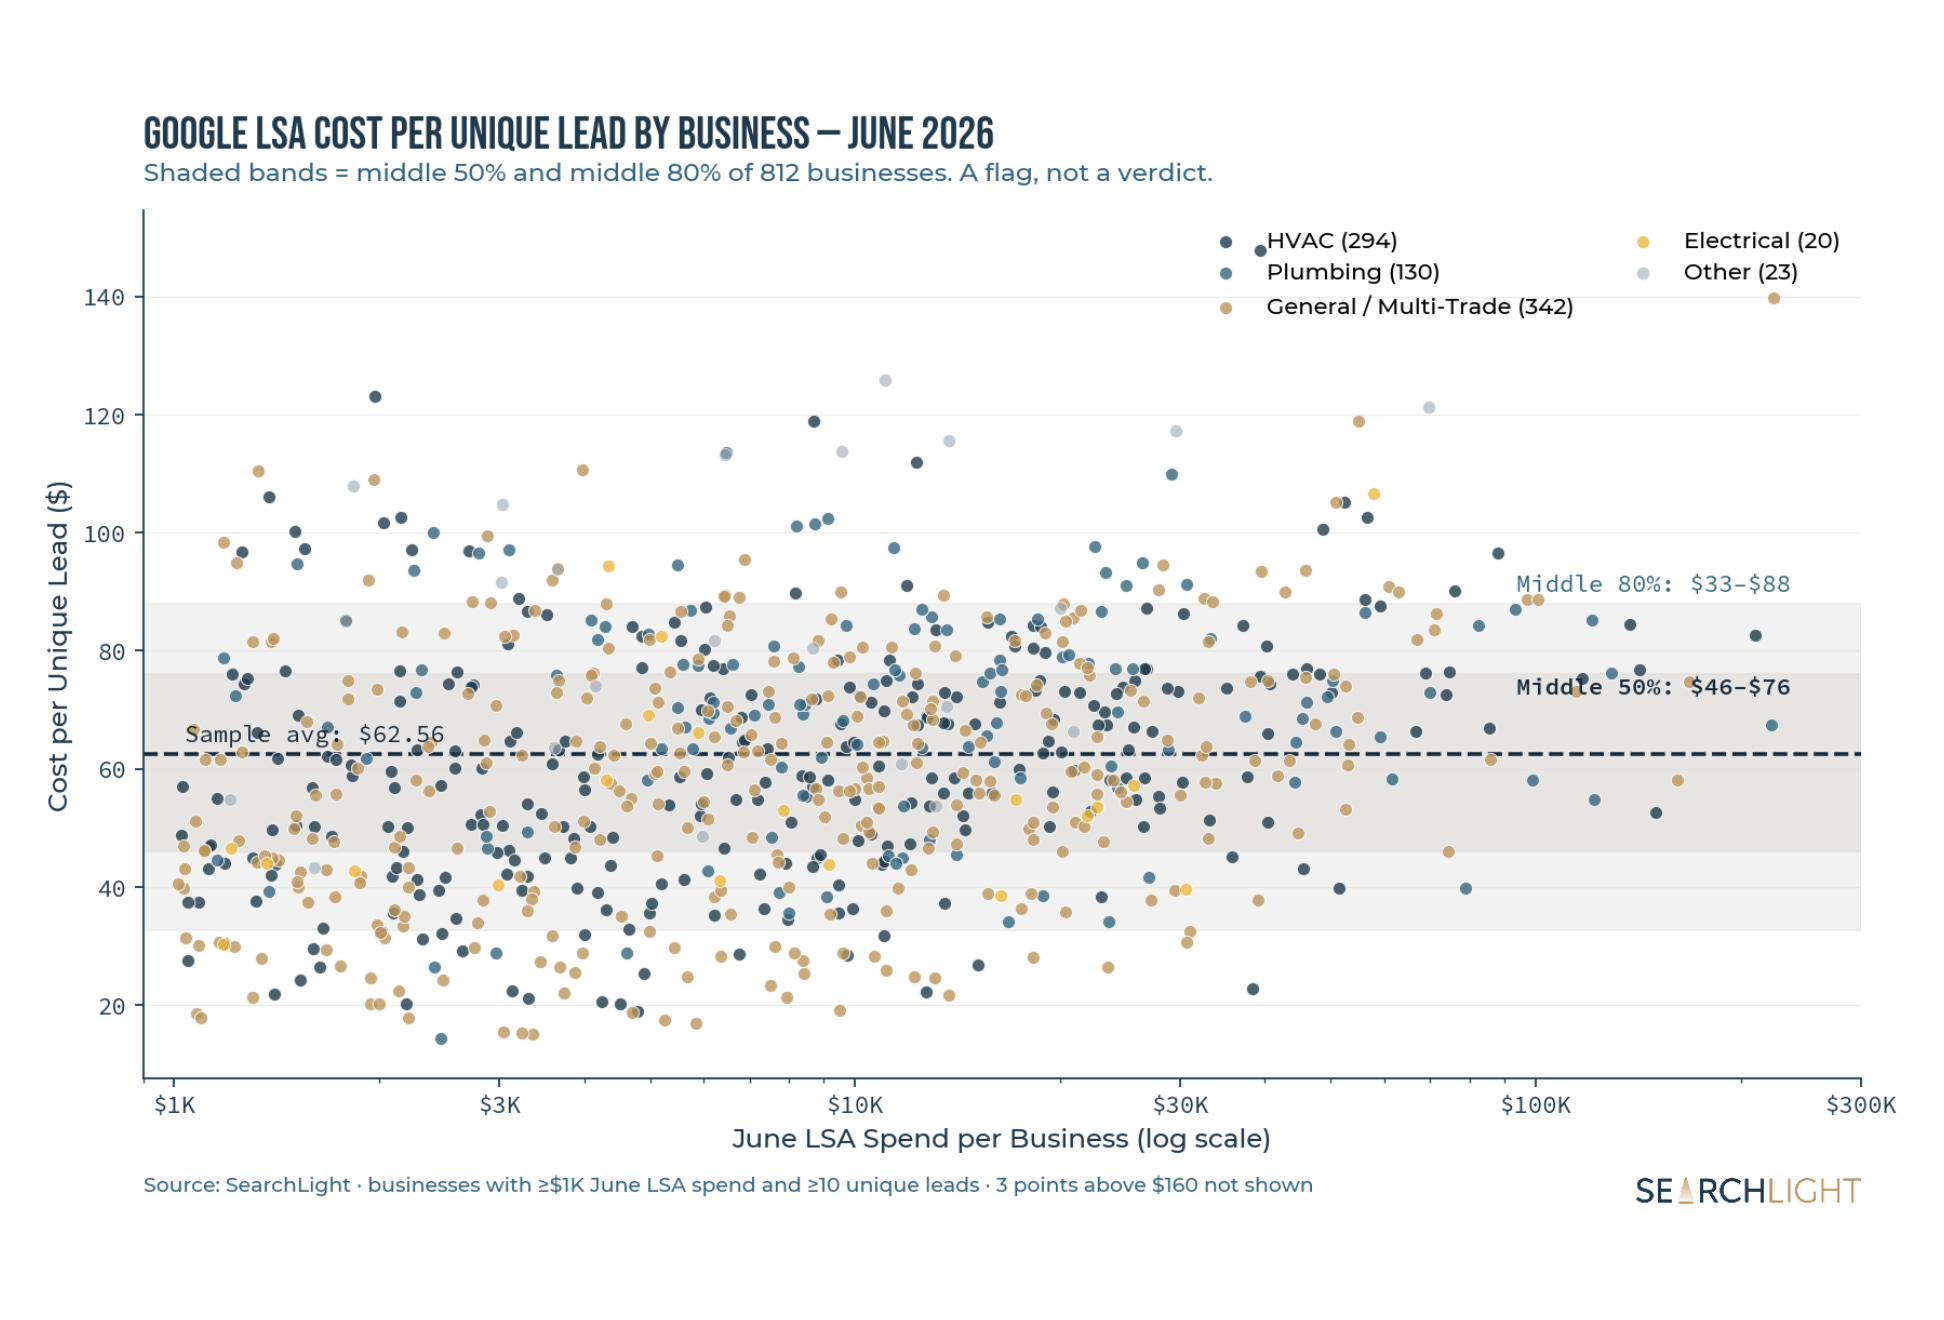
But a $75 CPL isn’t broken. It’s inside the normal range. Look at the actual spread across the 812 businesses in this sample with at least $1K in June LSA spend:
The middle 50% of businesses paid between $46 and $76 per unique lead
The middle 80% paid between $33 and $88
The median was $61.64
That’s nearly a 3x swing between the 10th and 90th percentile, driven by market, trade mix, review profile, and response behavior. So instead of a single number, here’s every business in the sample as a point:
How to read the scatter plot:
⬆️ If you’re above the band: that’s a flag. Not a verdict, a flag. Check your review velocity, response time, and service area settings before assuming the channel is broken. And note from the chart: expensive leads exist at every spend level. Scale doesn’t automatically buy you cheaper leads on LSA.
➡️ If you’re inside the band: you’re in the normal range for the market. Optimize downstream (book rate, match rate) before chasing a lower CPL.
⬇️ If you’re below the band: nice work, but confirm lead quality is holding. Cheap leads that don’t book aren’t cheap.
The same logic applies within trade. HVAC businesses ranged from roughly $36 to $85 per lead (10th to 90th percentile, median $59). Plumbing ran hotter: $43 to $95, with a median of $71.
The takeaway: benchmark yourself against your trade and the range, not against a single national average. The average is a reference point, not a grade.
Of the 209,141 unique leads generated, 87,869 booked an appointment, resulting in a raw book rate of 42.0%.
As always: “raw” means no leads were filtered out, even if they weren’t bookable. If you paid for 100 leads on GLSA in June, roughly 42 of them booked an appointment.
Book rate by trade:
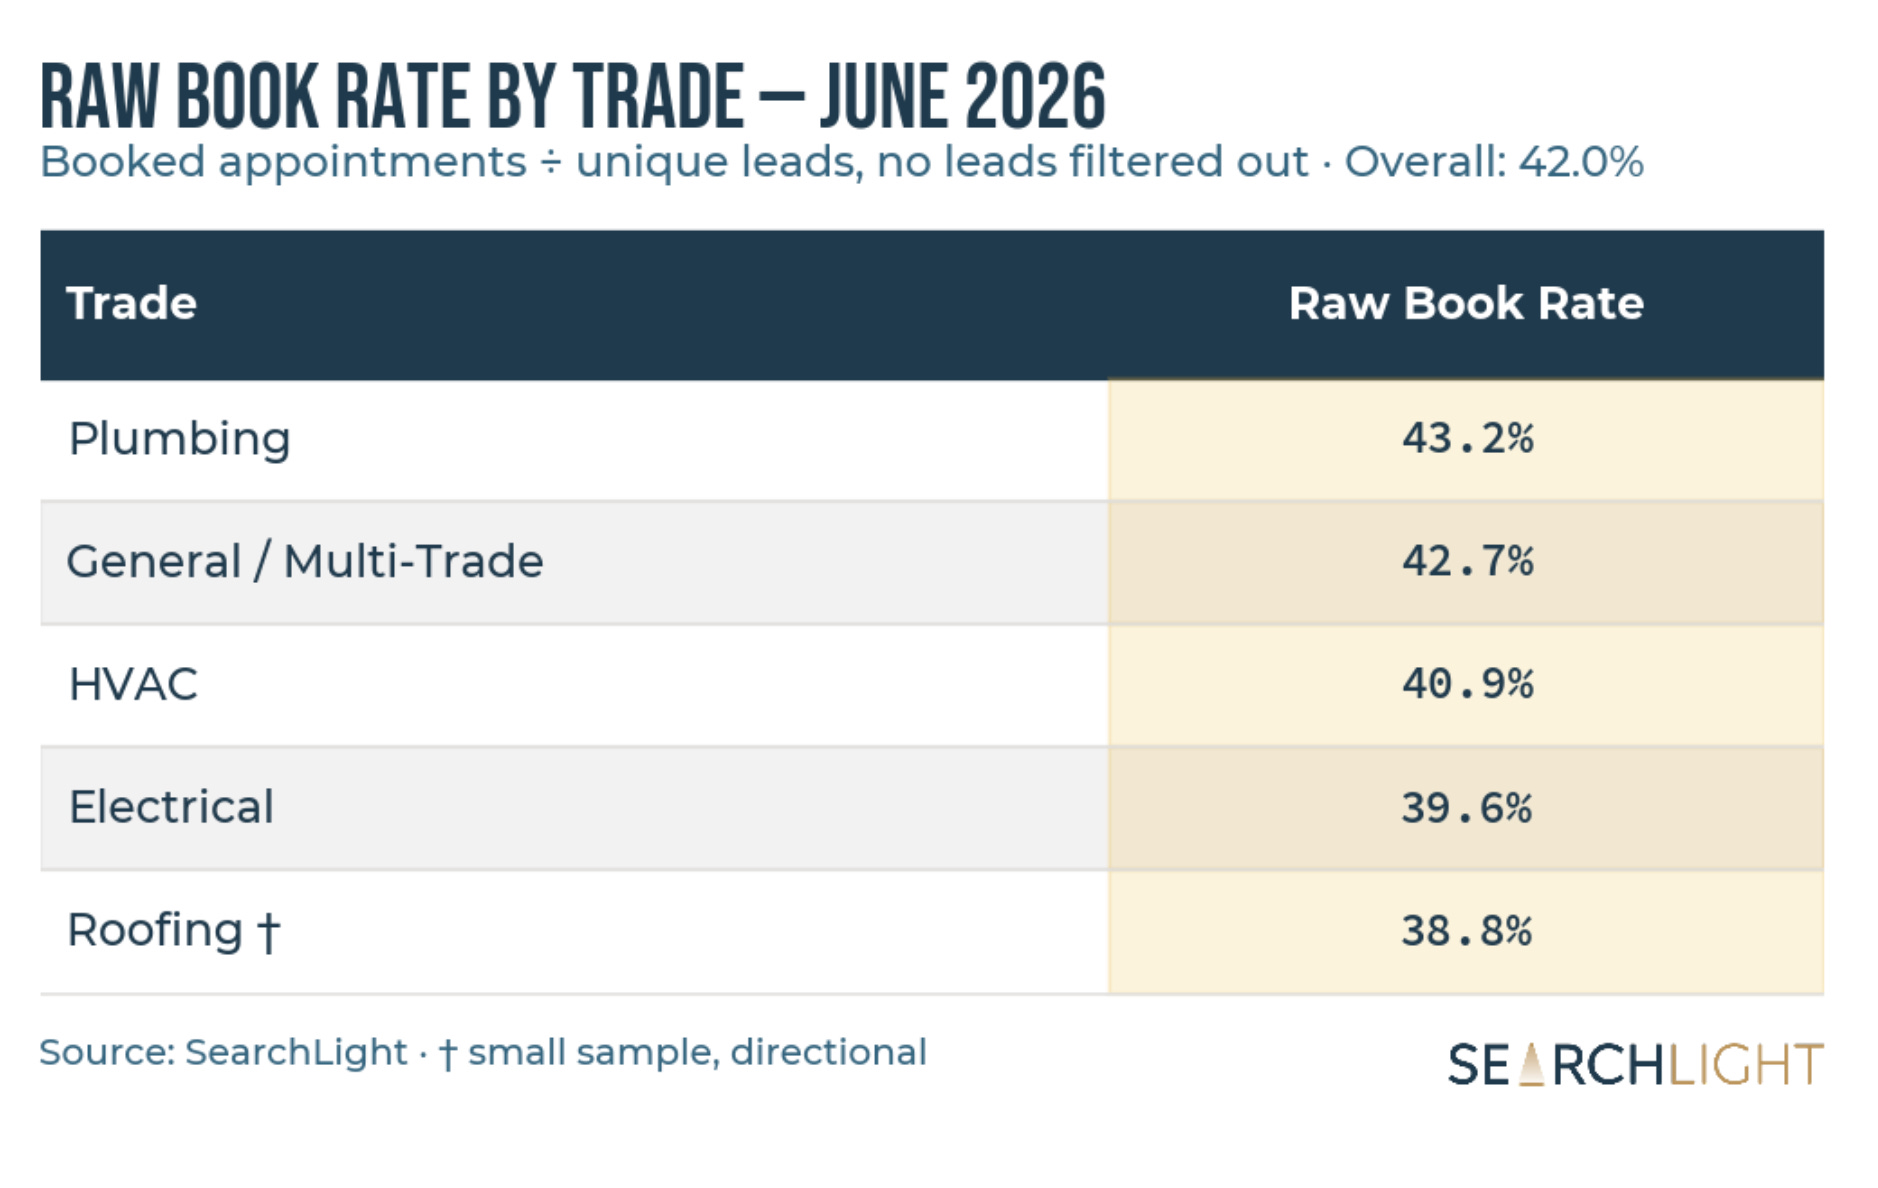
Plumbing led again, consistent with the volume-and-velocity nature of plumbing service calls. Electrical’s book rate improved from May’s 34% to 39.6% as the sample grew, which suggests the May number was more sample artifact than trade reality.
And in keeping with this month’s theme, the range matters more than the average: the middle 80% of businesses booked between 24% and 55% of their unique leads.
If two businesses pay the same $62 per lead but one books at 55% and the other at 24%, their cost per booked appointment differs by more than 2x before a truck ever rolls.
Across all trades, the cost to acquire a paying customer (an individual in a sold or closed state during June) from GLSA was $302.33, down from $315.52 in May.
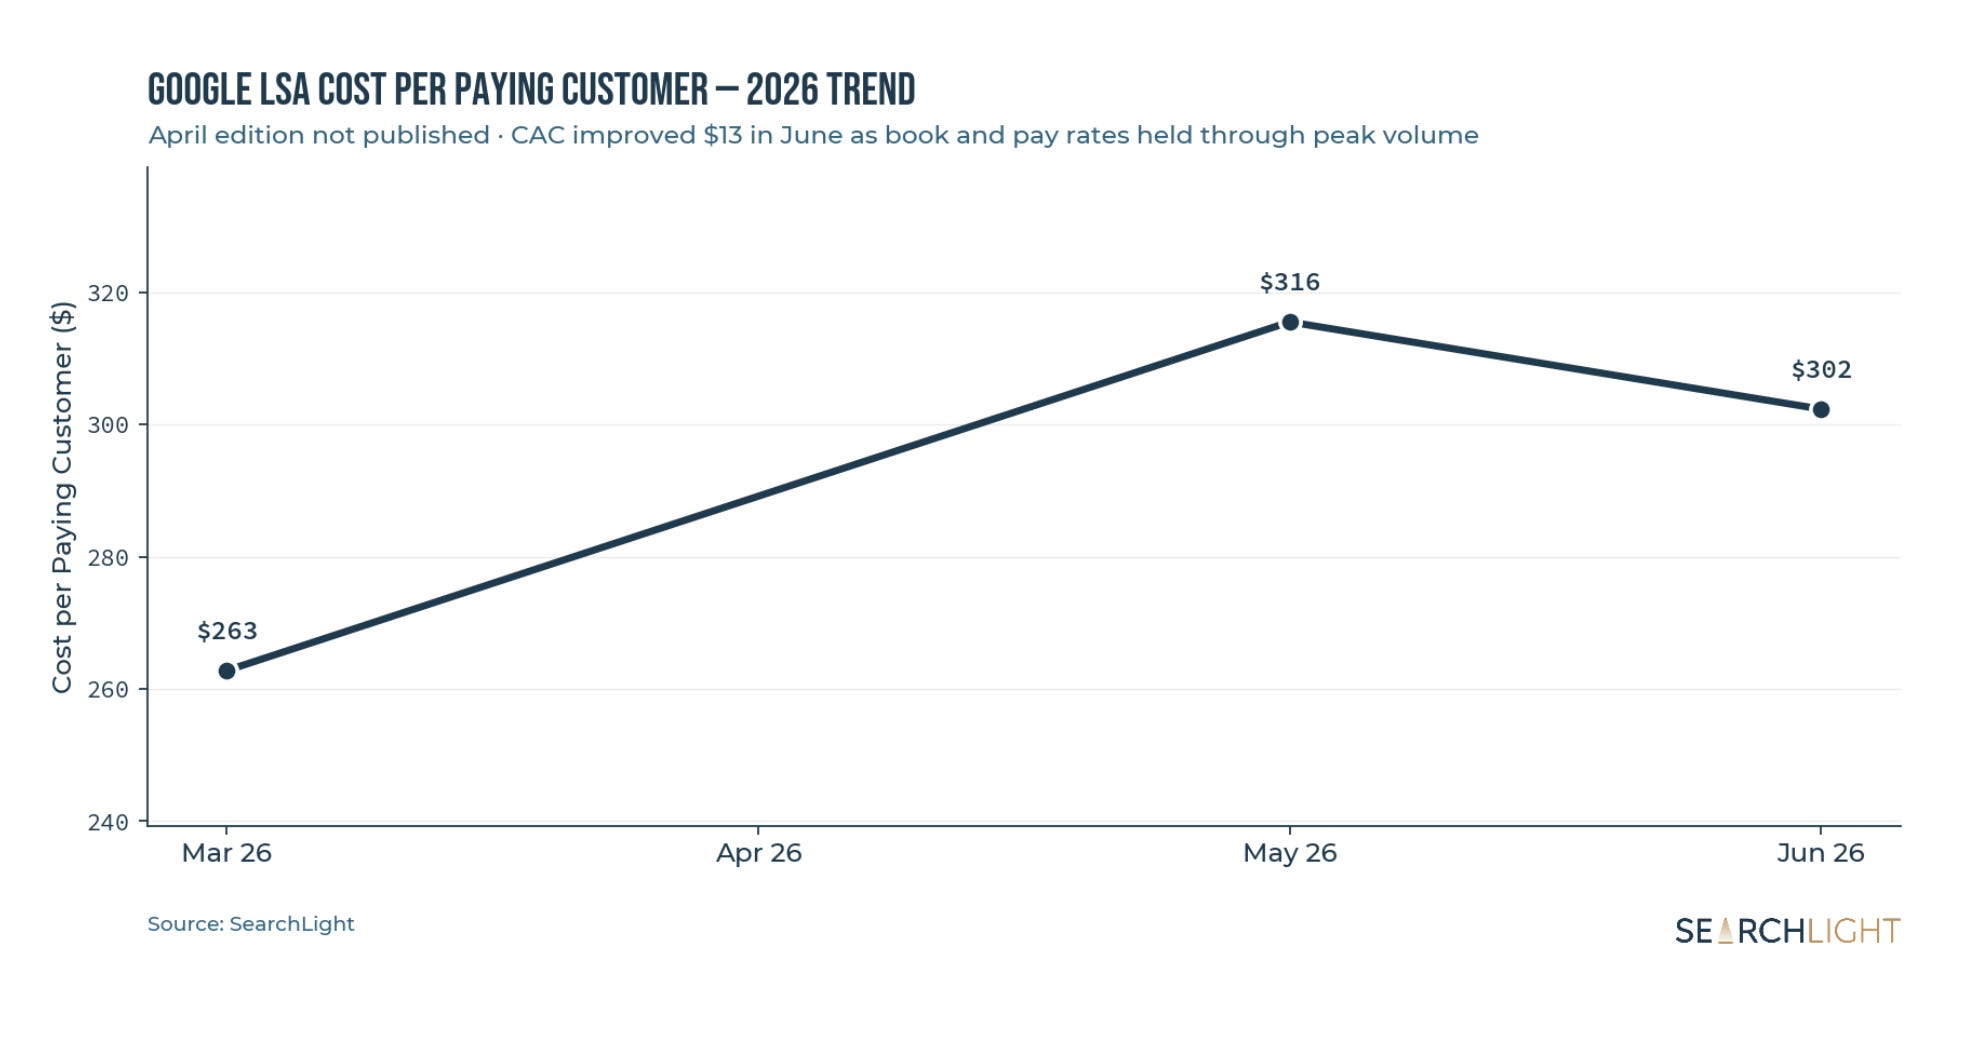
Unit economics by trade:
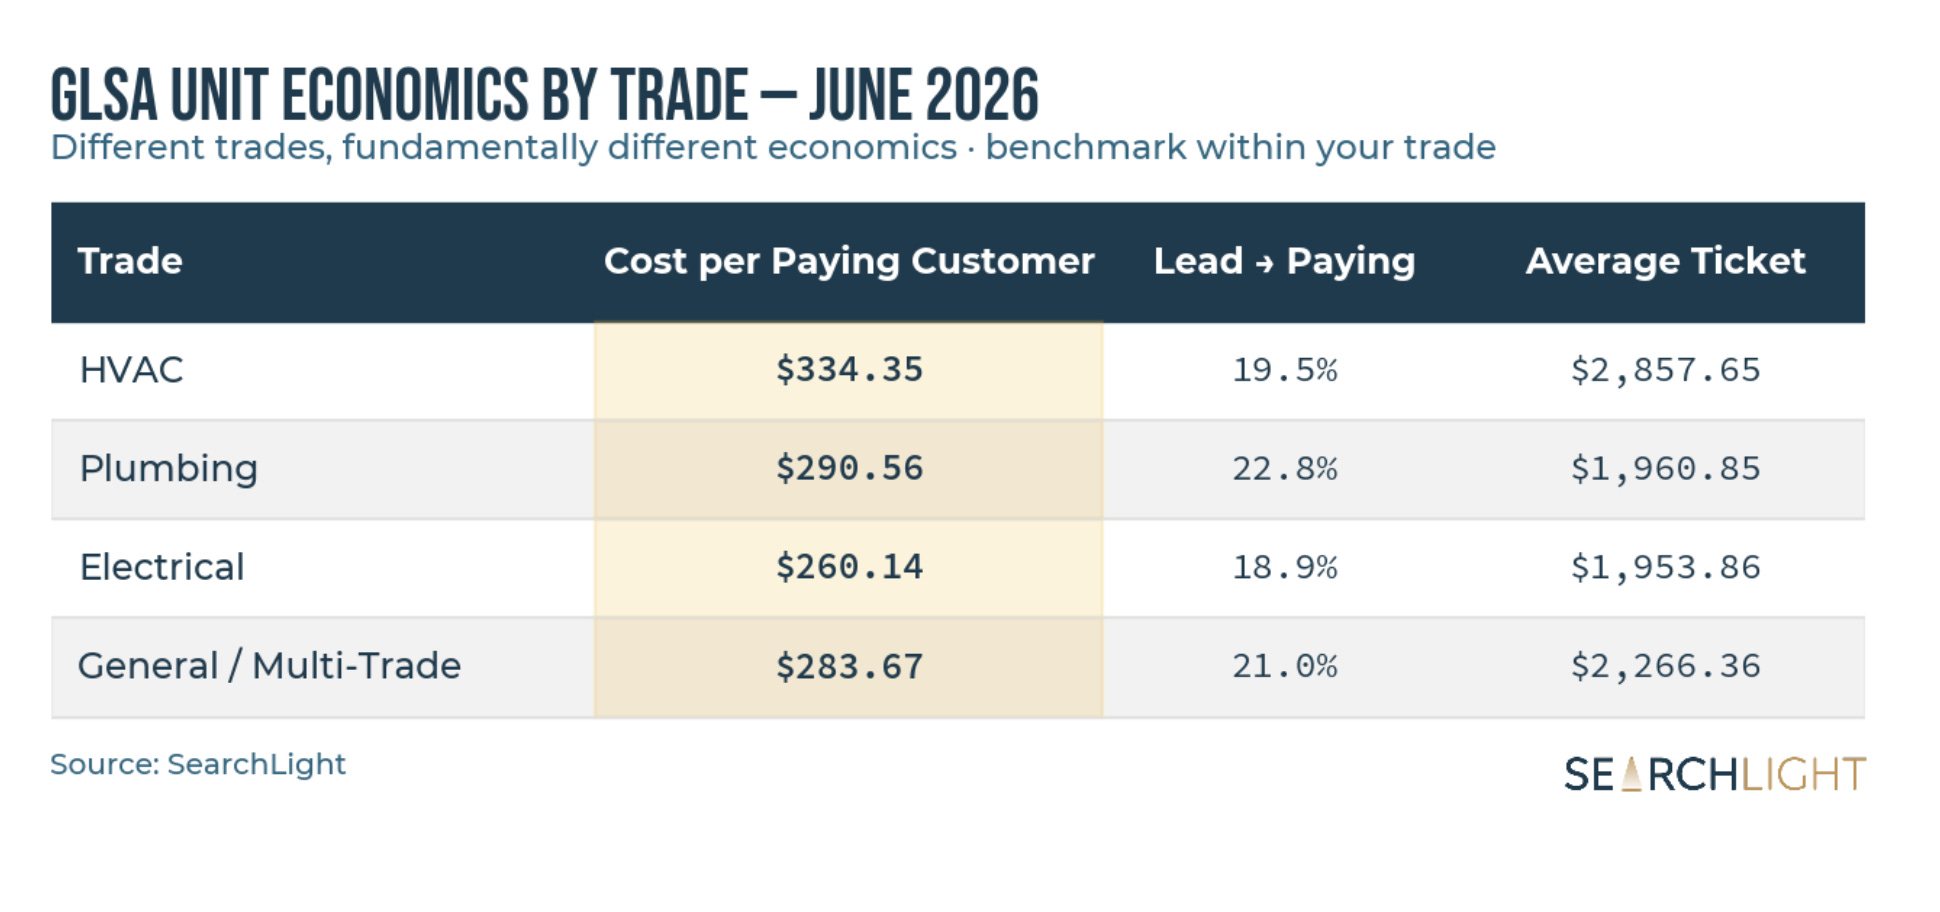
The pattern from March and May holds: HVAC is the most expensive trade to acquire a customer, but it commands the highest average ticket by a wide margin ($2,857.65 in June, boosted by peak-season replacements).
Plumbing converts the highest share of unique leads to paying customers but at a lower ticket. Electrical remains the most compelling ticket-to-CAC ratio if you can get the volume.
These are fundamentally different unit economics by trade, and “good” GLSA performance should be benchmarked within trade, not against an overall average.
And here’s the CAC range across the 812-business range sample, because $302.33 is a reference point, not a grade:
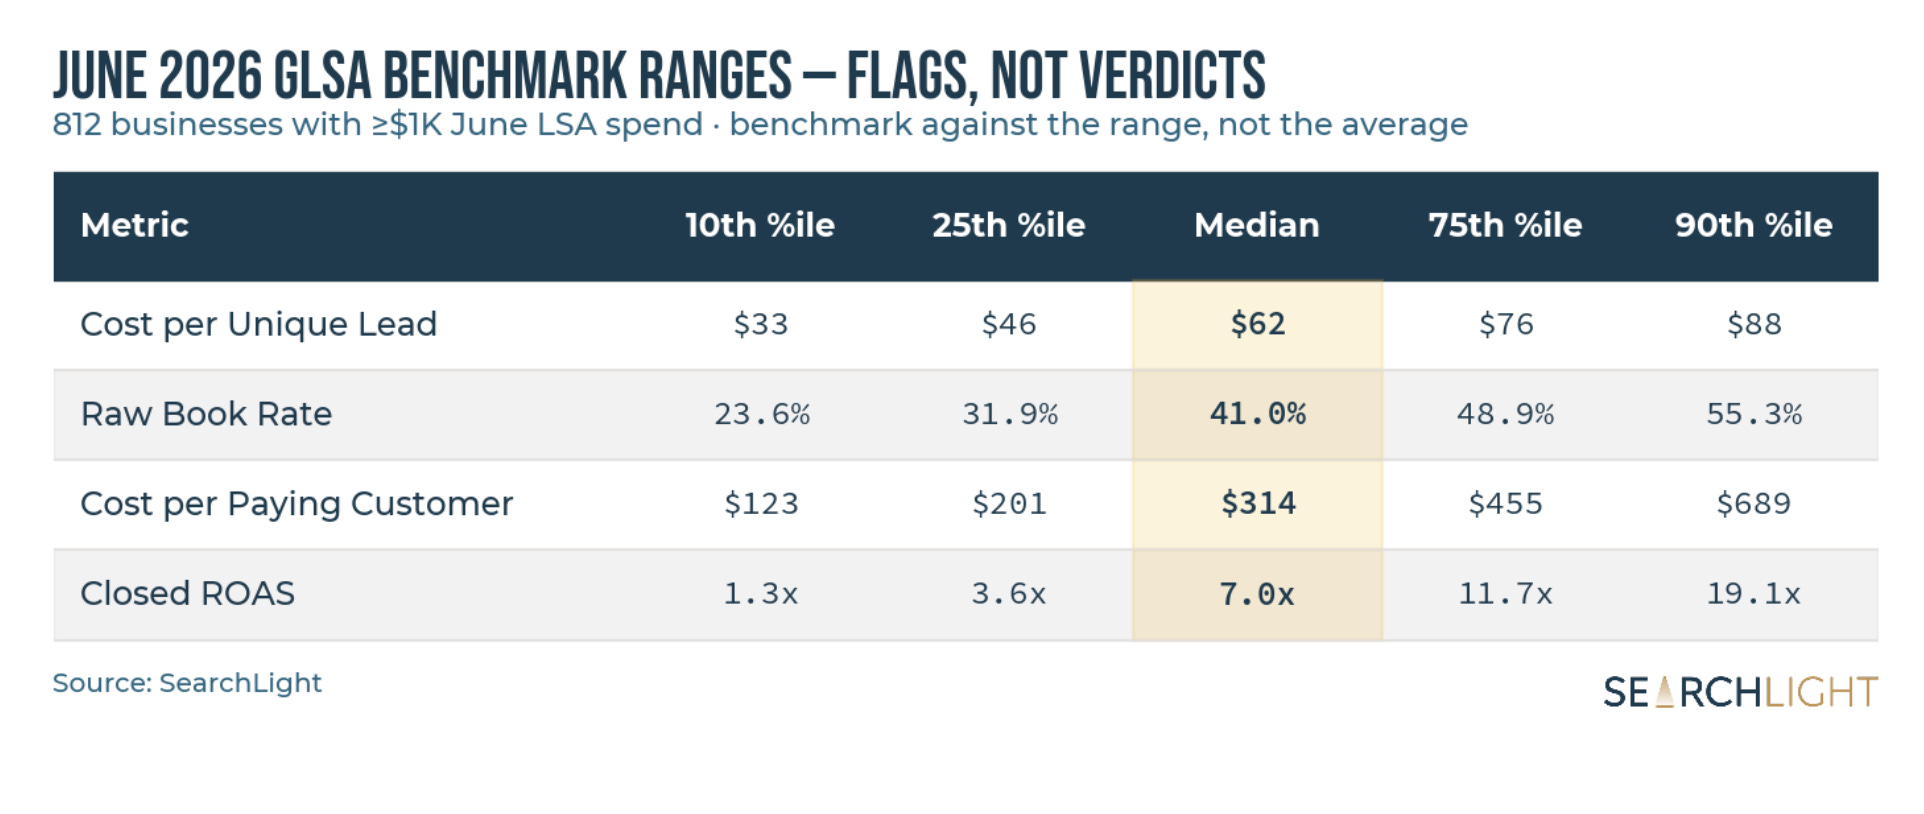
That’s a 5.6x spread from the 10th to the 90th percentile. Within trade: HVAC businesses ranged from $129 to $716 (median $281), Plumbing from $170 to $591 (median $319). CPL differences explain only part of that gap. Most of it is what happens after the phone rings: book rate, cancellation, and estimate close rate.
On a per-business basis, GLSA generated an average of 45.8 paying customers in June, up from 30.7 in May.
In aggregate, this sample generated $101.8M in closed revenue on $13.1M in spend, a closed ROAS of 7.78x. The median business came in at 7.0x.
But of all the metrics in this report, ROAS has the widest spread, and it’s the one where benchmarking against the average is most misleading.
The 90th-percentile business generated 14x the return of the 10th-percentile business on the same channel in the same month.
By trade, medians clustered tightly (HVAC 8.1x, General/Multi-Trade 6.8x, Plumbing 6.2x, Electrical 6.1x), which tells you the spread isn’t primarily a trade story. It’s an execution story: review profile, response speed, booking discipline, and estimate follow-up separate the top decile from the bottom far more than trade mix does.
Two caveats worth keeping in mind:
Closed ROAS is a lagging metric. June installs sold in June but completed in July won’t show up here yet, so businesses with longer job cycles will look worse on a single-month snapshot than they really are.
A 1.3x closed ROAS in June isn’t automatically a failing program for the same reason, but if you’re persistently below ~3x across multiple months, that’s a flag worth pulling on.
I split the sample into new vs. existing customers to answer a question I get constantly: is LSA actually an acquisition channel, or are you paying Google for customers who already know you?
The answer, at least in June: it’s an acquisition channel.
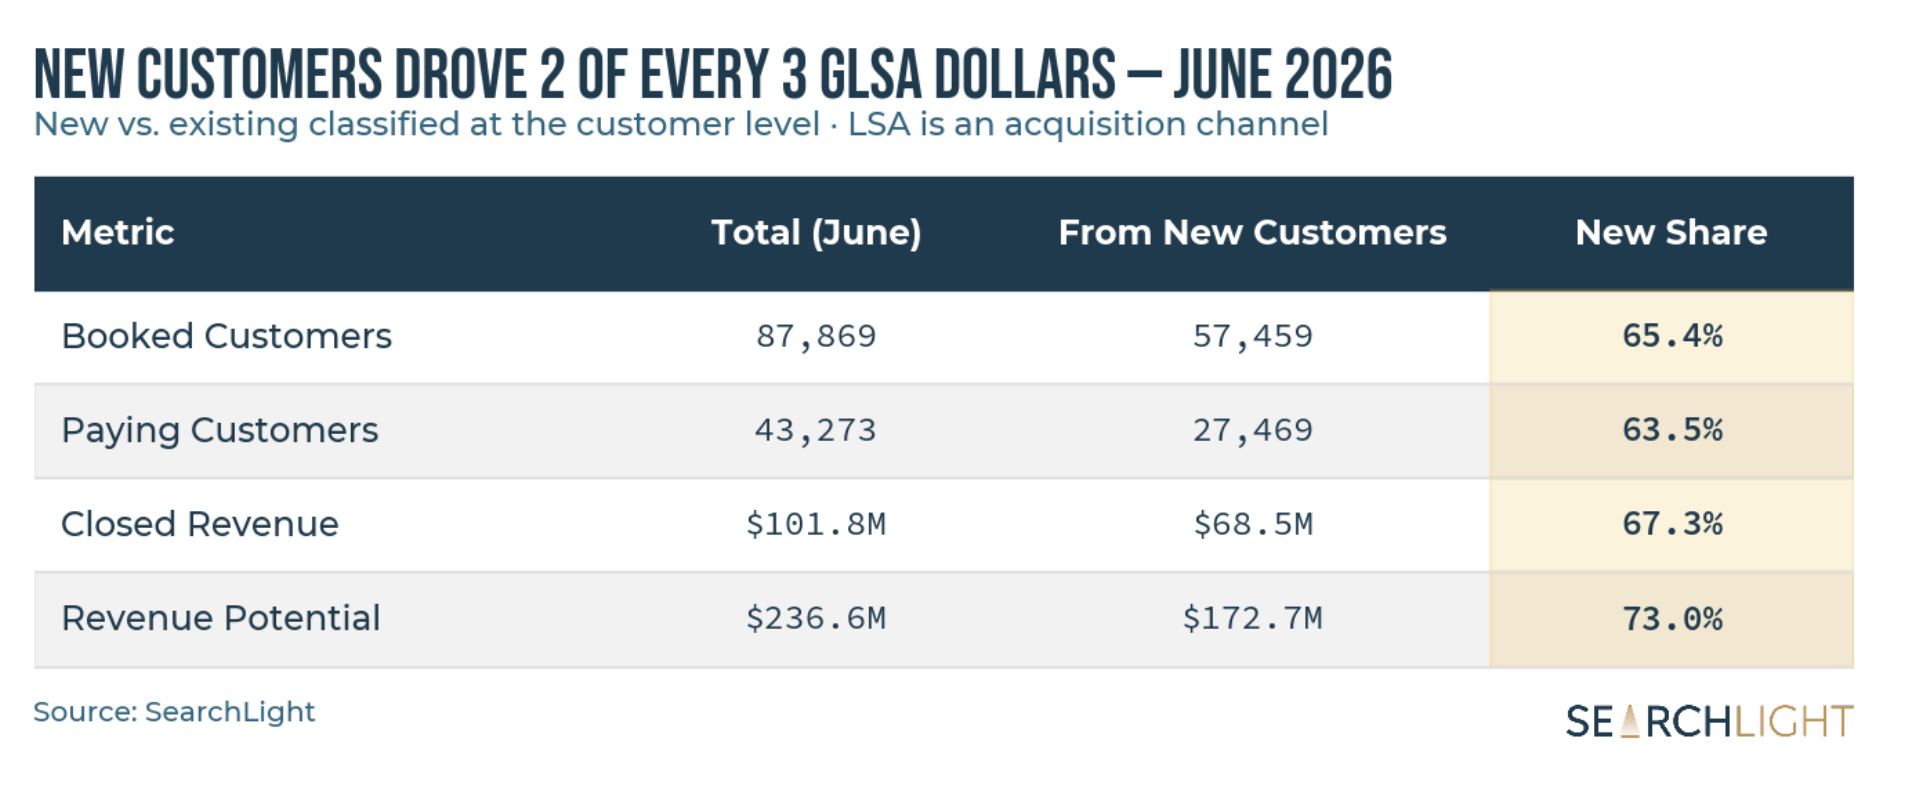
Roughly two out of every three booked appointments, paying customers, and closed revenue dollars from LSA came from net-new customers. Combine that with new customers carrying a higher average ticket ($2,495 vs. $2,106 for existing), and the acquisition math on this channel is better than the blended numbers suggest.
How new customers converted through the funnel:
Once booked, new customers converted to paying at nearly the same rate as the blended sample (47.8% booked-to-paying vs. 49.2% overall). Where they differ is at the estimate stage:
New customers: 39.7% of revenue potential closed; 51.1% still sitting in unsold estimates
Existing customers: 52.0% of revenue potential closed; only 38.5% unsold
GLSA generated $236.6M in total revenue opportunity across this sample in June.
That figure includes unsold estimates (one per customer, no double-counting), sold revenue (jobs sold but not yet completed), and closed revenue (work done and collected). Every customer is in one of those three states:
🚨 Unsold estimates: $112.9M (47.7%)
➡️ Sold, not yet completed: $21.9M (9.3%)
⬆️ Closed revenue: $101.8M (43.0%)
That unsold share is up slightly from 46.6% in May, which makes sense in peak season: estimate volume (especially HVAC replacement quotes) grows faster than sales teams can close it.
Here’s the practical framing: that’s roughly $119K in open estimate value per business from June alone, and as shown above, 78% of it sits with new customers: the exact segment least likely to close without follow-up.
If the average business in this sample closed just 5% more of its open estimate value, that’s about $6,000 in additional revenue per month with zero additional ad spend.
Your cheapest lead is the estimate you already paid for.
If you want to see where your own LSA performance sits inside these ranges, CPL, book rate, cost per paying customer, and how much revenue is sitting in your unsold estimates, that’s exactly what SearchLight does across 1,500+ home services contractors. Book a demo.
See you next month,
Jon
No posts
Comments
Nothing yet. Say the first thing.
Sign in to join the conversation.