

👋 Hey, Jon here!
This month I’m back with a full snapshot of Google Local Service Ad performance for May 2026, broken out by trade where the data supports it.
A few methodology notes before we get into the numbers:
This is a point-in-time snapshot of GLSA performance across 1,011 home services businesses on the SearchLight platform in May 2026, covering nearly $9.8M in spend.
The businesses selected for this sample had at least one paying customer attributed to GLSA during the period.
The average spend per business on GLSA during May from this sample was $9,678.
A note on trade segmentation: Trade was identified from account naming conventions within the SearchLight platform (not a structured field in the data), so it’s directional, not absolute. Accounts that clearly indicated a single trade (e.g., “XYZ Plumbing” or “ABC Heating & Air”) were classified accordingly. Accounts serving multiple trades or using generic names are grouped into a General / Multi-Trade bucket, which accounts for 60.6% of total spend, consistent with prior periods.
PS: If you're running Google Ads alongside LSA, we recently published a case study showing how automated conversion uploading (revenue and bookings) through SearchLight’s RevSync lifted closed ROAS by 25%.
With that context, let’s get into it.
Across the 1,011-business sample, GLSA generated 154,593 unique leads from 269,422 total conversions, at a cost per unique lead (CPL) of $63.29.
That means roughly 43% of raw conversions were duplicates or repeat touches, consistent with the 37% we saw in March, and a good reminder that raw conversion volume is not the same thing as unique leads.
On a per-business basis, the sample averaged 153 unique leads per business over the course of May.
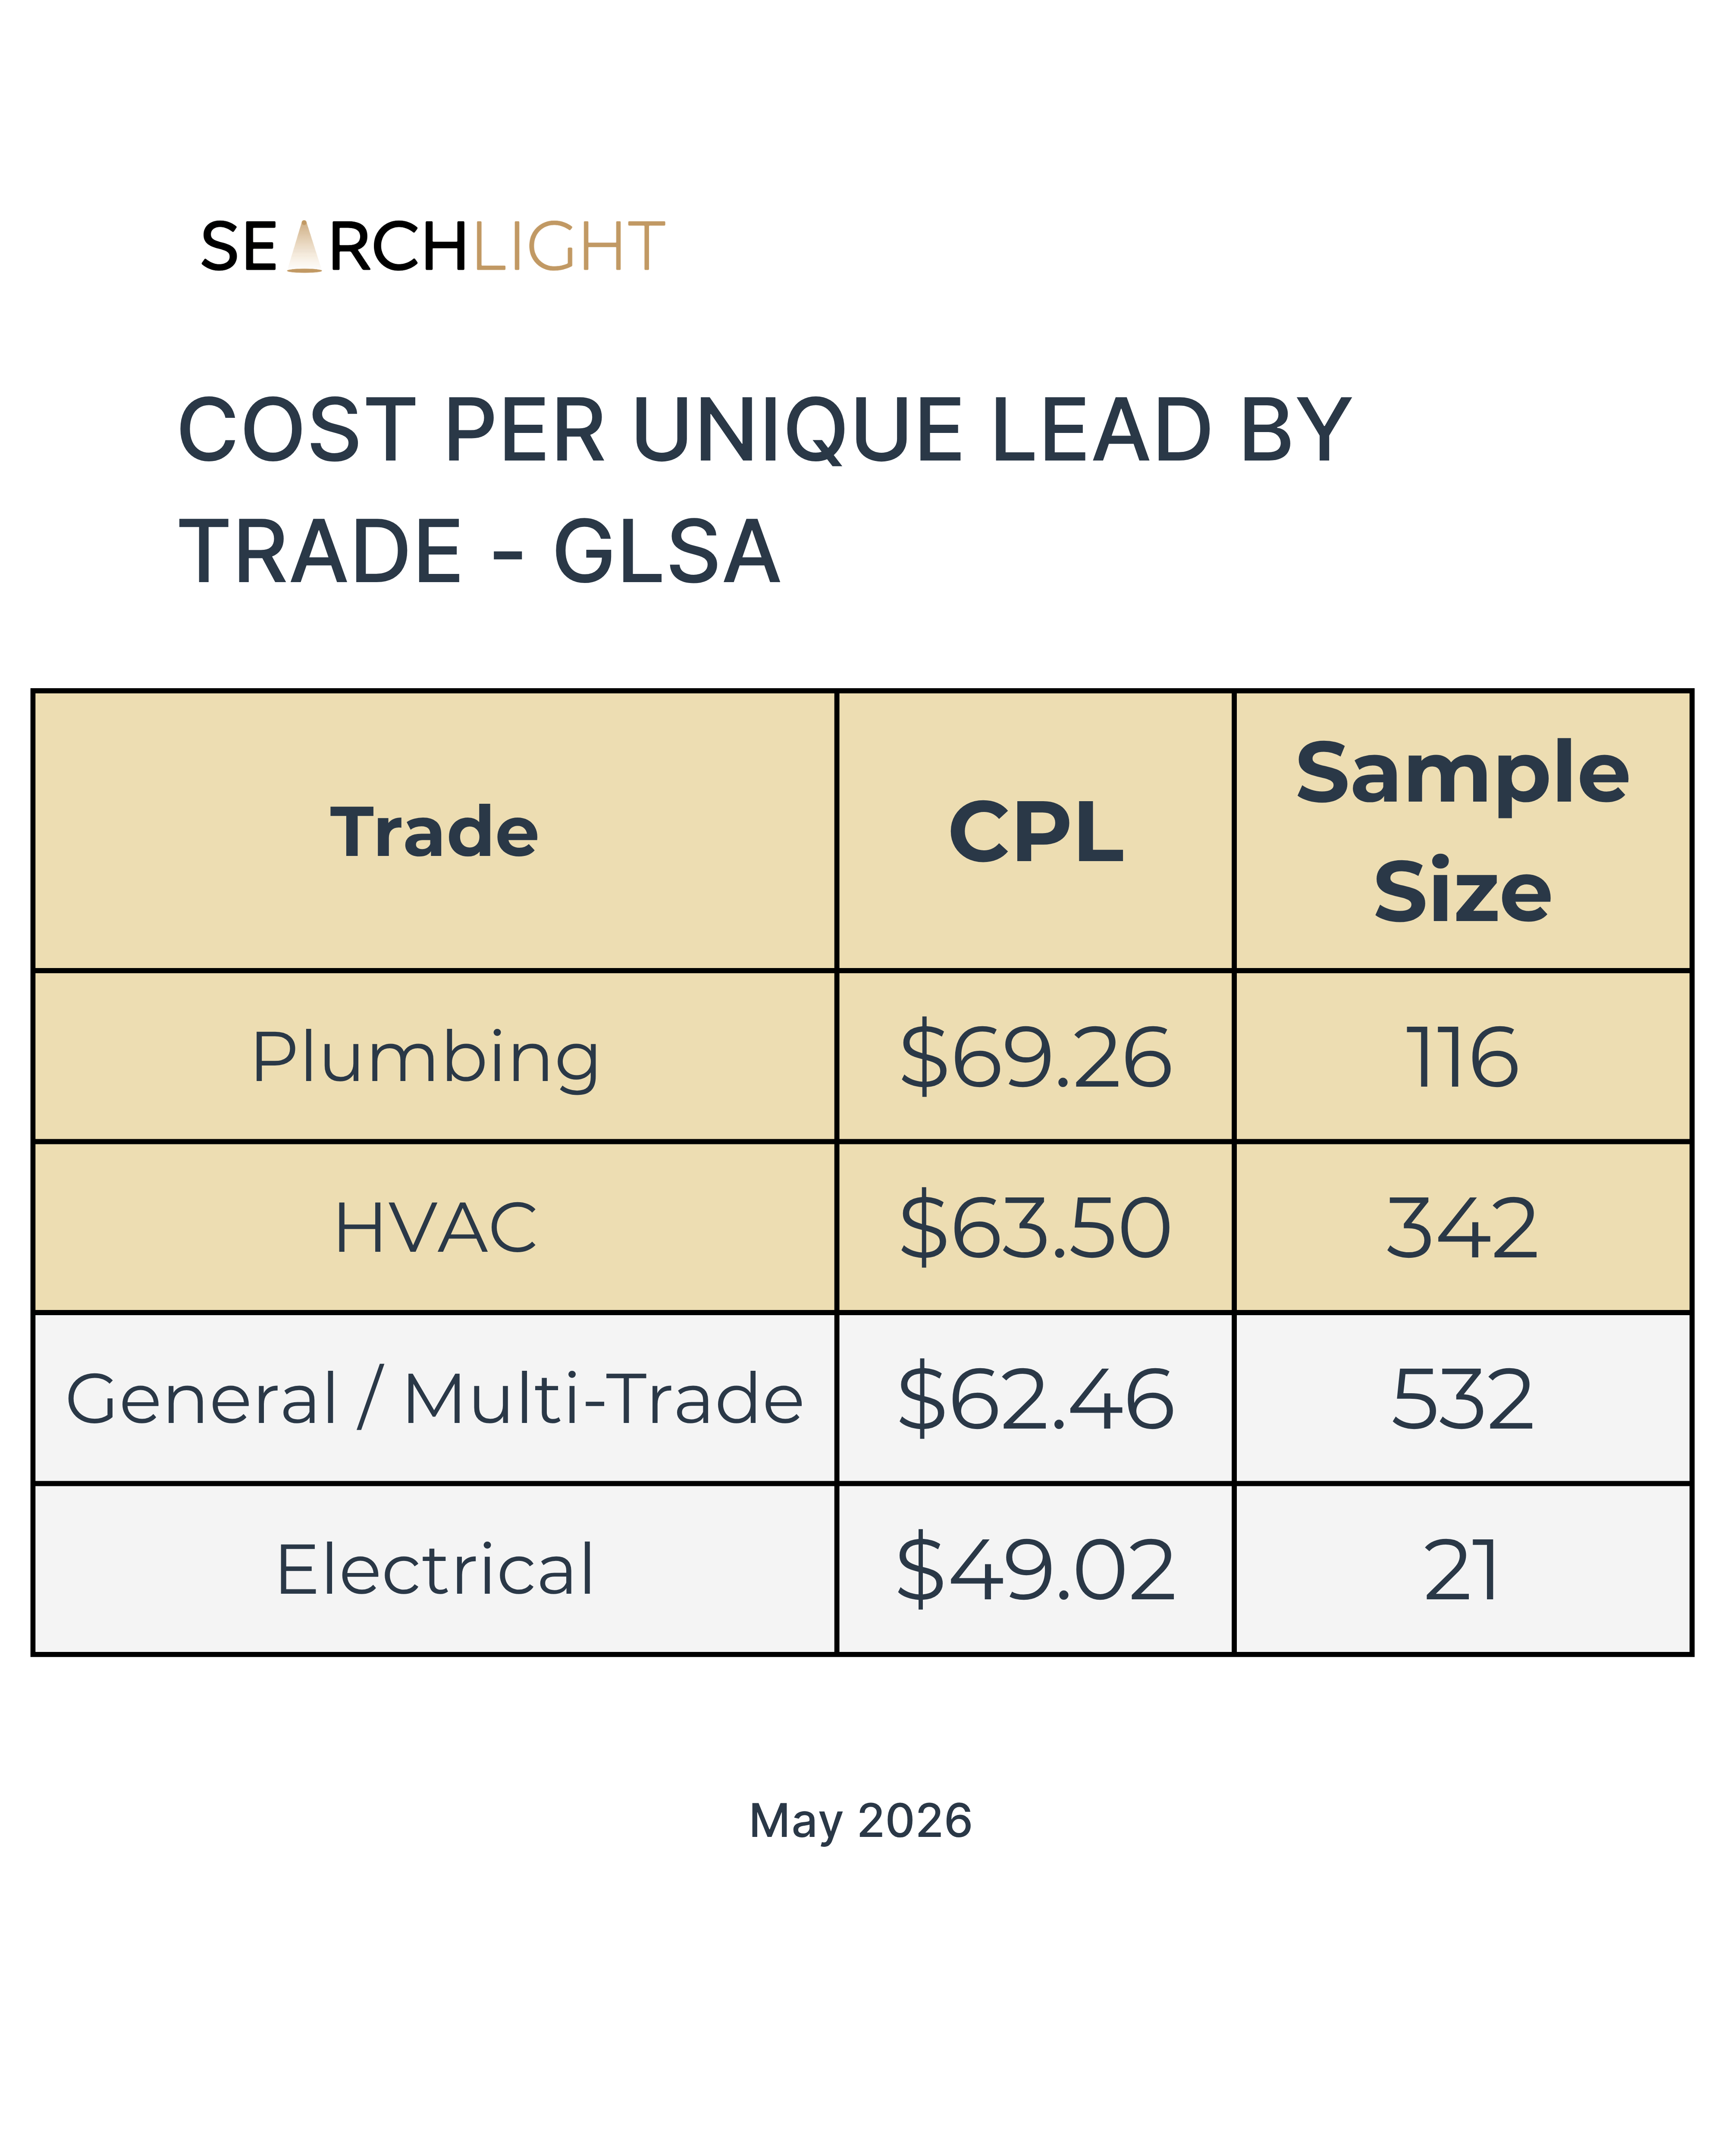
Plumbing came in as the most expensive trade to acquire a lead from GLSA at $69.26, about $6 more than HVAC. Electrical remained the lowest at $49.02, though with only 21 accounts in the sample, that number is more directional than definitive.
Worth noting: May’s overall CPL of $63.29 is up from $55.08 in March. Seasonal demand, competitive bidding, and market mix can all influence this, so keep that in mind when benchmarking your own performance.
Of the 154,593 unique leads generated, 63,249 booked an appointment, resulting in a raw book rate of 40.9%.
As always: “raw” means no leads were filtered out, even if they weren’t bookable. If you paid for 100 leads on GLSA in May, roughly 41 of them booked an appointment.
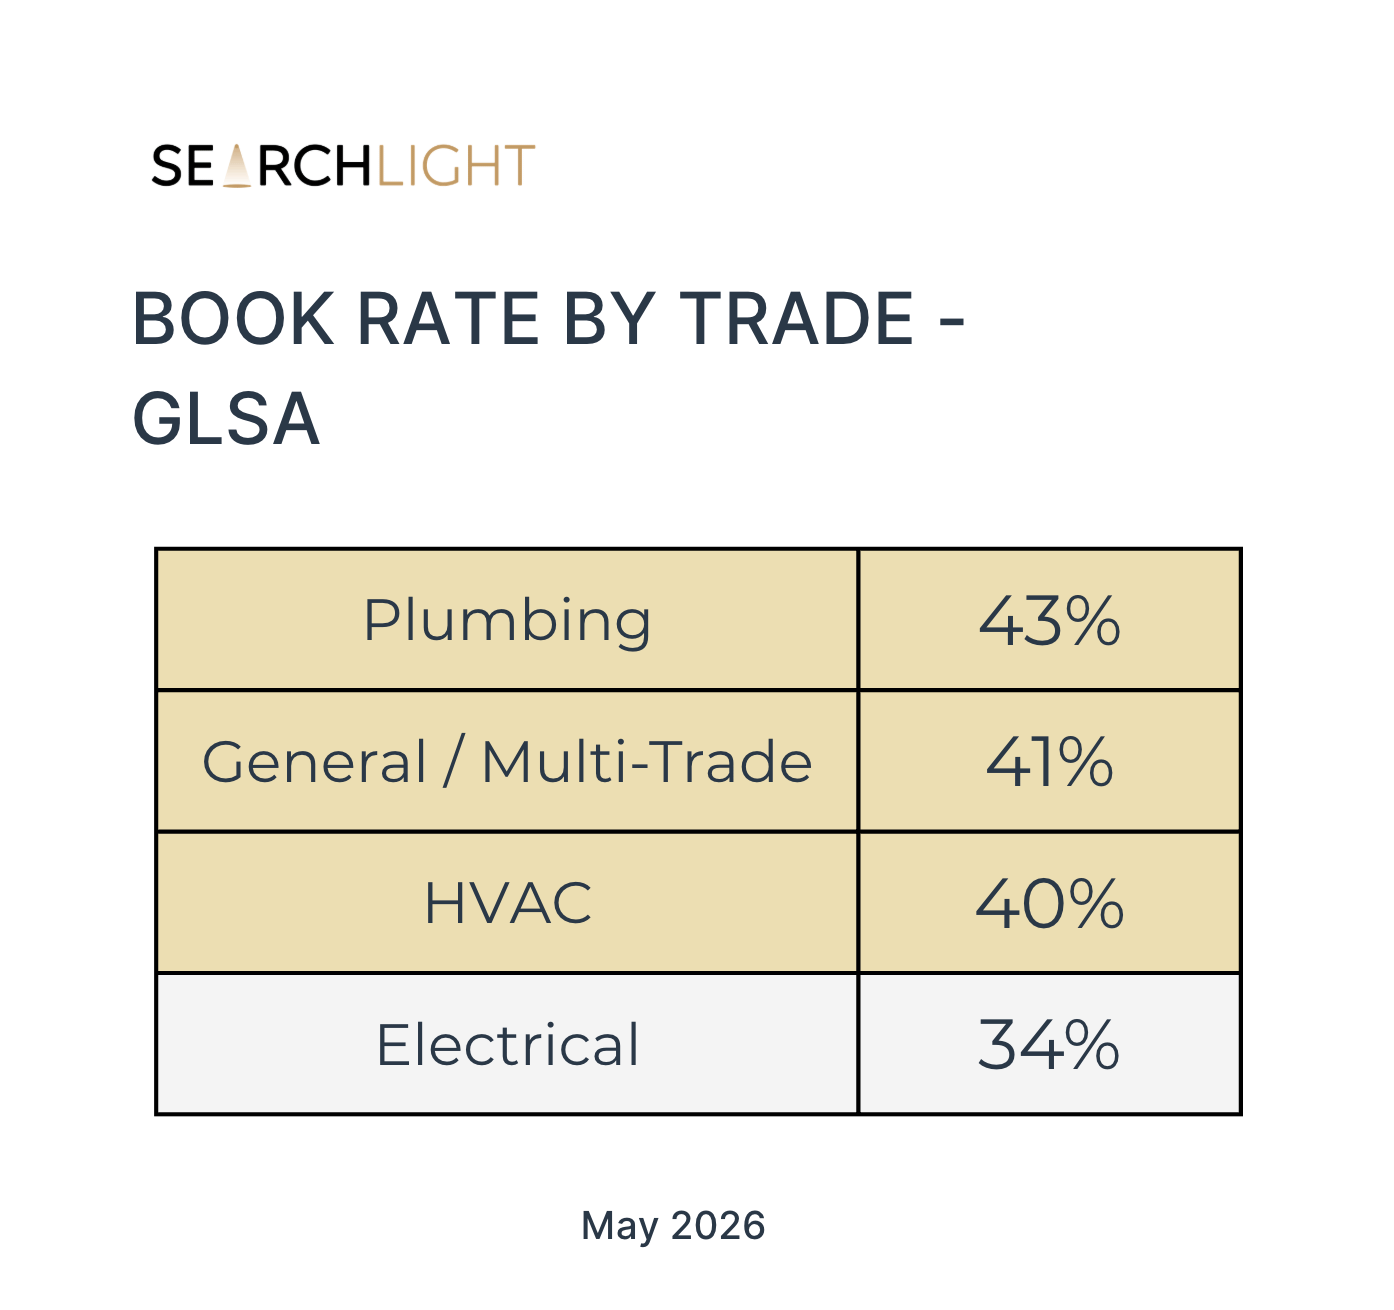
Plumbing led on book rate at 43.0%, consistent with the volume-and-velocity nature of plumbing service calls. Electrical's lower book rate (34%) is worth watching as that sample grows.
Across all trades, the cost to acquire a paying customer (an individual in a sold or closed state during May) from GLSA was $315.52.
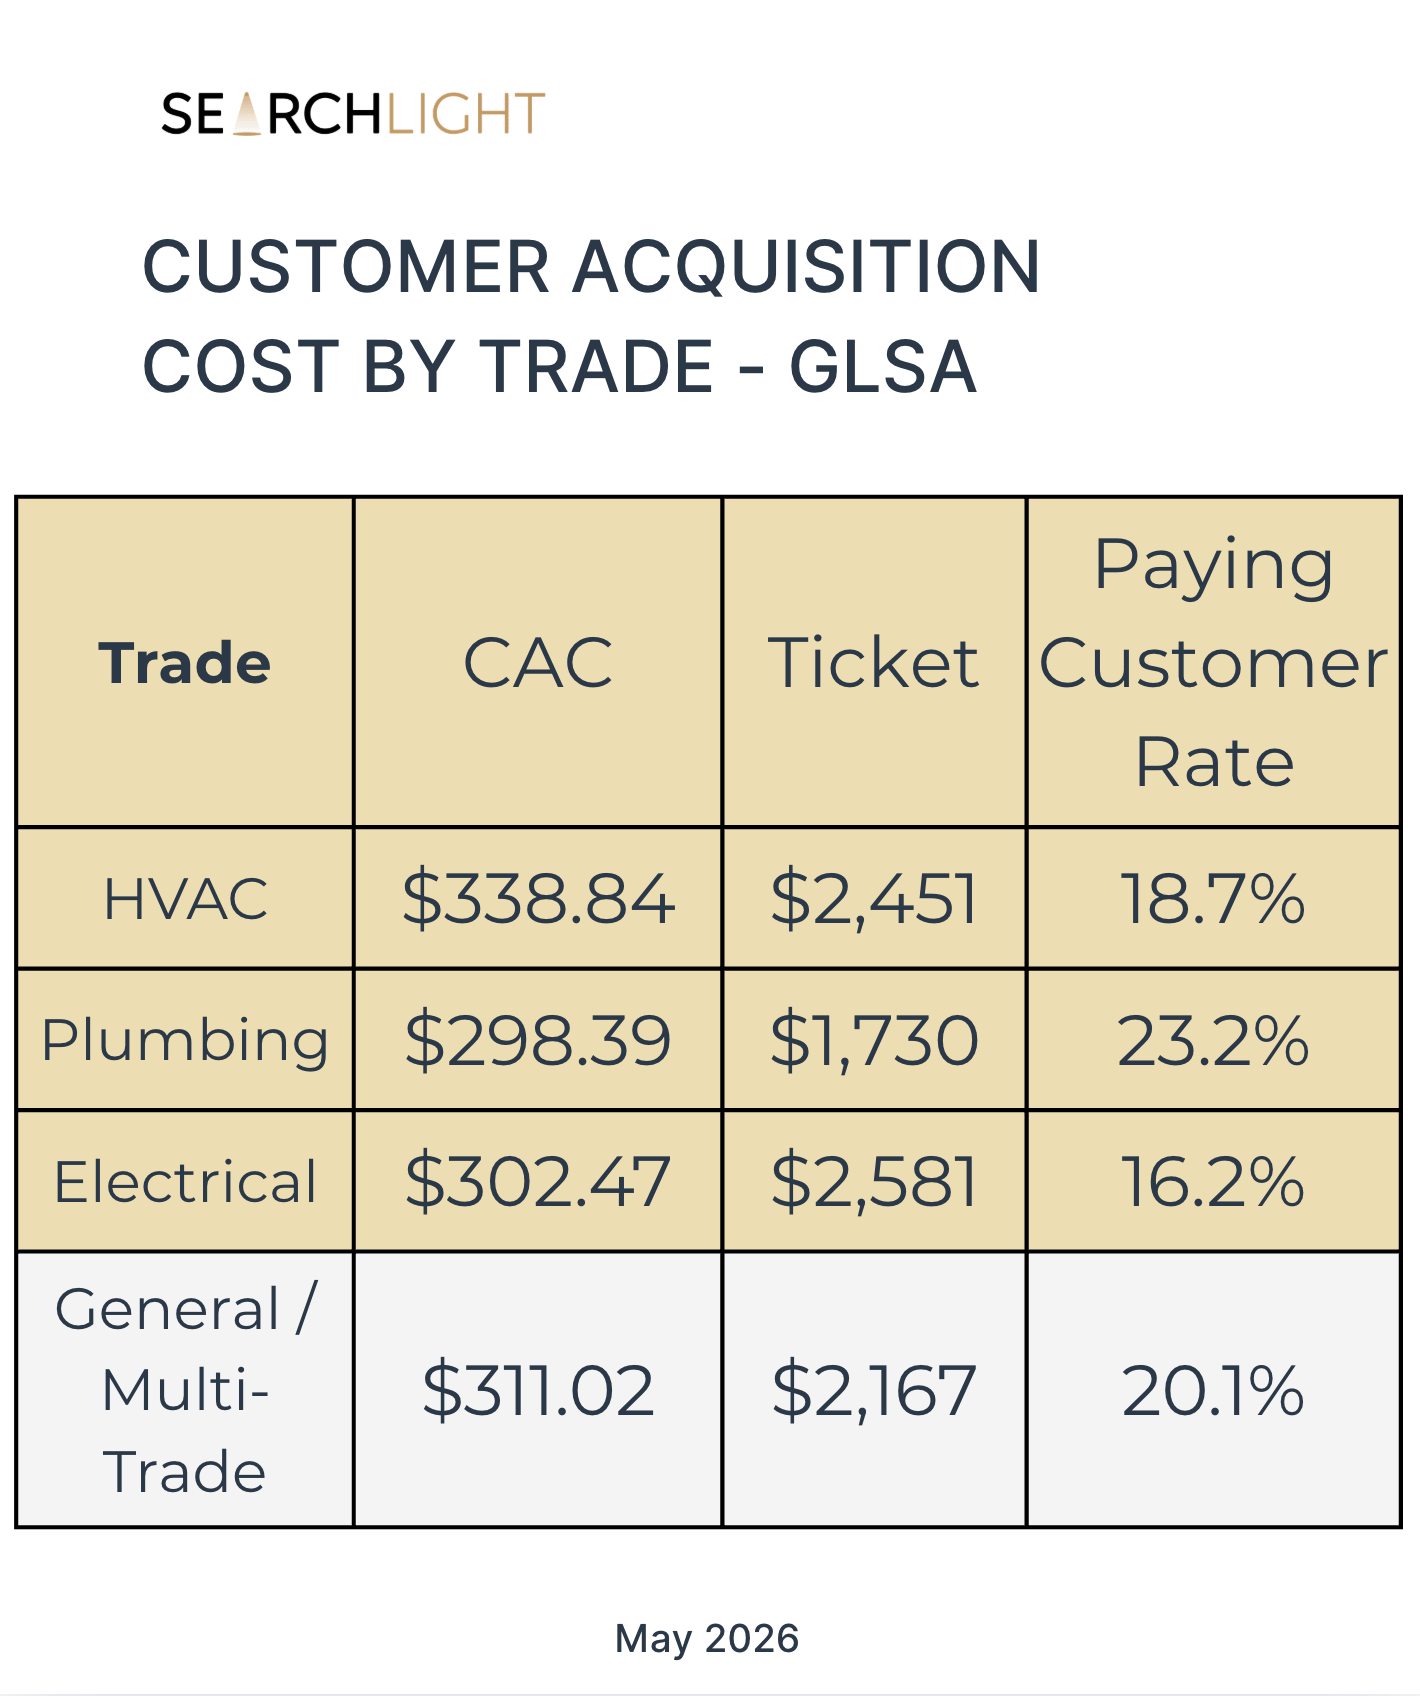
HVAC is again the most expensive trade to acquire a customer from GLSA, but it also commands the highest average ticket at $2,451.64.
Plumbing converts the highest share of unique leads to paying customers (23.2%), but at a lower average ticket.
Electrical has the most compelling ticket-to-CAC ratio if you can get the volume.
The same pattern from March holds: these are fundamentally different unit economics by trade, and “good” GLSA performance should be benchmarked within trade, not against an overall average.
On a per-business basis, GLSA generated an average of 30.7 paying customers in May.
GLSA generated $162,299,909 in total revenue opportunity across this sample in May.
That figure includes unsold estimates (one per customer, no double-counting), sold revenue (jobs sold but not yet completed), and closed revenue (work done and collected).
Every customer is in one bucket based on their latest activity.
Of that $162.3M pipeline:
$75,567,757 (46.6%) is in unsold estimates
$19,203,547 (11.8%) is in sold jobs not yet closed
$67,528,605 (41.6%) is closed revenue
That’s $162M in pipeline across 1,011 businesses, with nearly half sitting in proposals that haven’t converted yet. On a per-business basis, $74,745 in unsold estimates per business from GLSA alone.
To be clear: no business closes 100% of their estimates, and that’s not the point.
The point is to know what’s normal for your trade and catch it when you fall below that threshold.
In our data, businesses typically close 40-50% of revenue opportunity. If yours is trending below that, it’s usually an operational (follow-up) issue, not a lead quality issue.
Unsold estimate share by trade:
Electrical: 53.0%
HVAC: 47.7%
Plumbing: 46.2%
General / Multi-Trade: 46.0%
Electrical continues to have the highest share of revenue stuck in unsold estimates. If you’re running electrical GLSA, that pipeline follow-up process deserves attention.
GLSAs generated $6.90 in closed revenue for every $1 spent in May.
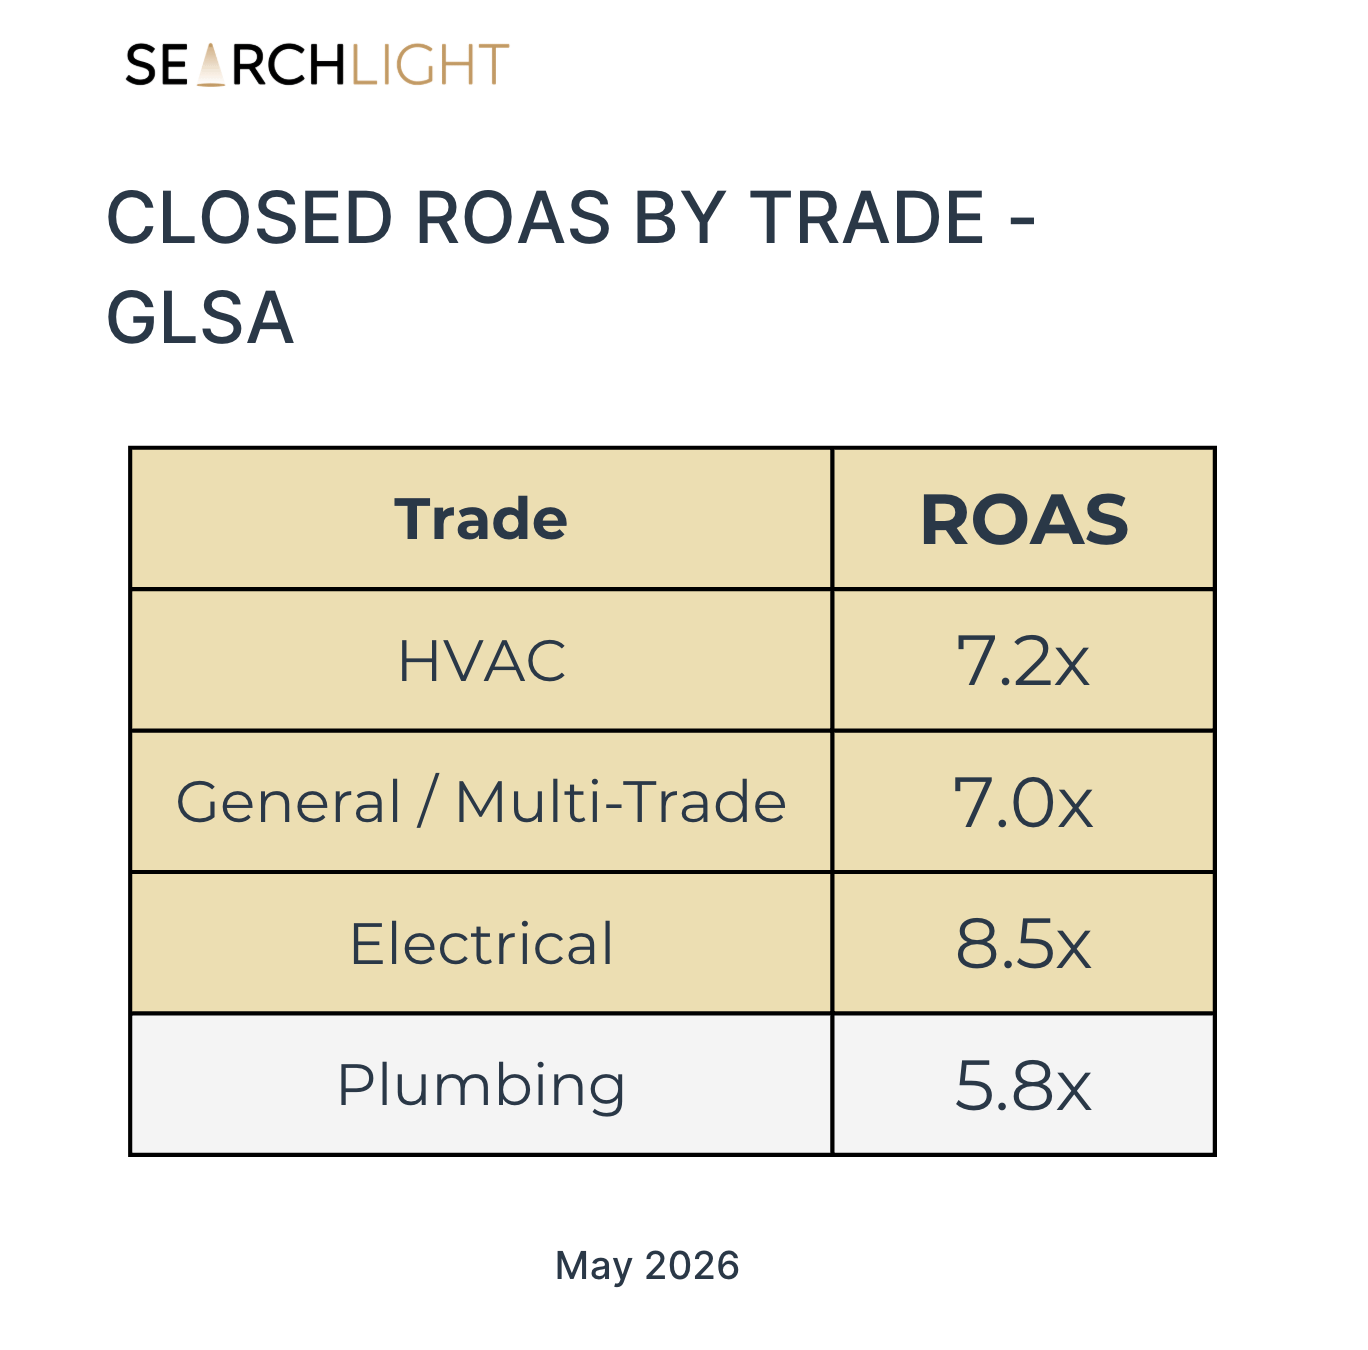
Electrical punches above its weight with an 8.5x closed ROAS driven by a strong average ticket relative to CAC, although again, small sample of data.
HVAC’s higher ticket offsets the higher acquisition cost, landing at 7.2x. Plumbing’s volume-and-velocity model compresses ROAS to 5.8x, the lowest of the three trades, despite having the best book and paying rates.
On a per-business basis, the average was $66,794 in closed revenue from GLSA in May.
Are you a SearchLight customer who wants access to premium benchmarks? I am running a beta for our new Data Lab Pro and am looking for customer feedback. If you want early access, shoot me an e-mail Jon@searchlightdigital.io.
Until next time . . .
-Jon
No posts
Comments
Nothing yet. Say the first thing.
Sign in to join the conversation.