

There’s an old saying in hockey that if your team is in a playoff berth by Thanksgiving, they will make it to playoffs by April. As a self-titled math nerd, I wanted to know if this old wives’ tale held water by building a model to test it out. This is version 1 of my Thanksgiving Predictor.
I love to make advanced stats available and understandable for everyone, not just other data people, so in order to make sure we are all on the same page when it comes to my language, open up this page to follow along in the data primer.
I took standings data from the NHL API from the last 25 years (2000-2024), as well as summary game data for every game played by every team. I also created a few metrics of my own. If you want a complete rundown of everything I did to the data, you can head over to this post. It will be updated with more details as the model grows, too.
Before I got started with my analysis, I divided my data frame by conference because the NHL does not give a playoff stop to the top 16 teams in the league; rather the top 8 teams in each conference are awarded playoff spots. What it takes to make the playoffs in the East is not necessarily the same as in the West, as we have seen many times over the last 25 years. In 2024, for example, the East is considered fairly weak compared to the West.
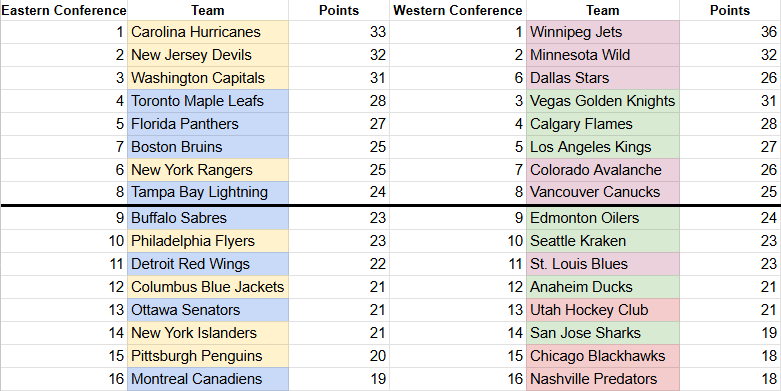
For some context, here are the standings on November 28th, 2024:
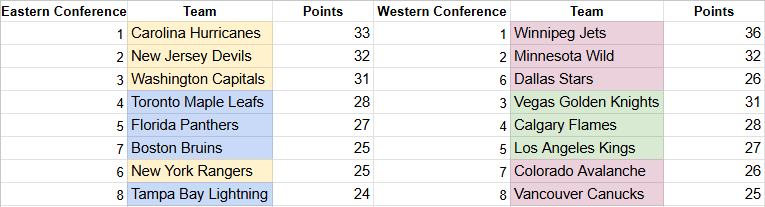
Playoff standings are typically ordered by division with the top three teams in each division being granted a playoff spot and then the next two teams in the conference are granted a wildcard slot.
As you can see above, if the playoffs started on November 29th, 2024, the Western Conference would have two wild card teams from the Central Division while the Eastern Conference would have one team from the Atlantic and one team from the Metropolitan Divisions in the wild card.
While the actual date of American Thanksgiving may change from year to year, the average number of games played by all teams over the last 25 years is 20.9 games - or approximately 25% of the season. This is still fairly early in the year, so can this marker actually predict the probability of a playoff berth? Kind of.
Teams in a playoff position by Thanksgiving have a 79% chance of making it in the Eastern Conference and 77% chance in the Western Conference.
That seems like a pretty reliable measure, right? Sure, but maybe there are other features we can add in to really find a reliable predictor at this point.
We know that the quality of competition matters when determining if a player is really good, so it makes sense to look strength of schedule at the team level. It’s generally accepted that teams that play well against both weak and strong teams makes that team a strong team.
But would a team that only wins against weak opponents really make it to the playoffs in the long run?
After all, it’s not a 100% certainty of making it to the playoffs at this point; it’s still less than 80%. Before exploring those features, I wanted to have a better understanding of those teams that either pull off an upset and make it into the playoffs and teams that completely blow it and spiral out of contention.
If you are a Bruins fan like I am, you know that a late-surging team can sneak up on us (ahem, 2019). For my purpose, a “Late-Surge Team” is one that was not in a playoff position at Thanksgiving, but did make it into the playoffs at season’s end. A “Drop-Out Team” is one that was in playoff position at Thanksgiving, but failed to make the playoffs at year’s end.
So what kind of position are these Late-Surge Teams in at Thanksgiving? And what about teams that were in a playoff spot at the holiday and didn’t quite cross the finish line in April?
I explored some different, common statistics to get a sense of where these particular teams were positioned in relation to that 8th place cut-off point in each conference. I was a little surprised by some of the results.
Things in the East are definitely more loosey-goosey and competitive than in the West. Elliot Friedman coined the phrase “doodlebug race” to describe just how uncertain the final standings in the Eastern Conference were at the end of the 2023-2024 season. The final results weren’t set in stone until the absolute last day of the regular season!
For these teams, on Thanksgiving Day, I found:
Average points distance below 8th spot: -3.4
Median points distance below 8th spot: -3.0
Most frequent points distance below 8th spot: -2.0
By the end of the season, these teams improved on their points percentage:
Avg change in points percentage by end of season: +0.09
For the these teams, I found that they held the following stats on Thanksgiving Day:
Average points distance above 8th spot: 2.19
Median points distance above 8th spot: 1.0
Most frequent points distance above 8th spot: 0.0
And by the end of the season, they had decreased their points percentage:
Avg change in points percentage by end of season: -0.1
It would appear that Drop-Out Teams were most frequently in that 8th place, second wild card (WC2) position at Thanksgiving, while Late-Surge Teams were one win (2 points) behind the cutoff.
If you need help deciphering the visuals below, remember to check out the data primer.
Comparing these two groups of teams, you can actually see the variability and volatility around the 8th position in standings. The “fatness” of these peaks (spread) indicates that all hope is not lost for teams outside of the playoff structure. Hence, last season’s doodlebug race.
Also note the height of the density peak for both late-surge (~0.170) and drop-out teams (~0.180); this will be important later when comparing the results from the East to the West.
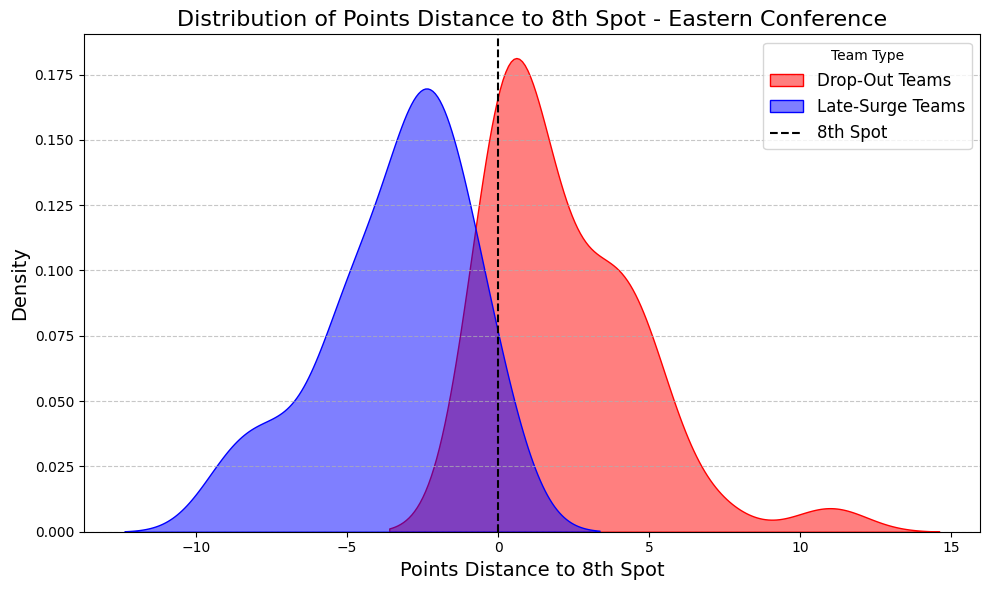
What does this look like in reality? It might not be totally out of the realm of possibility for a team in 11th spot at Thanksgiving to make it into the playoffs by the end of the season.
In the 2000-2001 season, the Washington Capitals were in 11th place with 17 points and 5 points out of a playoff spot at Thanksgiving, but they finished the season in third place in the East!
This 5 point gap isn’t even the largest discrepancy a team has had to overcome to make it into the playoffs. Two teams have held -9 points to that 8th place spot over the last 25 years:
2007-2008 Washington Capitals
2020-2021 Ottawa Senators
The situation out West is a little different, compared to the East. There is less spread and there is a lot less variability for those teams on the bubble. It would appear that the Thanksgiving standings are a bit more firm.
For these teams, on Thanksgiving Day, I found:
Average points distance below 8th spot: -2.02
Median points distance below 8th spot: -1.0
Most frequent points distance below 8th spot: 0.0
Interestingly, the average improvement in points percentage by the end of the season for teams that were late-surging was the same as in the East:
Avg change in points percentage: +0.09
For the these teams, I found that they held the following stats on Thanksgiving Day:
Average points distance above 8th spot: 2.29
Median points distance above 8th spot: 2.0
Most frequent points distance above 8th spot: 0.0
By the end of the season, teams that fell out of the playoff structure had a much higher drop in points percentage compared to their Eastern counterparts:
Avg change in points percentage: -0.09
You may have noticed that both kinds of teams have a points distance above or below the WC2 of 0 - how can that be? I go into more detail further down, but essentially, these teams are all tied for 8th place in terms of points.
Looking at the two groups of teams in the Western Conference, the variation is much lower around the bubble; meaning teams that are less likely to really move up and down on either side of that 8th place cutoff point.
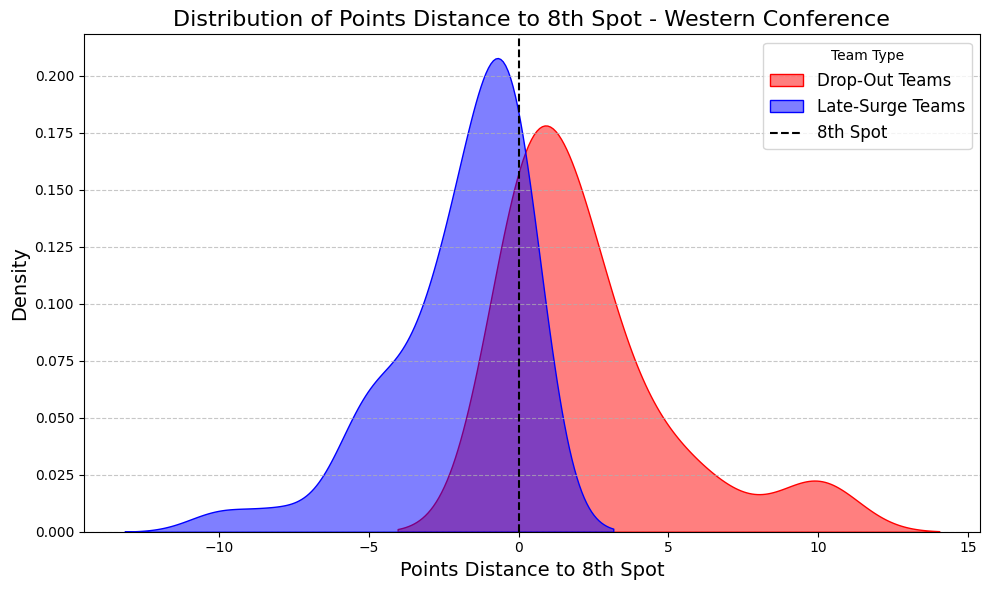
Just because this graph shows much less spread, doesn’t mean that a team incredibly far behind can’t make the playoffs in the West.
The largest jump any team has made out west was overcoming a 10 point deficit to reach the playoffs. And it should come as no surprise that it was the 2023-2024 Edmonton Oilers.
Remember I told you to remember the density peaks in the Eastern Conference graph?
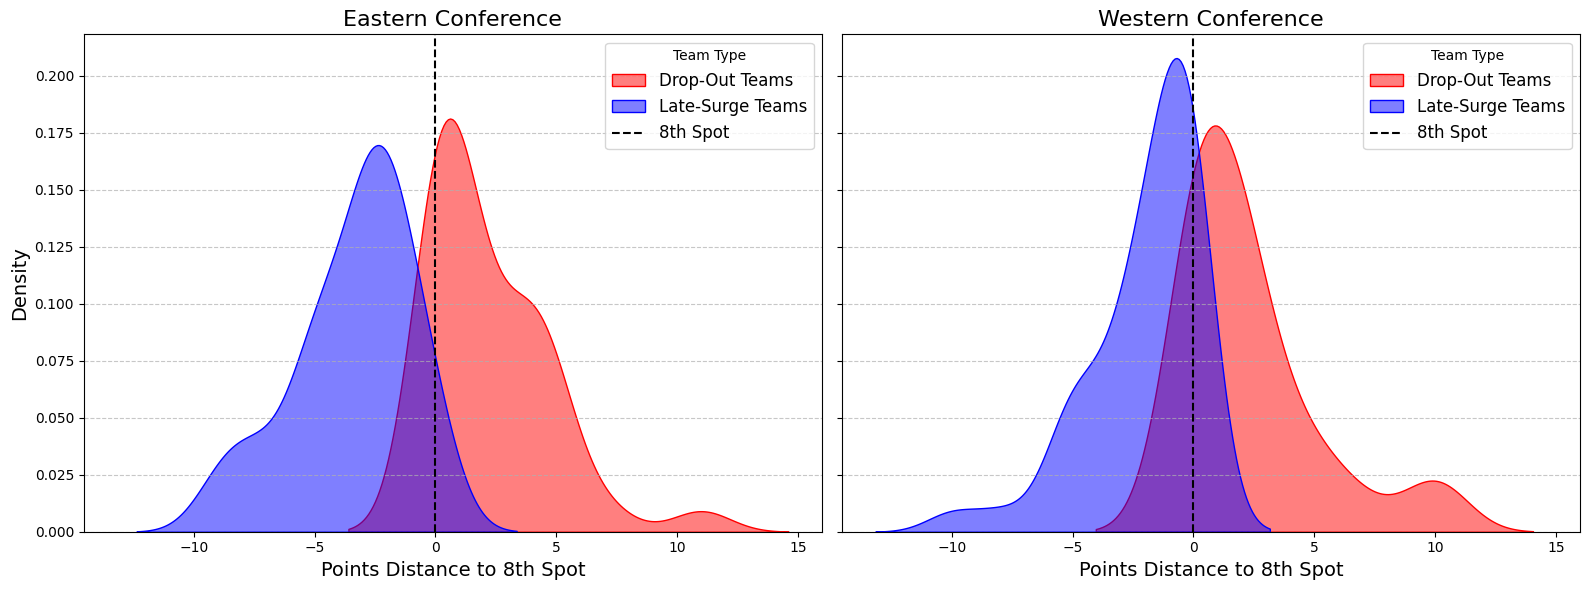
The peak for late-surge teams in the West is over 0.200 compared to ~0.170 for the East and the peak for drop-out teams in the West (~0.180) is quite similar to that in the East (~0.180)
TL;DR: when it comes to the East, a lot can happen between Thanksgiving and the end of the season, especially compared to the West.
There haven’t ties in NHL hockey since the 2005-2006 season and there have always been tiebreakers when it comes to the standings. There are seven (!) tie-breaking steps for the standings, per the NHL website.
First and foremost, teams are awarded two points for a win or overtime win, zero points for a loss, and one point for an overtime loss. If two teams have the same number of points in the standings, the positions are determined by:
The fewer number of games played (i.e., superior points percentage).
The greater number of games won, excluding games won in Overtime or by Shootout (i.e., 'Regulation Wins'). This figure is reflected in the RW column.
The greater number of games won, excluding games won by Shootout. This figure is reflected in the ROW column.
The greater number of games won by the Club in any manner (i.e., 'Total Wins'). This figure is reflected in the W column.
The greater number of points earned in games against each other among two or more tied clubs. For the purpose of determining standing for two or more Clubs that have not played an even number of games with one or more of the other tied Clubs, the first game played in the city that has the extra game (the 'odd game') shall not be included. When more than two Clubs are tied, the percentage of available points earned in games among each other (and not including any 'odd games') shall be used to determine standing.
The greater differential between goals for and against (including goals scored in Overtime or awarded for prevailing in Shootouts) for the entire regular season. This figure is reflected in the DIFF column.
The greater number of goals scored (including goals scored in Overtime or awarded for prevailing in Shootouts) for the entire regular season. This figure is reflected in the GF column.
NOTE: In standings a victory in a shootout counts as one goal for, while a shootout loss counts as one goal against.

You can see in the example above with the Chicago Blackhawks and the Nashville Predators - they both have 18 points, but Chicago is in 15th place over Nashville because of their respective points percentage.

In the case above, the points percentage tiebreaker doesn’t come into play because the Bruins and the Rangers are in different divisions. For the Bruins, there are only two teams ahead of them within the Atlantic Division, while there are three teams ahead of the Rangers in the Metropolitan Division.
Not taking the points percentage tiebreaker into account is the reason why Late-Surge Teams and Drop-Out Teams most frequent distance from 8th place is 0.
By Thanksgiving 2024, the race to make it to a playoff spot in the East was fairly close, which makes a lot of sense if you consider how much variability exists in the graph above. The last place Montreal Canadiens were only 5 points behind the second wild card spot, but in the West, the Nashville Predators were 7 points back.
For teams in the playoff structure, every day and every game closer to the final day of the season increases the odds that they make it to the post season. But what if we already have all of the information we need by Thanksgiving in order to build a reasonably accurate model to predict which teams make it only 25% of the way into the season? That’s what’s coming up next in version 2!
Comments
Nothing yet. Say the first thing.
Sign in to join the conversation.