
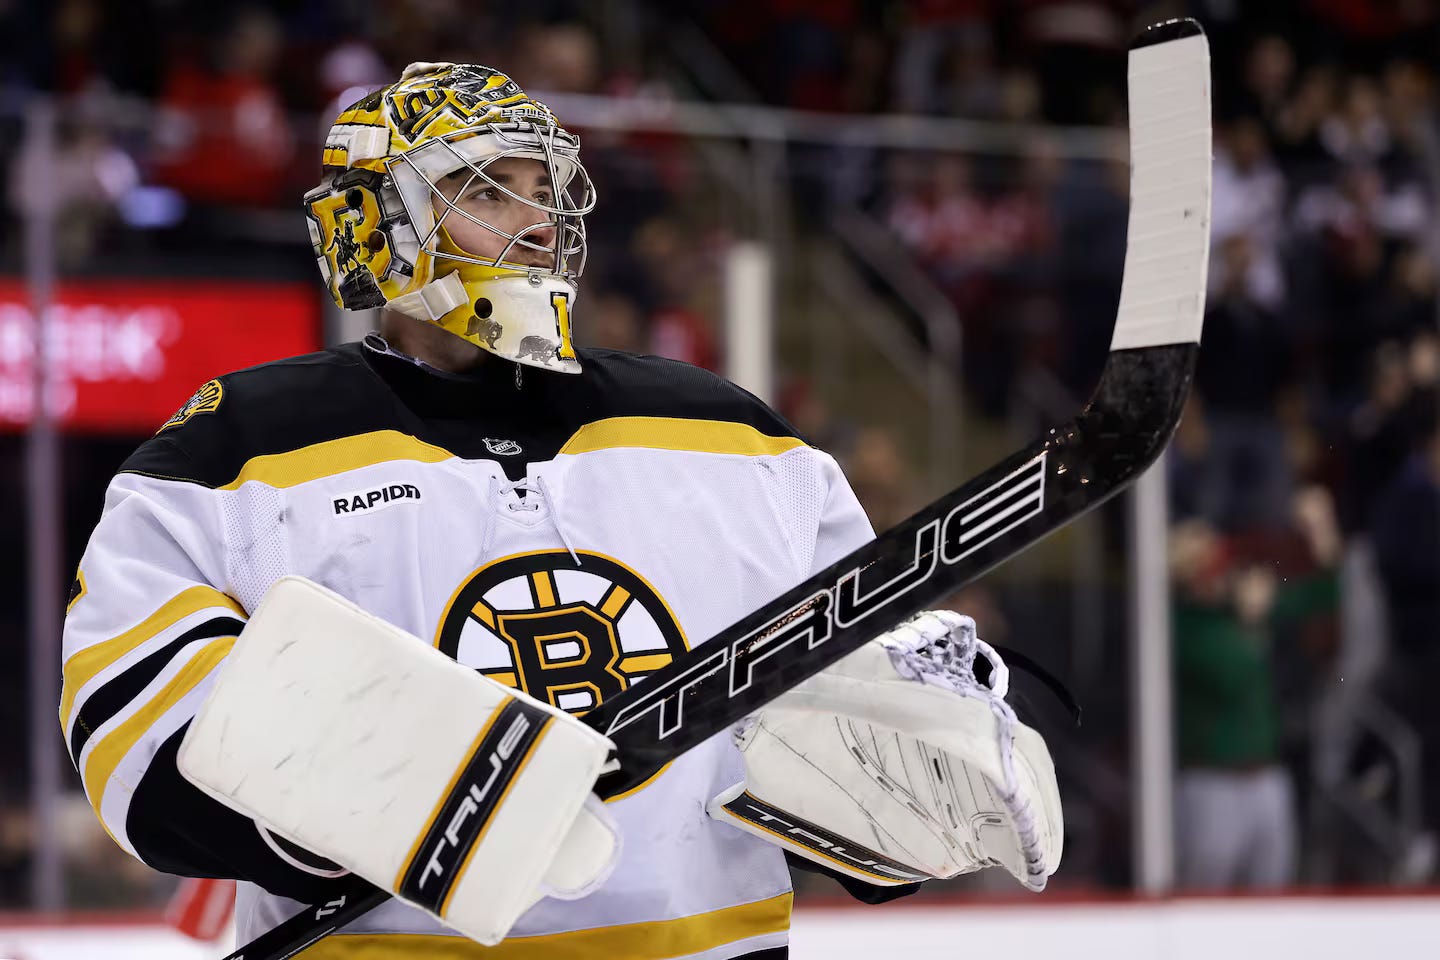
In a recent podcast episode I called the Bruins defense “Swiss Cheese”. It seemed like they stopped playing a tight defensive game (forwards included here) at the very start of January and it’s only gotten worse. I didn’t realize just HOW much worse it was until the color analyst during the Bruins/Panthers game pointed out that the Panthers made over 100 shot attempts in the game during regulation. From that moment on, it seemed like Boston could not get out from this bizarre hole.
If you are a member of our discord, you’ve heard me talk about my favorite old-school metric, Shots On Goal (SOG). I like to keep an eye on that during a game to get a sense of how well the offense or defense is clicking out there on the ice. The Bruins are getting embarrassed nearly every night this month with not only shamefully low SOG but also a disgracefully high SOG count by the opponent. I had to see what was going on.
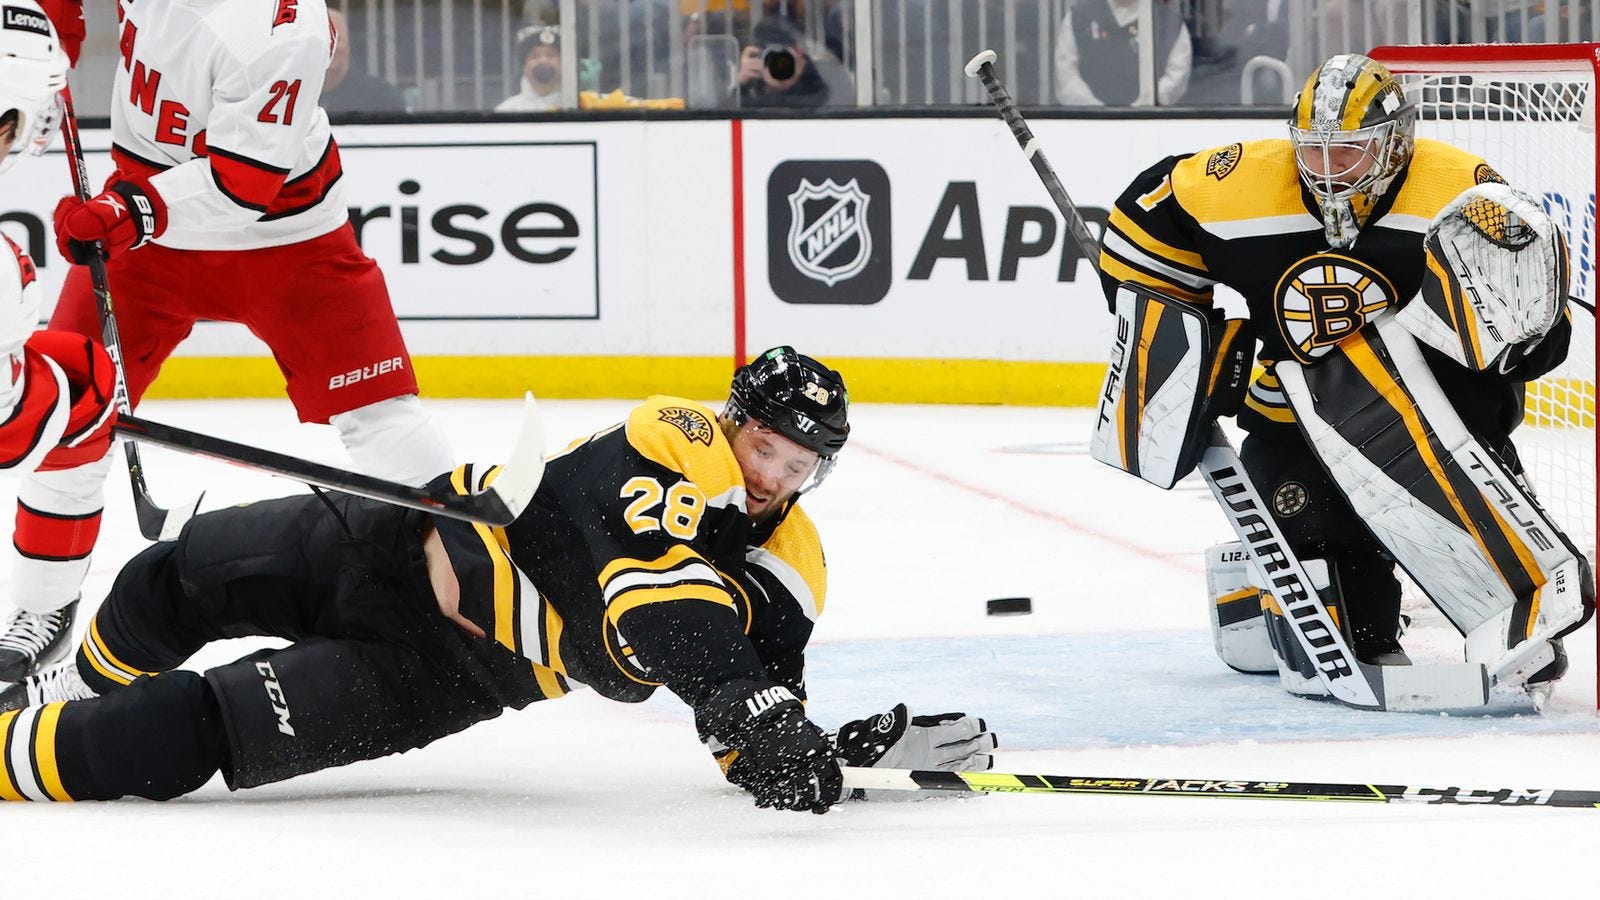
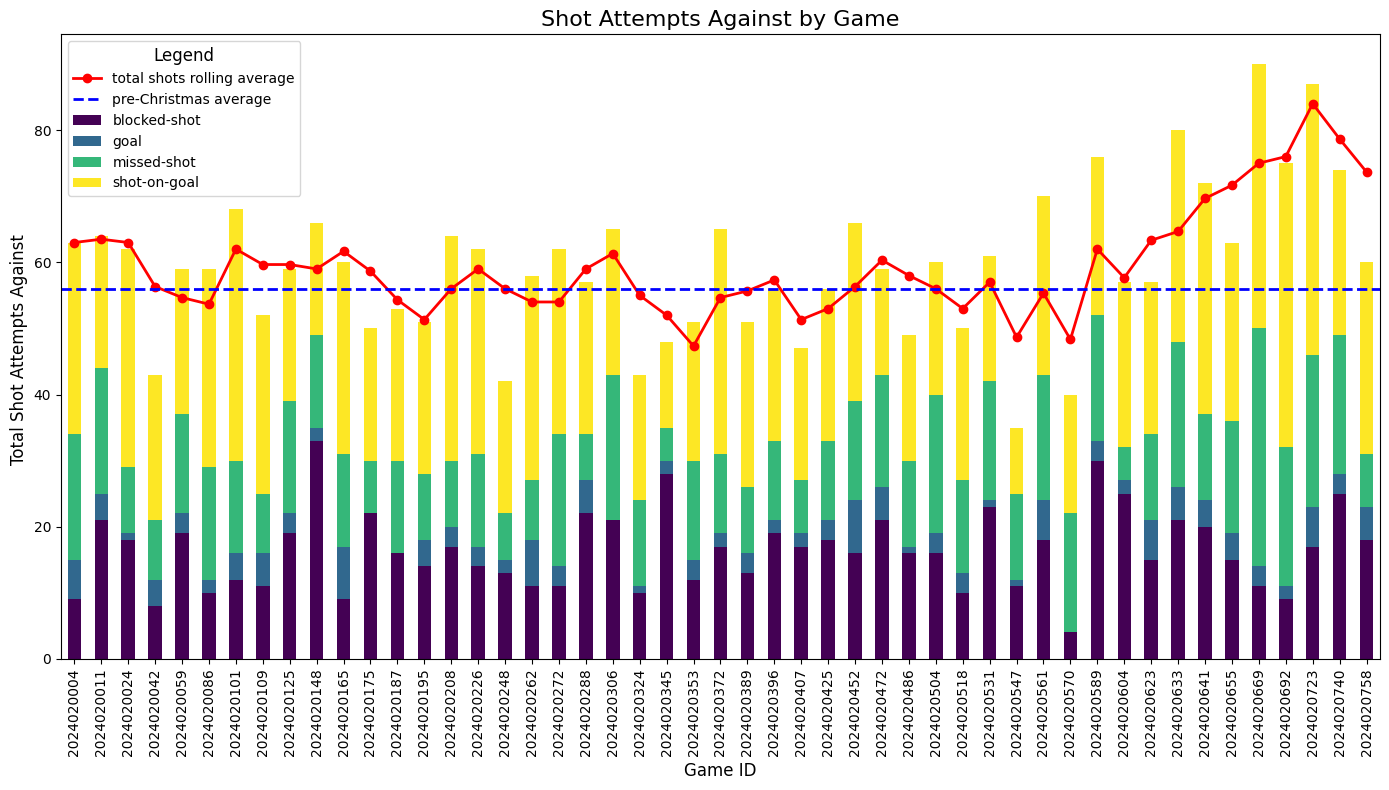
I pulled my data from the NHL API including the shot data from every game this season (2024-2025). I made sure to only pull shots/shot attempts (S/SA) made by the opposing team against Boston. To keep things simple, I only looked at regulation shots and all of the data is current up through January 22, 2025.
Blocked shots are recorded as a stat belonging to the team that stopped the shot, not the shooting player as an attempt for.
The Bruins “situation” began after Christmas, so I have designated that as the dividing point. Pre-Christmas break, the Bruins were averaging approximately 56 S/SA against per game. To try and smooth out how that averaged moved through the season, I took a rolling average of those total S/SA so I could look for trends without getting distracted by outlier games. I was honestly shocked at just how much of a steady increase in total S/SA the Bruins experienced at that Christmas break mark.
I had to get a closer look at those games post-Christmas. In the span of 13 games, the Bruins were at or below their pre-Christmas average S/SA only 3 times.
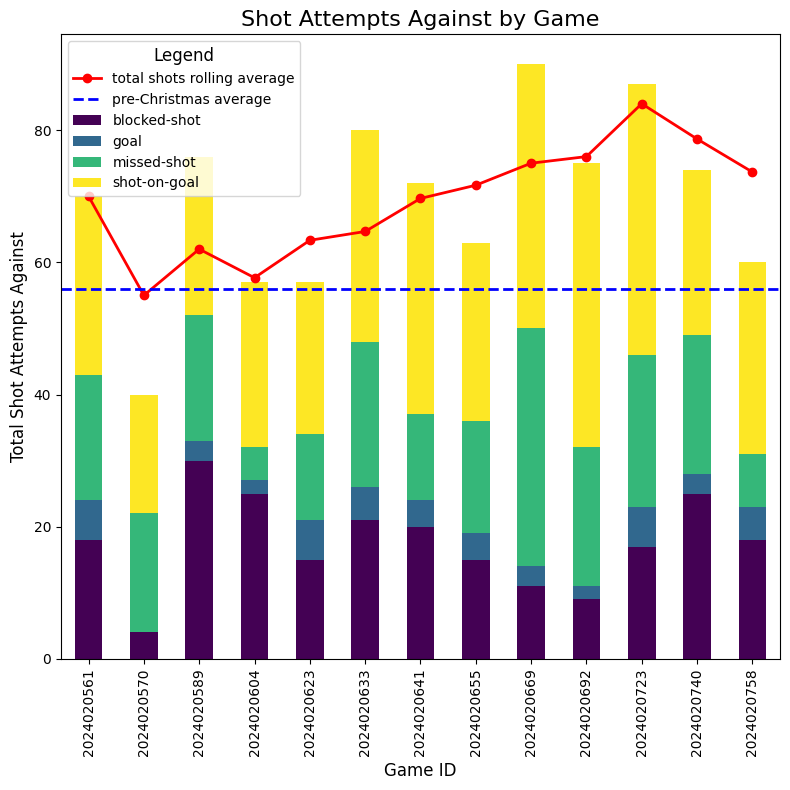
You can see in the table below who the Bruins’ opponents were during this stretch of time. But is this bad puck luck? The Hockey Gods playing with the Bruins? Testing them?
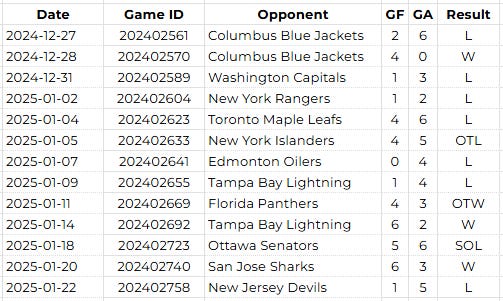
Well…not exactly. It would seem that the Bruins, a team primarily known for it’s defensive structure, have started to stink. The defensemen and forwards are not playing the classic defensive game this franchise is famous for. You can really see the change in this graph below from the pre-Christmas time to the post-Christmas time.
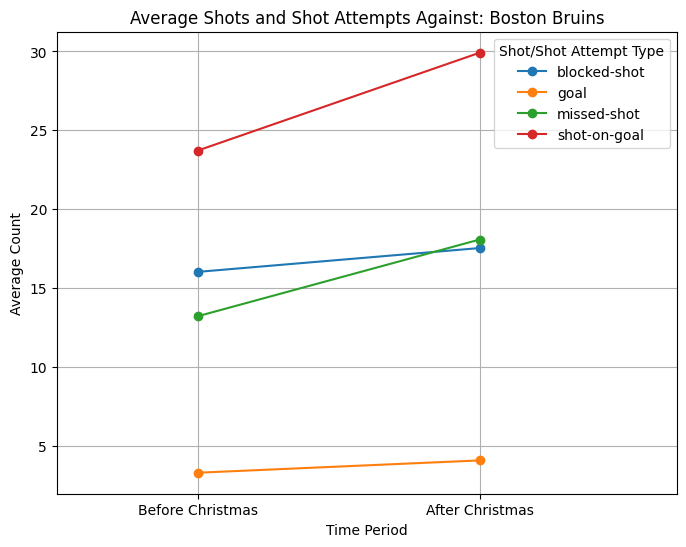
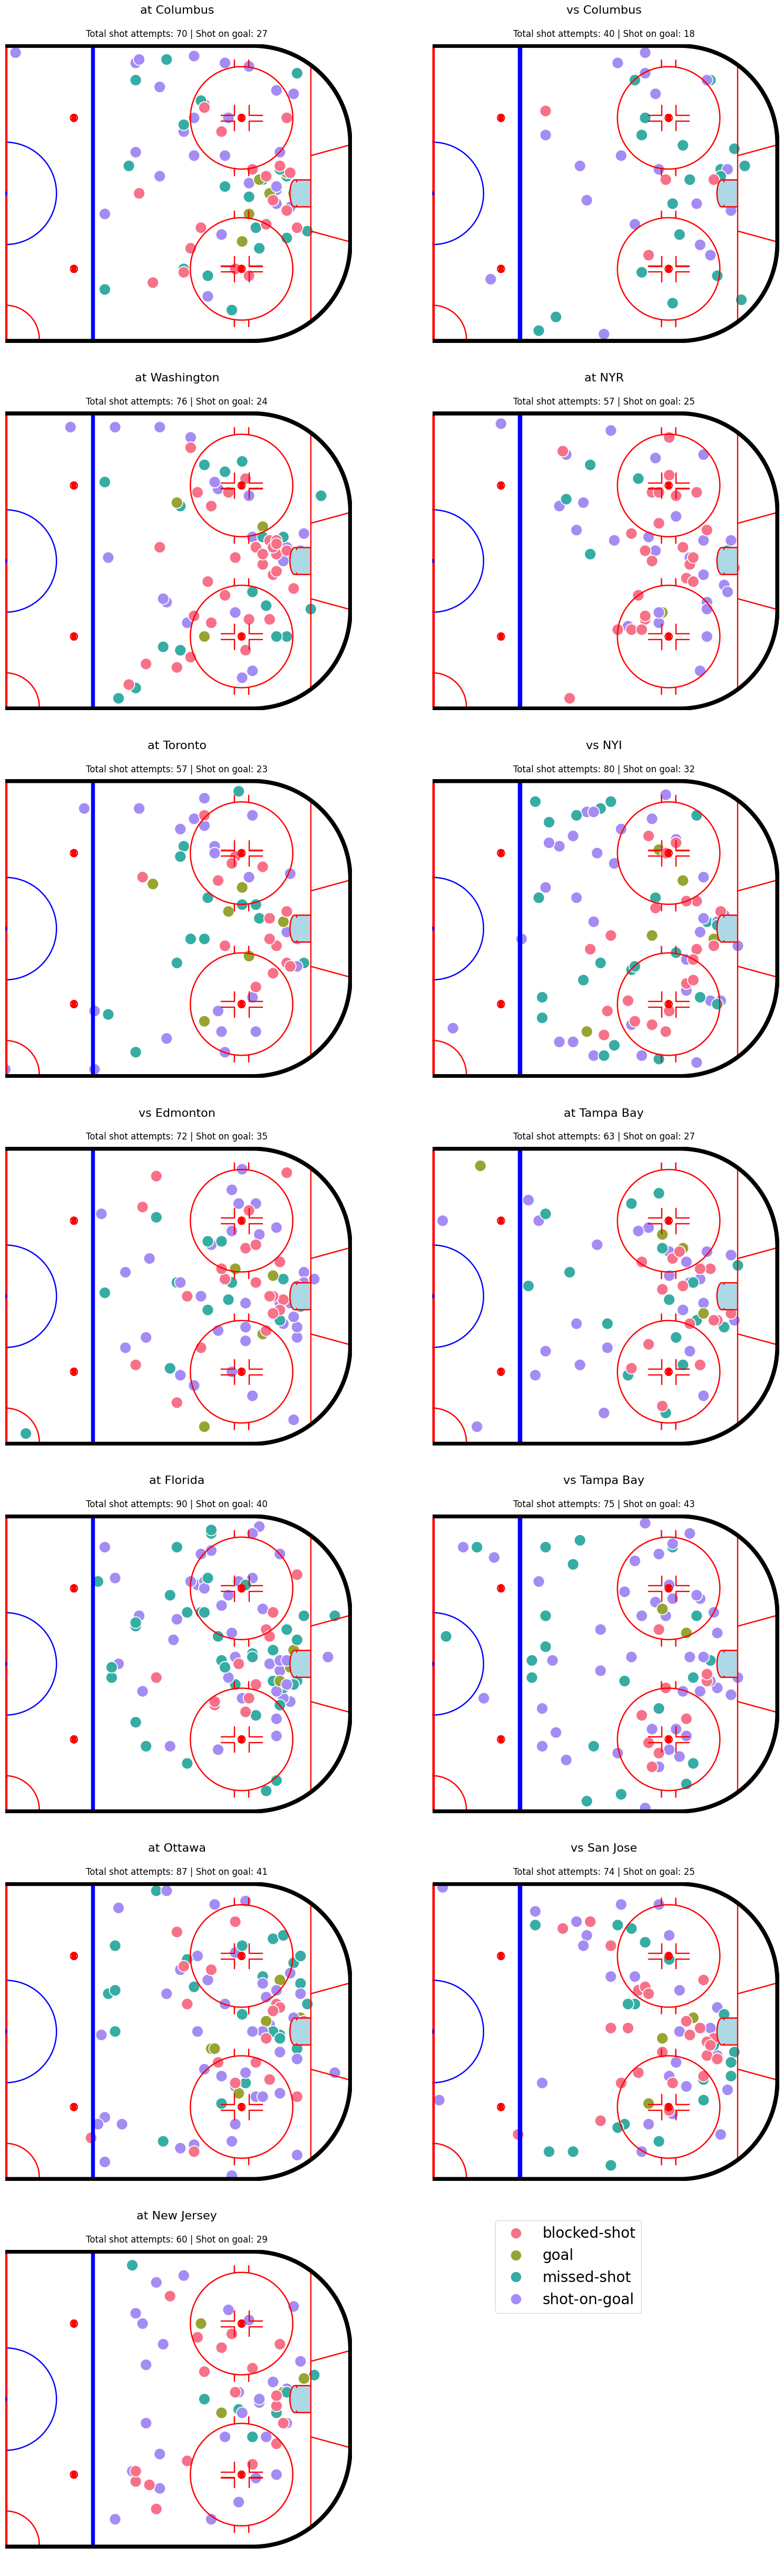
We’ve seen a sizeable increase in shots on goal as well as general shot attempts that miss the net. Even if we tighten up the problem stretch to a shorter date range from January 2, 2025 to present, an overhead view of shots placed on an ice rink map shows just how frenetic things have gotten in the last 9 games.
Is this just a Bruins problem? What about the rest of the league? Maybe everyone is struggling like this. Afterall, we’ve heard how the league average save percentage for goalies is below .900.
Well, the Bruins are recording about half as many blocked shots compared to the rest of the league. And this tracks; after the departure of Derek Forbort in the 2024 free agency, it left the Bruins with nobody to pick up the mantle of…throwing their body in front of bullet-pucks. But are they simply not blocking the shots and those attempts end up as goals, missed-shots, and/or shots-on-goal? Or is it something else?
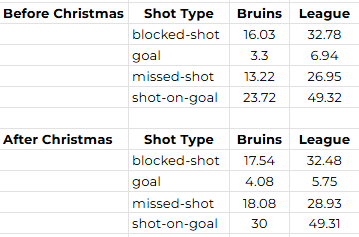
What this table above does tell us that, yes, the Bruins still are doing better than the rest of the league when it comes to defensive stats. they allow fewer average goals, fewer shot attempts (missed-shots), and fewer shots on goal.
What’s not great is the fact that the rest of the league has maintained a pretty steady pace before and after Christmas when it comes to average S/SA counts. The Bruins, on the other hand, have seen an increase in average goals allowed per game, shot attempts (missed-shots), and shots-on-goal.
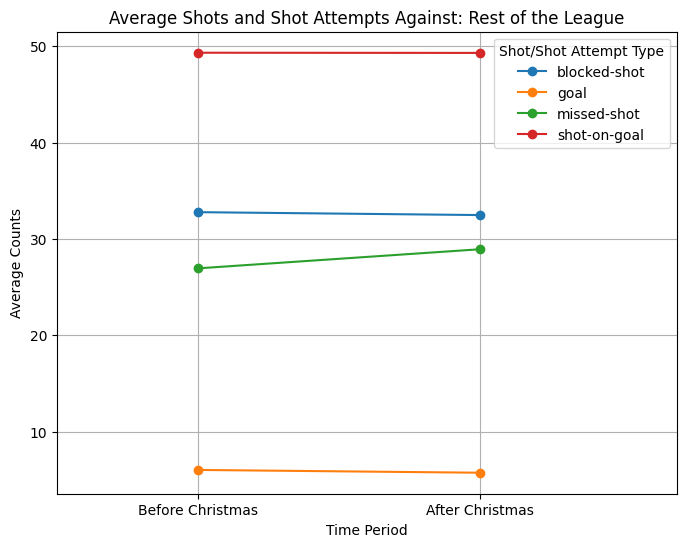
Well, there are pros and cons right now. I wish I could make you feel better about the fact that the Bruins got noticeably worse defensively over the last 13 games. In the meantime other teams have been able to win games and catch up in the standings. Perhaps this 13 game stretch is just a blip and everything will even out in the end. Yes, they are better than the league average, but what this doesn’t tell us is if that average is skewed by really, really bad teams with no hope for playoffs. What actually matters is the averages for those teams actually in playoff contention.
I like to re-visit my explorations from time to time and next time I plan to get a little fancier and introduce some weights or possibly only look at those teams competing against the Bruins for a Wild Card spot. I also would like to look at some other teams facing a similar story this season, namely the New York Rangers, Montreal Canadiens, and the Detroit Red Wings. What else would you like to see?
Comments
Nothing yet. Say the first thing.
Sign in to join the conversation.