
When it comes to communicating about data to a non-technical audience, their eyes can glaze over when I talk about all of the things I did to my dataset in order to prepare it for testing. That’s why I’ve put together this post - to provide folks with the background information on how I built my model. This particular post will be added onto as more of the model is developed.
In the United States, Thanksgiving is celebrated on the fourth Thursday of November each year. This means the specific date changes every year, but it always falls between November 23 and November 29. Instead of taking the time to look up every Thanksgiving date between 2000 and 2024, I wrote a function that grabbed those dates and pulled the standings for that date from the NHL API.
The python language is awesome and there are all kinds of libraries that exist out there to do all kinds of things like conversions, visualizations, and so much more. I imported the “holidays” library in order to extract all of the Thanksgiving dates during my timeframe.
The NHL API call for standings data brings in a LOT of information. Over 80 columns of data to be exact. I want to start my model building and testing small, so I only grabbed the following data points:
Conference name and rank within the conference
Division name and rank within the division
Games played
Goal differential and percentage
Goals against, goals for, and goals for percentage
Points and points percentage
Most recent streak and type (e.g., 3 wins or 1 loss)
Win percentage
Team name and abbreviation (tri-code)
Season ID
Date
I added in a few additional data points and metrics into my standings data frame:
Strength of schedule
Goal differential percentage change (the change between the goal differential percentage from thanksgiving to final standings)
Simple projected points (thanksgiving points/games played by thanksgiving multiplied by 82)
In order to calculate the strength of schedule metric, I had to pull in the summary game results from the NHL API.
This data frame included:
Game match up (home team vs away team)
Final score
Team names and abbreviation (“tri_code”)
Over the course of 24 years there were four seasons that stand out.
2004-2005: completely canceled due to labor dispute between the NHLPA and the NHL
2012-2013: shortened season due to labor dispute between the NHLPA and the NHL. This season started on January 19, 2013 and consisted of 48 regular season games played in a condensed format.
2019-2020: shortened season due to the COVID-19 Pandemic. The regular season was paused on March 12, 2020. At this point in the season, teams had played between 68 and 71 games (out of 82). The season returned on August 1, 2020 in two bubble locations (Toronto and Edmonton). Because not every team had finished the regular season playing the same number of games, a pre-playoffs series was held for a number of teams that were “on the bubble”.
Qualifying Round (Pre-Playoff Series)
To make the playoffs more inclusive due to the shortened season, the NHL expanded the postseason from the usual 16 teams to 24 teams.
The top four teams in each conference, based on points percentage at the time of the pause, received a bye into the traditional Stanley Cup Playoffs.
These teams played a Round Robin tournament to determine seeding.
The remaining eight teams in each conference competed in a best-of-five Qualifying Round to determine who would advance to the playoffs.
2020-2021: shortened season due to the COVID-19 Pandemic; due to the late finish of the 2019-2020 season, the 2020-2021 season began on January 13, 2021. In an attempt to begin returning the NHL season to it’s original calendar schedule within three seasons, teams played a total of 56 games and only played within their division to minimize travel. The NHL returned to an 82-game season the following year.
These four seasons are outliers compared to the other seasons. Obviously there was no data to use for the 2004-2005 season, so that’s why you won’t see any information from then.
For the remaining three outlier seasons, I made a few adjustments to control for the fact that they didn’t play the standard 82 games:
The date for Thanksgiving changes every year, so I took the average number of games played by this date for every team across all seasons except for the 2012-2013 and 2020-2021 seasons because they didn’t play in November in those years. I did use the Thanksgiving date for the 2019-2020 seasons since they did play to that point in the typical fashion.
The average number of games played by Thanksgiving was 21 (20.9), which is 25.6%.
Rounding up to 26%, I then determined the date in the shortened schedules when most teams played 26% of their season. This resulted in February 13, 2013 for the lockout season and February 15, 2021 for the covid season.
status_a: 1 for teams in playoff position at Thanksgiving, 0 if not
status_b: 1 for teams in playoff position on final day of the season, 0 if not
Late surge team: status_a == 0, status_b == 1
Drop out team: status_a == 1, stauts_b == 0
Position: late surge team == 1, drop out team == -1, position unchanged == 0
To calculate the late surge and drop out team stats, the standings data frame was split by conference and grouped by season_id:
Average points out of playoff contention: round((drop_out_east['tx_points'] - drop_out_east['tx_8th_spot_points']).mean(),2)
Median distance from 8th spot in points: round((drop_out_east['tx_points'] - drop_out_east['tx_8th_spot_points']).median(),2)
Mode distance from 8th spot in points: (drop_out_east['tx_points'] - drop_out_east['tx_8th_spot_points']).mode()[0]
Points percentage change from thanksgiving to season end: round((drop_out_east['tx_points_pct'] - drop_out_east['end_points_pct']).mean(),2)
Season start dates: season_start_dates = { "20002001": "2000-10-04", "20012002": "2001-10-03", "20022003": "2002-10-09", "20032004": "2003-10-08", "20052006": "2005-10-05", "20062007": "2006-10-04", "20072008": "2007-09-29", "20082009": "2008-10-04", "20092010": "2009-10-01", "20102011": "2010-10-07", "20112012": "2011-10-06", "20122013": "2013-01-19", "20132014": "2013-10-01", "20142015": "2014-10-08", "20152016": "2015-10-07", "20162017": "2016-10-12", "20172018": "2017-10-04", "20182019": "2018-10-04", "20192020": "2019-10-02", "20202021": "2021-01-13", "20212022": "2021-10-12", "20222023": "2022-10-11", "20232024": "2023-10-11"}
“Thanksgiving” dates: thanksgiving_dates = { '20002001': '2000-11-23', '20012002': '2001-11-22', '20022003': '2002-11-28', '20032004': '2003-11-27', '20052006': '2005-11-24', '20062007': '2006-11-23', '20072008': '2007-11-22', '20082009': '2008-11-27', '20092010': '2009-11-26', '20102011': '2010-11-25', '20112012': '2011-11-24', '20122013': '2013-02-13', '20132014': '2013-11-28', '20142015': '2014-11-27', '20152016': '2015-11-26', '20162017': '2016-11-24', '20172018': '2017-11-23','20182019': '2018-11-22', '20192020': '2019-11-28', '20202021': '2021-03-04', '20212022': '2021-02-15','20222023': '2022-11-24', '20232024': '2023-11-23', '20242025': '2024-11-28'}
Final regular season date: nhl_season_dates = { "20002001": "2001-04-08", "20012002": "2002-04-14", "20022003": "2003-04-06", "20032004": "2004-04-04", "20052006": "2006-04-18", "20062007": "2007-04-08", "20072008": "2008-04-06", "20082009": "2009-04-12", "20092010": "2010-04-11", "20102011": "2011-04-10", "20112012": "2012-04-07", "20122013": "2013-04-27", "20132014": "2014-04-13", "20142015": "2015-04-11", "20152016": "2016-04-10", "20162017": "2017-04-09", "20172018": "2018-04-08", "20182019": "2019-04-06", "20192020": "2020-03-12", "20202021": "2021-05-19", "20212022": "2022-04-29", "20222023": "2023-04-13", "20232024": "2024-04-18"}
This is used in my decision tree and XGBoost models as one of the features in predicting final standings based on Thanksgiving standings.
Summary game data was pulled from the NHL API and returned home team, away team, final scores, and dates.

Strength of schedule is calculated first by determining each team’s win percentage based on game outcomes and then the win percentages for all teams. That information is then saved as a data frame.
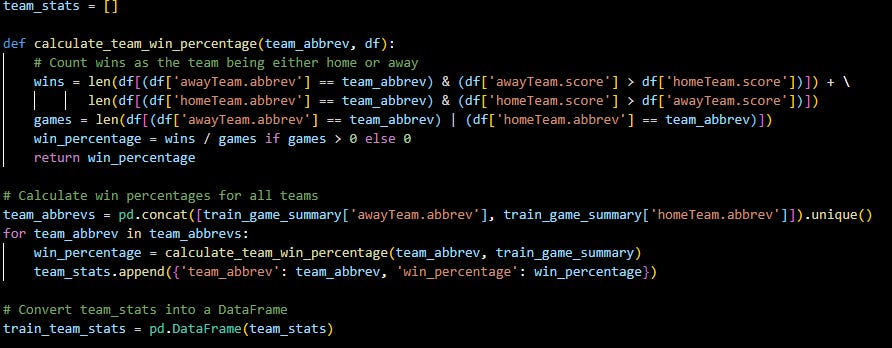
This data is then mapped to the data frame:

And then the SOS is calculated for both home and away teams and joined together to create a single data frame.
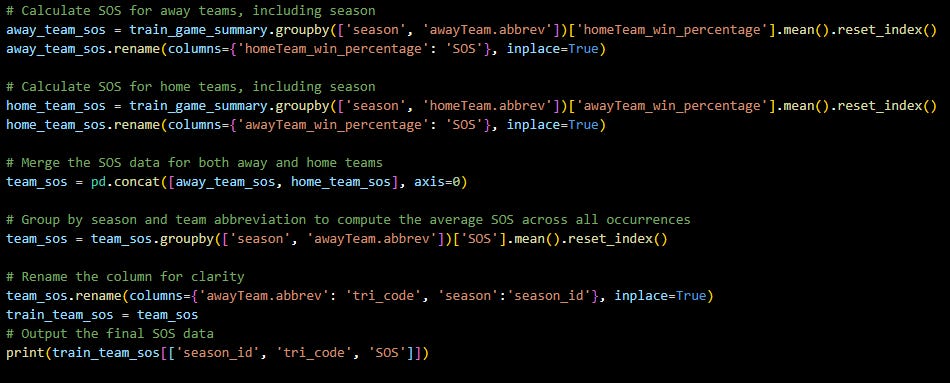
As this model is built out, I will include more information in this section here.
Comments
Nothing yet. Say the first thing.
Sign in to join the conversation.