
The market starts August with a relief bid. U.S. equity futures rose after President Trump called off a planned strike on Iran and said negotiations would resume Monday. Crude moved lower as part of the conflict premium came out.
No final agreement has been reached, so the gap is relief rather than confirmation. This week will test whether lower oil can broaden risk appetite while yields remain elevated and semiconductor participation stays uneven.

The weekend news created a possible off-ramp from the U.S.–Iran conflict. Any agreement still has to address the Strait of Hormuz and the nuclear dispute, but oil reacted immediately. Lower crude eases one source of inflation risk.
The bond market remains the harder part of the setup. Long-term Treasury yields rose sharply last week and moved back toward prior highs. Higher risk-free returns compete with equities and raise the discount rate applied to future cash flows. Small caps and long-duration growth stocks are especially sensitive.
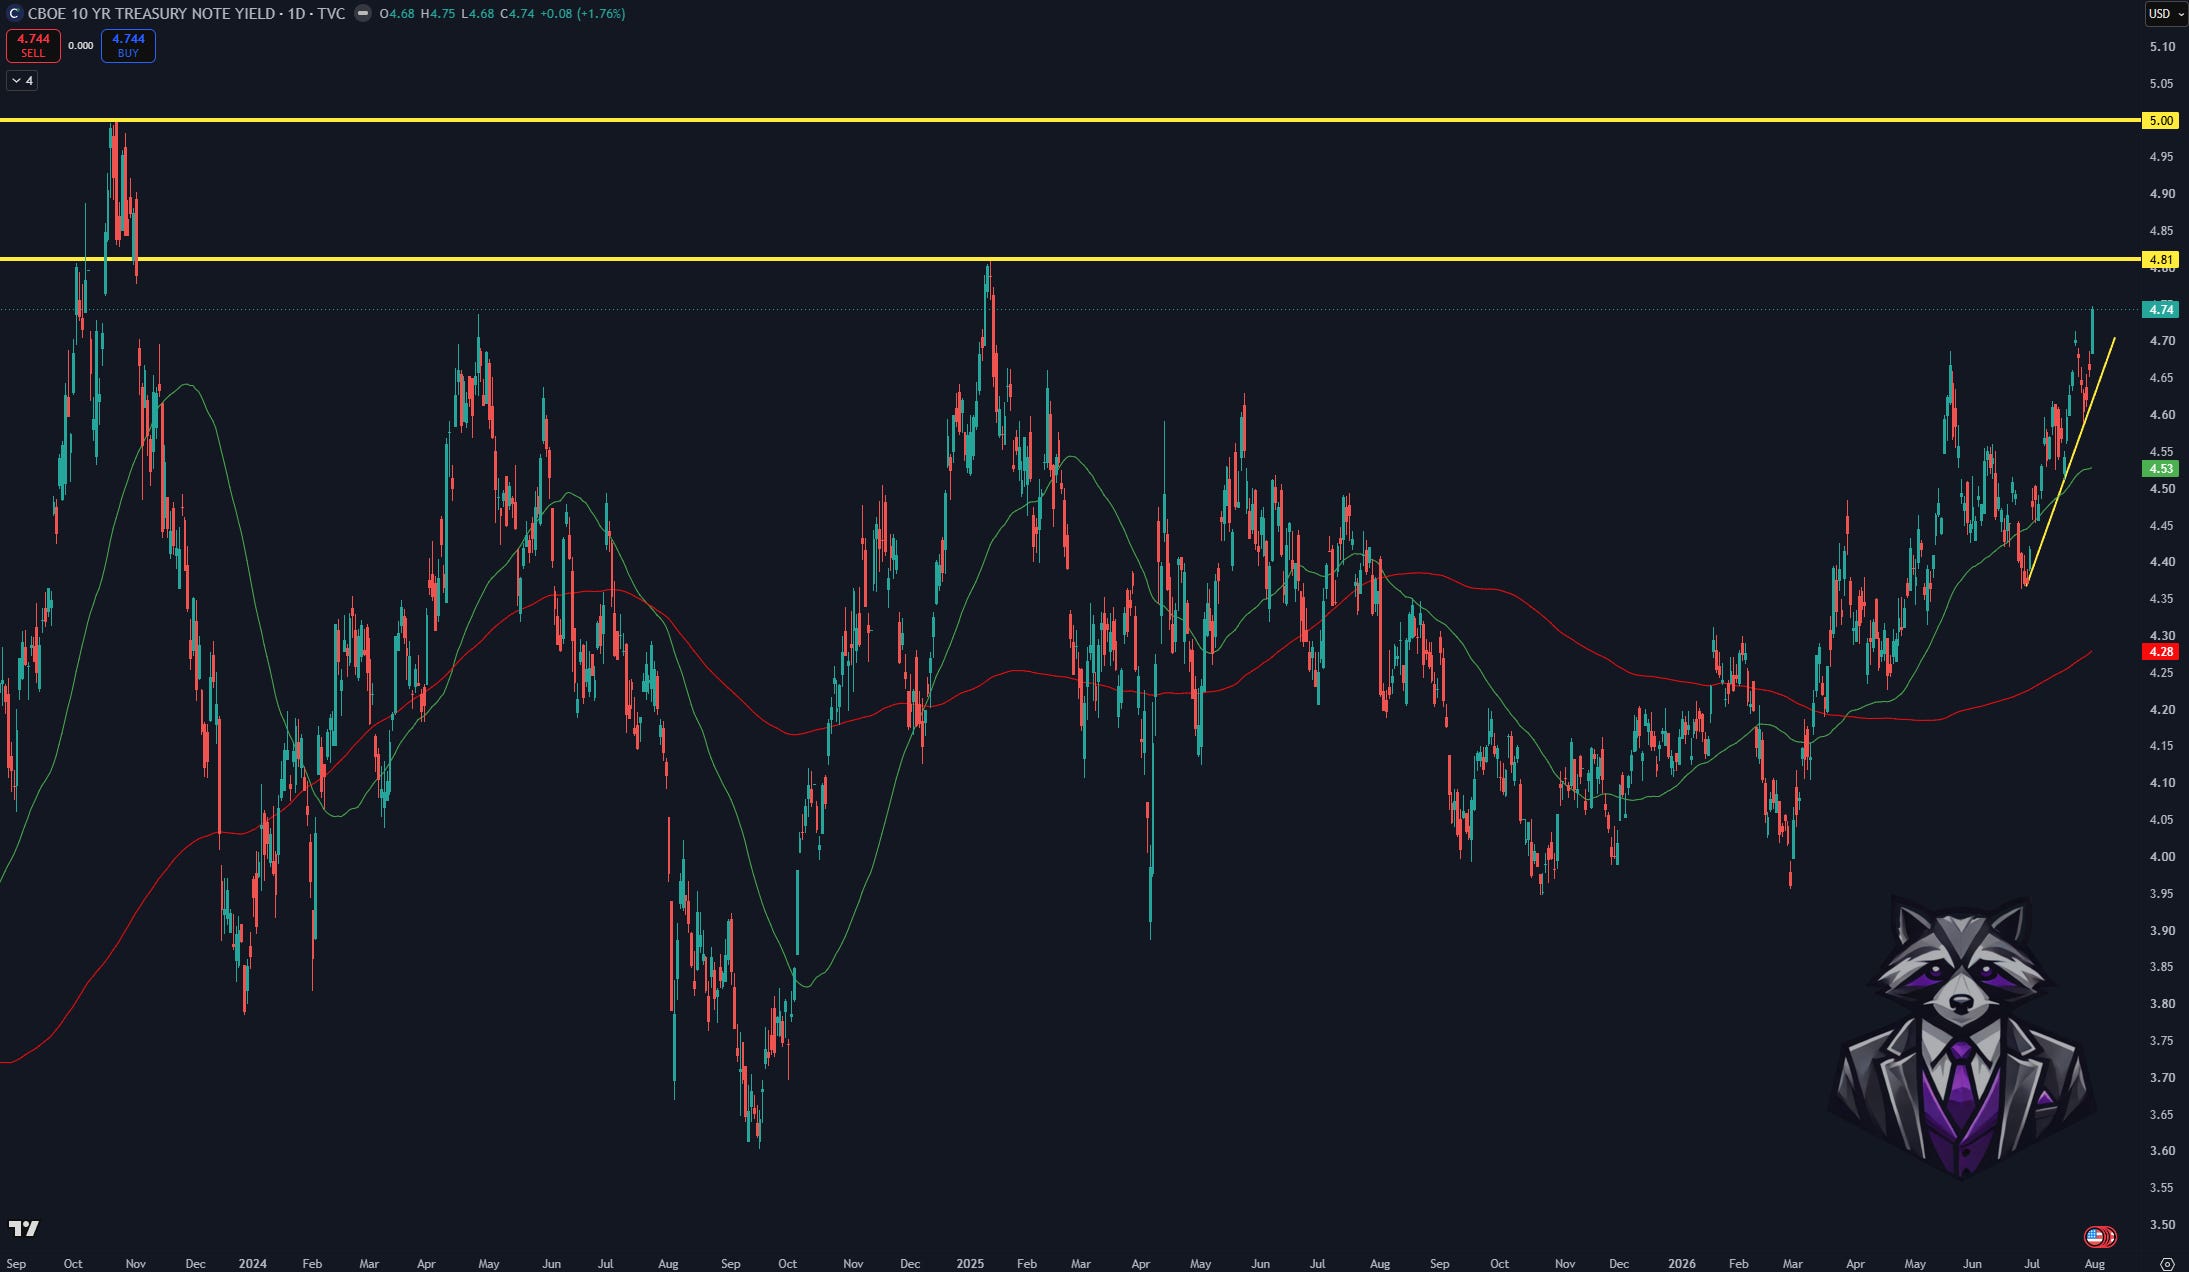
At the time of writing, FedWatch placed the probability of a rate increase at roughly 65%. That estimate can change quickly as new data arrives.
Lower oil helps, but it does not erase the cost of capital. If yields ease with crude, the relief rally can broaden. If they push higher again, the largest and most profitable companies may continue to carry the indexes.
For the August 7 weekly expiration, SPX is starting from a supportive position, but the first real test is already overhead.
HVL at 7475 is the gamma flip. Spot at 7533 is above it, so the index is in positive gamma: dips can be absorbed more cleanly than below the flip. The nearest call GEX is right above price at 7550 C1, which is also Absolute GEX. Beyond that sits 7575 C3, then 7600 C2, which also carries the largest call volume.
On the put side, 7475 P2 sits with HVL as the first downside reference. Below that, 7400 P1 is the Put Wall.
Put skew is elevated: PUT$ at 123.9% with IVRank 31.9 and IVx 15.5, down 2.4% over five days. Traders are still paying for downside protection even as the tape presses the call wall.
Key levels from the current structure:
🔵 Regime
7475 — HVL (gamma flip · positive above)
🟢 Call GEX
7550 — C1 (Call Wall · largest call NETGEX) + Ab1 (largest absolute gamma)
7575 — C3
7600 — C2
⭐ Call OI / volume
7600 — CV (largest call volume)
🔴 Put GEX
7475 — P2 ← first put GEX under spot / confluence with HVL
7400 — P1 (Put Wall · largest put NETGEX)
📊 Options panel
IVRank 31.9 · IVx 15.5 · IVx 5d -2.4% · Put skew 123.9% · Implied move ±0.38% (±29 pts)
Price is coiled under 7550 C1 after reclaiming HVL. The constructive path is a hold above 7475 and acceptance through the call wall. F
The bullish path starts with a hold above 7475 HVL.
That keeps the regime supportive and keeps the focus on the overhead call cluster. The first test is 7550 C1. Acceptance through the Call Wall opens 7575 C3, then 7600 C2, where call volume is also heaviest. In positive gamma above HVL, dips can be absorbed more cleanly, but C1 can still stall the first extension attempt.
The bearish path begins with rejection under 7550 C1 and a failed hold of 7475 HVL.
Losing HVL flips the regime from supportive to fragile. The first put GEX is already at 7475 P2. Sustained weakness below that opens the path toward 7400 P1, the Put Wall. Elevated put skew leaves less room for a casual dip-buy narrative if the call wall rejects while payrolls and earnings hit midweek.
The downside map is:
First warning: reject under 7550 C1
First put GEX / regime line: 7475 HVL + P2
Put Wall: 7400 P1
Below HVL: structure becomes more fragile; vol can expand into the put cluster
SPX is constructive above 7475 HVL, but the tape is already pressing the 7550 Call Wall. The first repair is holding the flip. The first extension is clearing C1 into 7600. Below HVL, put GEX is led by 7475 P2, then the 7400 Put Wall.
The key level is 7475 HVL. Above it, structure is more constructive. Below it, the market remains vulnerable to wider swings.
This week is not only about indexes and yields. A few single-stock events will decide whether the relief bid stays narrow or spreads into the names that actually set the tone for growth and semis.
Open the Aug 21 GEX profile and the 200 strike does most of the talking. That level is both the call wall (where call open interest is thickest) and Absolute GEX (the strike with the largest absolute gamma). In plain terms: a lot of the options book is anchored there, so dealer hedging around 200 can matter a lot for how price behaves near that print. Spot is basically parked around that pile.
Two other labels help you read the same chart. HVL at 195 is the profile’s flip line between the denser positive- and negative-gamma regions; spot is above it. The put wall at 180 is where put open interest clusters underneath.
Then look at volume. CV and nCV are not open interest — they show where call volume and net call volume actually traded. Both sit at 210. So the standing inventory (OI / AbsGEX) is centered on 200, while the recent volume footprint is one strike higher at 210. That’s the useful contrast on this chart: where the book is built vs where volume showed up.
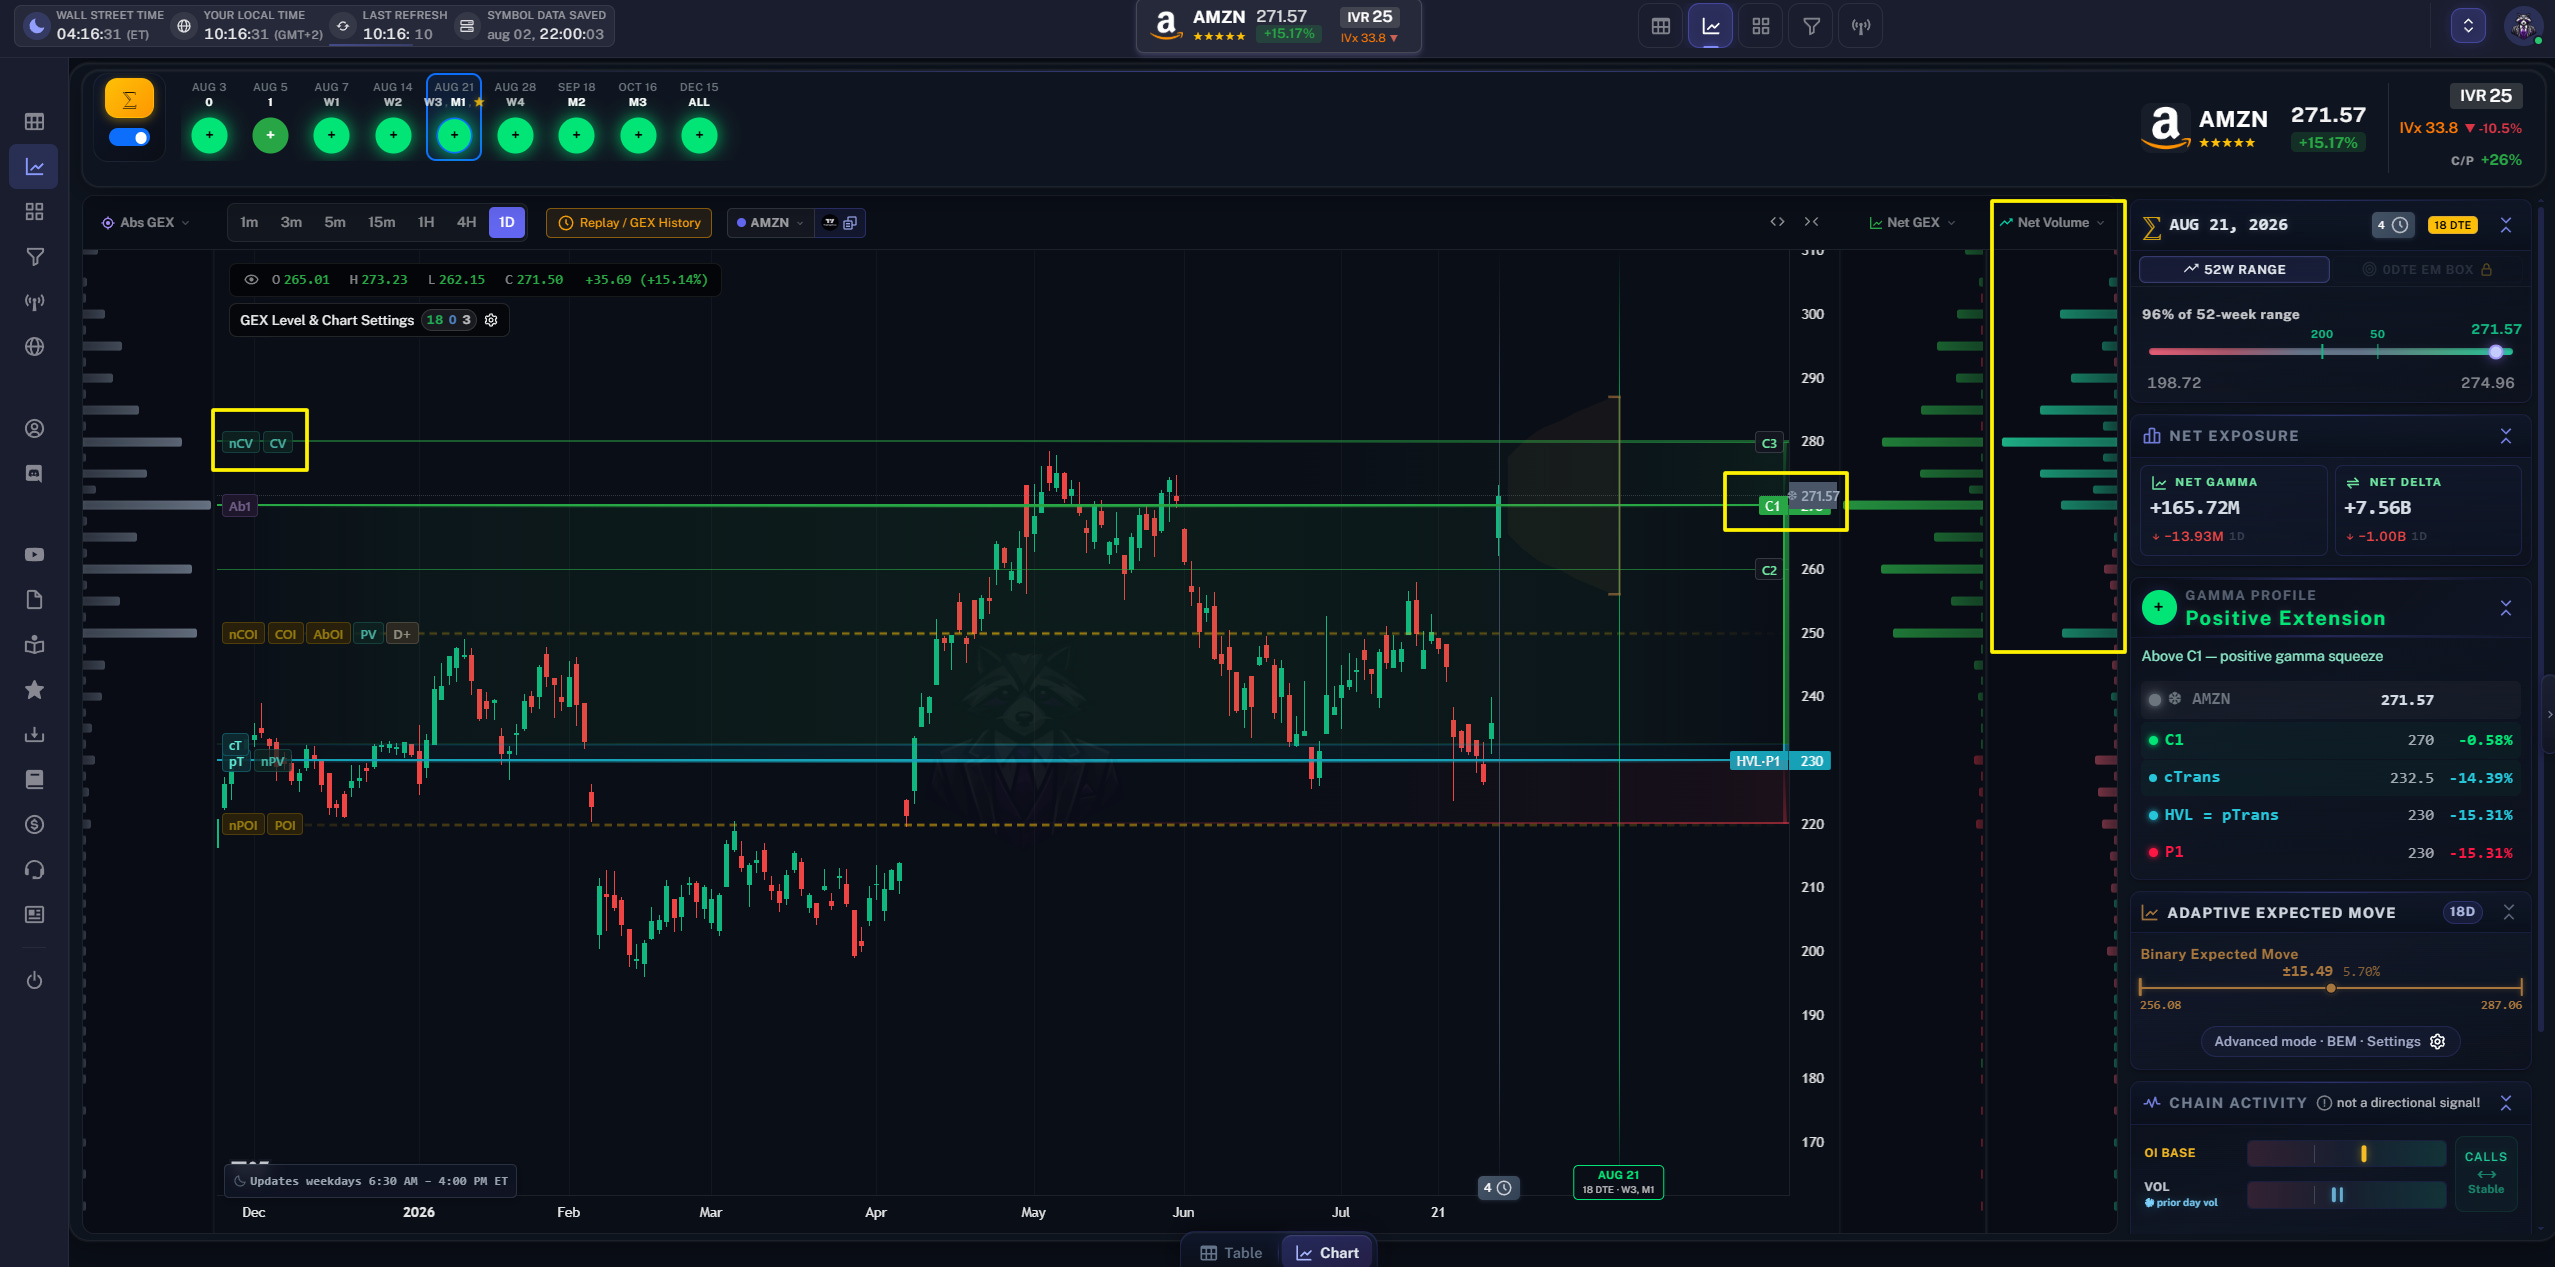
On the Aug 21 profile, 270 is the headline. Spot, the call wall, and Absolute GEX all land on the same number. When price, the heaviest call OI strike, and the largest absolute GEX strike coincide, you’re looking at a classic “options magnet” picture — not a prediction, just a dense concentration of positioning at one price.
Underneath, both HVL and the put wall sit at 230, so the lower half of the map is also aligned.
Volume adds a second layer: CV and nCV print at 280. Again, that is traded call activity, not the OI wall. So the chart shows a tight positioning cluster at 270, a shared lower shelf at 230, and a volume peak at 280. Three different questions, three answers on one screen: where inventory sits, where the put/HVL shelf is, and where call volume traded.
For a more granular picture of net options volume, the TanukiTrade Webapp can help by showing the distribution of volume across strikes.
On the Aug 21 map, Broadcom sits just above the HVL at 380 — the flip line on this gamma profile between the denser positive- and negative-gamma regions. The put wall (P1) at 340 marks where put open interest is thickest underneath.
Overhead, the picture is a bit different from a simple “price glued to the call wall” chart. The call wall (C1) is at 410, but the largest absolute GEX strike (Ab1) and both CV and nCV (where call volume and net call volume peaked) all sit at 400. So the heaviest GEX pile and the volume footprint meet at 400, while the formal call wall is one step higher at 410 (with C2 at 420).
In short: lower put shelf at 340, HVL just under spot at 380, and a shared AbsGEX / call-volume cluster at 400 ahead of the 410 call wall.
Monday: ISM Manufacturing and PLTR.
Tuesday: JOLTS; CAT, SPOT, AMD, and SpaceX.
Wednesday: ISM Services; SHOP, UBER, DIS, and SNDK.
Thursday: Jobless claims and productivity.
Friday: July payrolls, unemployment, and wages at 8:30 a.m. ET.
Friday is the main macro test. Strong hiring and wages could lift September hike odds and long yields. Softer data could relieve rate pressure, although a sharp slowdown would create a different problem for equities.
A strong futures open can change the tone, but it cannot confirm the entire week. A durable improvement would include steadier yields, better Russell participation, and semiconductors that stop giving back intraday strength.
GEX is not a crystal ball. HVL is not a mechanical trigger, and a call or put wall is not a guaranteed turning point. Headlines provide the impulse; structure shows whether the move is accepted.
Respect the relief bid without confusing it with confirmation. Iran talks, the bond market, semiconductor earnings, and Friday payrolls will add the evidence.
This week’s video reviews an NVIDIA position that combined a short put with call butterflies. The put financed the upside structure and added positive theta.
After more than half of the put premium decayed, the naked leg was bought back. The remaining butterflies were later closed when NVIDIA lost support. Premium harvested from the put offset the butterfly loss and left the combined position profitable.
The lesson is simple: different legs can finance the thesis, express the target, and reduce risk at different stages. Full walkthrough and adjustments:
⚠️ Trade with flat-delta, high risk-reward structures, keep your positioning adaptable, and always monitor the GEX levels and the surrounding gamma environment — they’ll tell you more about the path ahead than the headlines ever will!
You can find additional valuable content on our YouTube channel, and if you feel like trying out our
⭐ GEX-Live Charting View, you can do so with a 7-day free trial here: ⭐
https://tanukitrade.com/
This material is for educational purposes only; TanukiTrade is not a financial advisor, and nothing here constitutes investment advice or a recommendation.
No posts
Comments
Nothing yet. Say the first thing.
Sign in to join the conversation.