
In Hungary, we often say that “even the grass doesn’t grow in summer.” This year, that expression seems equally applicable to the stock market.
Over the past several weeks, we have watched a slow and gradual decline, led primarily by Nasdaq technology stocks. The euphoria surrounding the AI trade appears to have shifted into a period of consolidation rather than another impulsive move higher.
There has not been much excitement so far, but will this quiet bleed continue next week?
Let’s take a look.
Looking at the weekly GEX structure, we can see that the market opened on Monday with a significant gap higher near 7,490. However, the move was quickly sold, and the index eventually traded below Friday’s closing price, reaching the 7,400 area.
We remain firmly in a negative gamma environment, whether we examine the weekly structure or the overall GEX profile. Today’s trading session did not materially change that picture.
This should continue to shape our expectations for the coming days. In a negative gamma environment, larger intraday swings, momentum-driven moves, and rapid directional reversals are entirely normal.
The weekly HVL is currently located at 7,490.
To the downside, the largest Put Wall is positioned at 7,300, surrounded by another significant put gamma cluster extending down to approximately 7,280. Interestingly, the TanukiTrade four-day Smart Expected Move model also places the lower boundary of the options market’s expected range in this exact area through Friday.
To the upside, the 7,490 HVL and the broad transition zone immediately above it remain the first major obstacles.
Only a sustained breakout above 7,500 could open the door toward 7,620, where the largest positive gamma cluster is currently located.
For now, however, there are no clear signals suggesting that such a breakout is imminent beyond pure speculation. Based on the current structure, a continued slow decline still appears to be the more plausible scenario, particularly if the existing downward trend remains intact.
Remember: the trend is your friend until the end.
Primarily, elevated volatility!
With the VIX trading near 20, it remains reasonable to expect substantial intraday price movement! The VIX and the negative gamma structure are currently telling a consistent story. The VIX also continues to move higher, which suggests that the current consolidation phase may not be over yet.
To signal a potential end to this environment, we would likely need to see either a meaningful bounce from an important options level or a strong and convincing bullish price-action reversal.
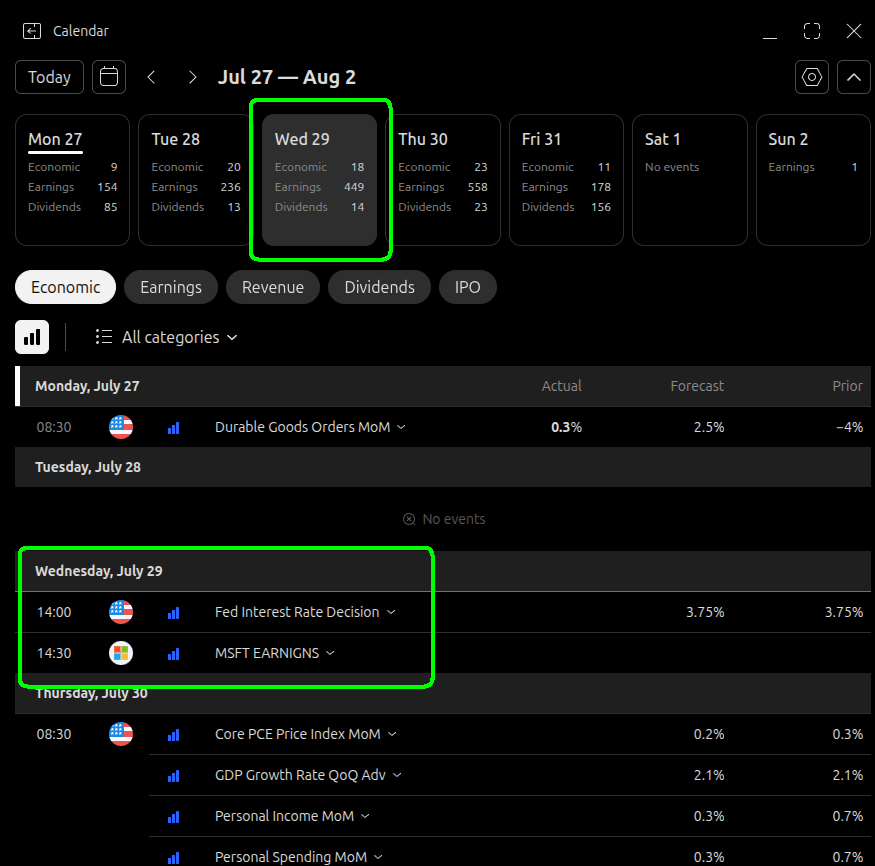
Looking at this week’s economic calendar, it becomes immediately clear why the market is currently so uncertain.
The Federal Reserve’s interest-rate decision is scheduled for Wednesday, followed by the Core PCE inflation report on Thursday morning. Core PCE is currently one of the most important macroeconomic events of the week.
It would not be surprising to see the market maintain artificially elevated volatility ahead of these events.
There is also an extremely important corporate catalyst to consider:
Microsoft reports earnings after the market closes on Wednesday.
Because of Microsoft’s substantial weighting in both the QQQ and the SPX, its earnings report could become one of the strongest fundamental market catalysts of the entire week.
For this reason, traders should carefully consider whether positions currently sitting near their break-even levels should remain open through these binary events—unless, of course, the position is specifically designed to benefit from elevated volatility.
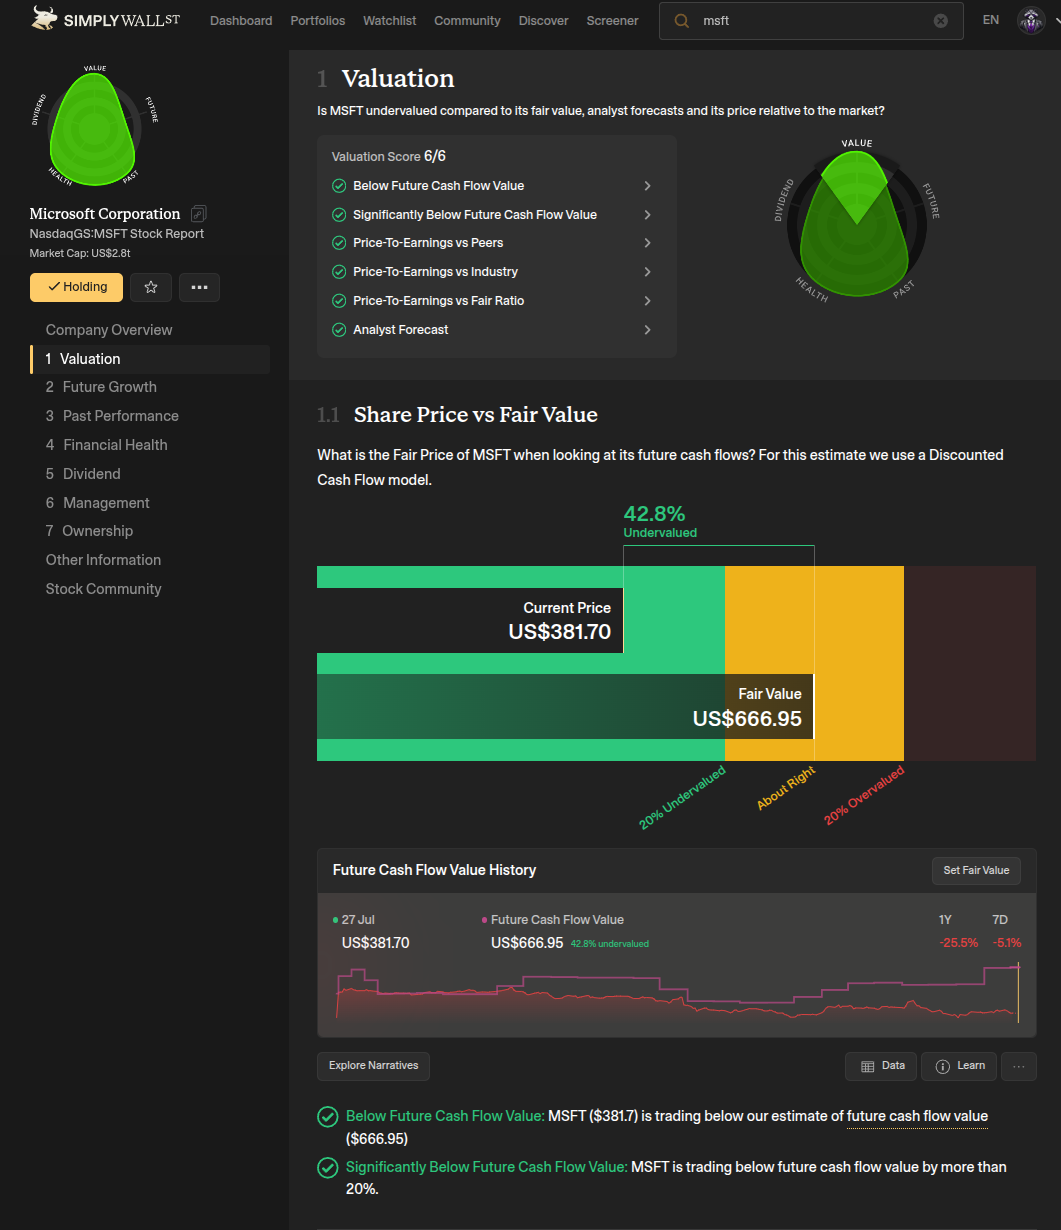
According to Simply Wall St, Microsoft is currently trading significantly below its estimated fair-value range, which may make the stock attractive to long-term investors.
However, last week’s reaction to Google demonstrated how much downside pressure can emerge when the market begins questioning the potential return on massive AI-related capital expenditures. Any speculation surrounding Microsoft earnings should therefore be approached with caution.
Nobody can predict with certainty which direction the market will move next. Hopefully, everyone who has followed us over the past two years already understands that.
What we can understand, however, is how options are priced—particularly the effects of theta, vega, and implied volatility on multi-leg options strategies.
For this reason, it may make sense to consider a weekly range-based strategy in which positive theta can help finance the position while we wait for the week’s major events, while still allowing the trade to remain manageable during a moderate move higher.
The following example is provided strictly for educational purposes.
The idea behind this structure is to provide approximately 100 points of upside flexibility in the event of a short-term market rally.
Because the position carries negative vega, a move higher combined with a decline in the VIX could potentially create an opportunity to realize a quick, modest profit while the SPX remains below approximately 7,530.
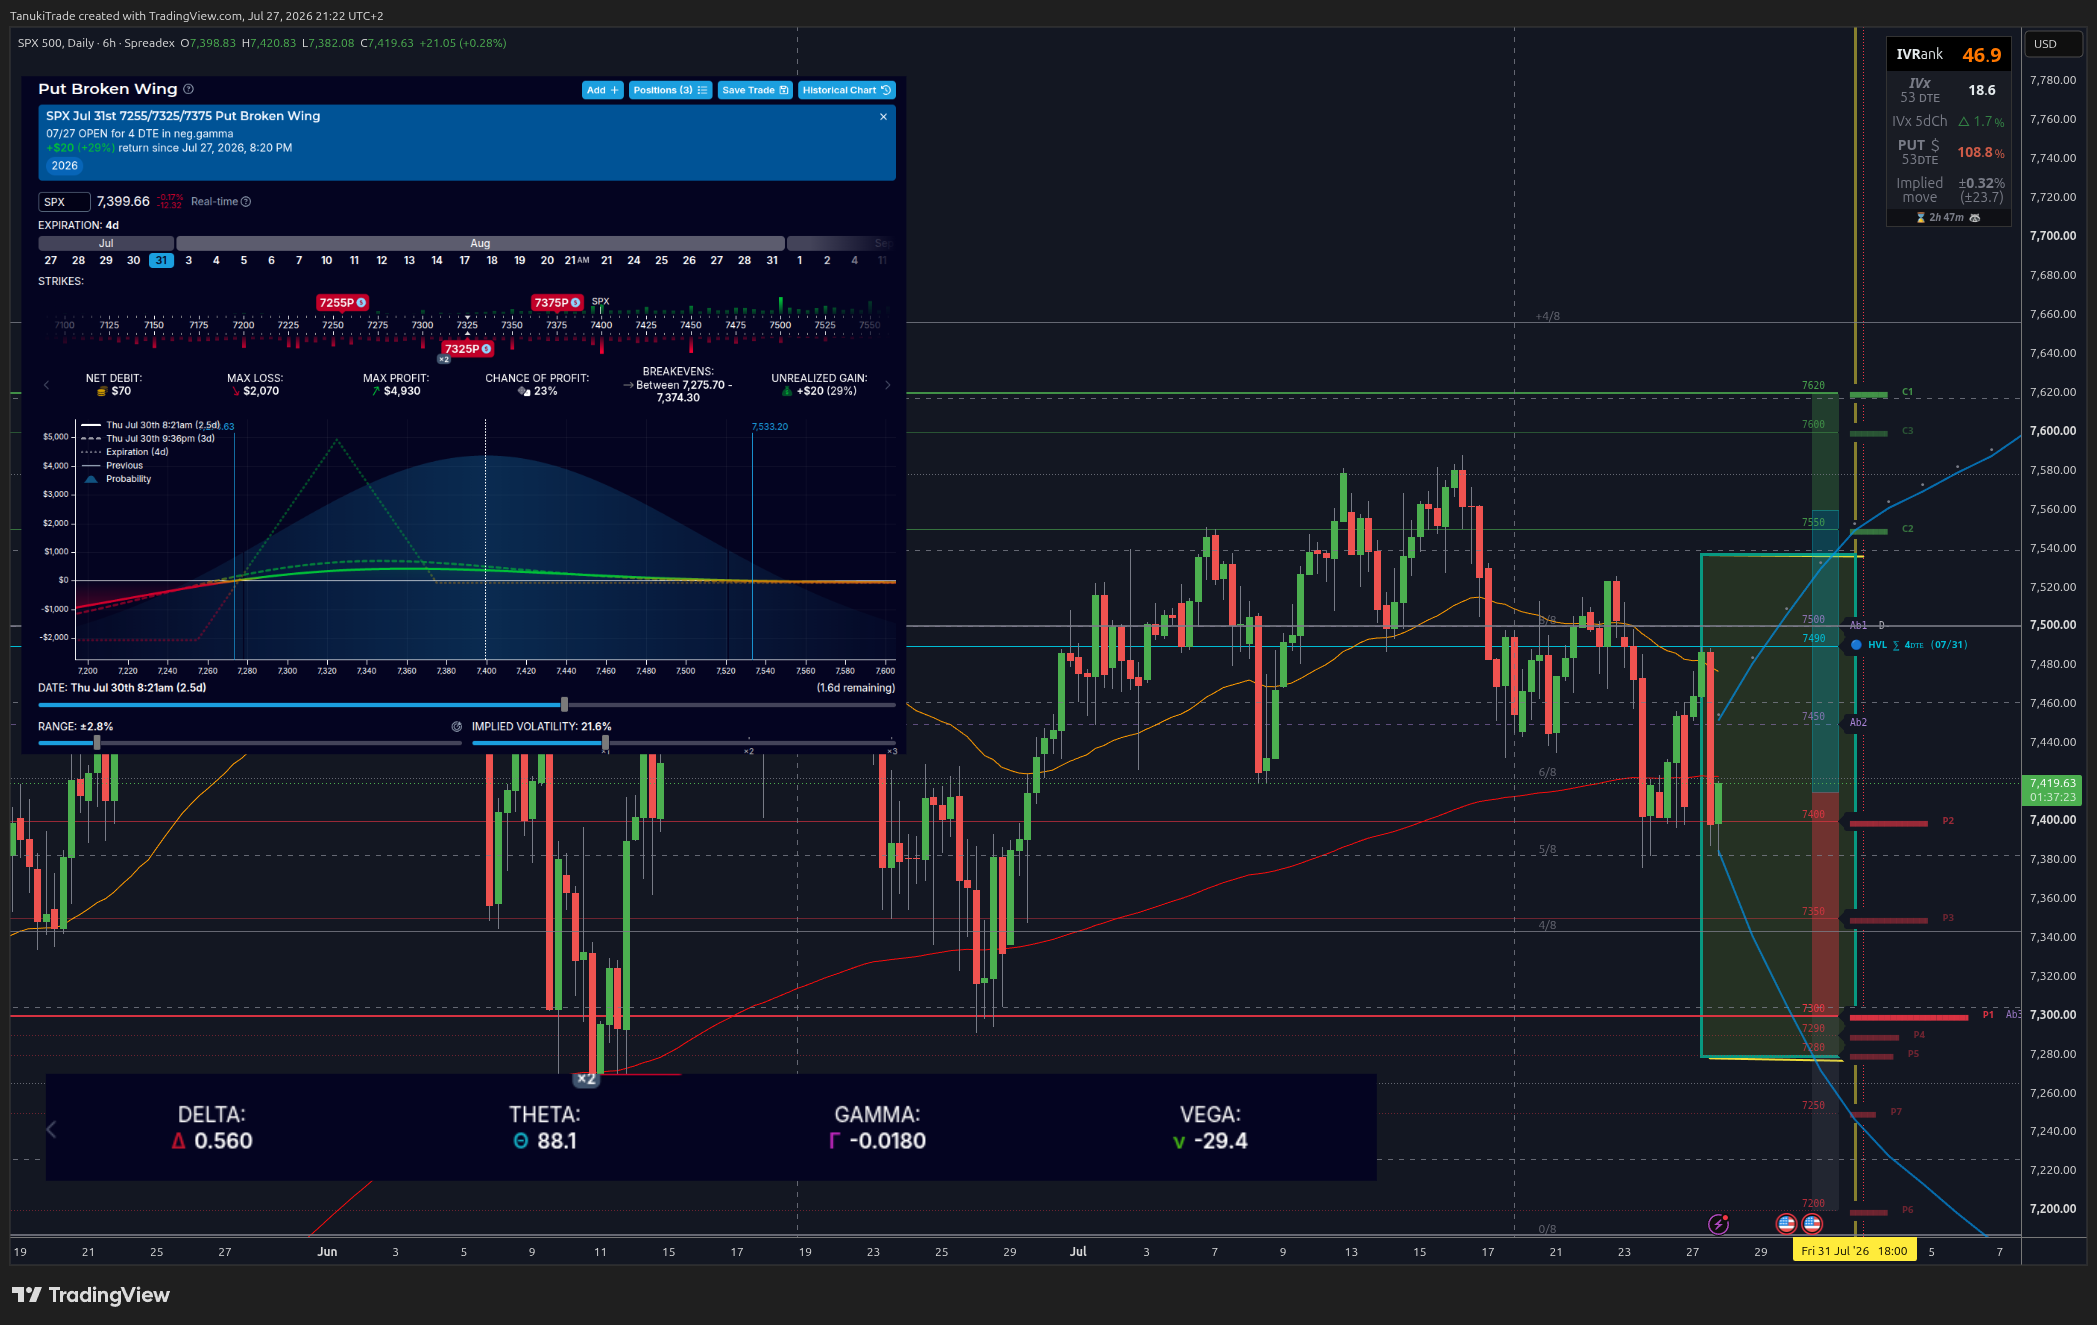
If the slow decline continues toward the 7,300 Put Wall, the position’s four-day expiration means that positive theta may work faster than the negative vega exposure harms the trade.
The example structure has the following characteristics:
maximum risk: $2,000
theta: +$85 per day
vega: -30
Under normal market conditions, this structure may allow the SPX to move as low as approximately 7,280 without causing significant damage to the position.
At the same time, the trade could potentially generate a return of approximately 5% to 10% on the buying power committed before Wednesday’s close.
It is important to emphasize that holding this type of position through major binary events—including the Federal Reserve decision, the Core PCE report, and Microsoft earnings—would introduce substantially greater risk.
Assuming no unexpected news or major market shock occurs, the strategy may provide approximately 100 points of flexibility in either direction from the current market price.
That range could be sufficient to capture a small, controlled profit during the first half of the week. The intended holding period would extend no later than Wednesday.
You can follow the position’s development over the next several days here:
👉https://optionstrat.com/yEvzzwRrTBr2
This will make it possible to observe how the P/L changes as theta, vega, and implied volatility evolve throughout the trade.
To demonstrate another way of using a Put Butterfly in a negative gamma environment, this week Gery, TanukiTrade’s Chief Options Expert, walks through a real SPX trade from start to finish.
In the video, he explains how he constructed a directional Put Butterfly using the HVL, Put Walls, and GEX levels in a market that appeared increasingly vulnerable to a pullback after a parabolic advance.
After scaling out of the position and making several adjustments, he ultimately closed the trade for a profit of approximately $680.
No posts
Comments
Nothing yet. Say the first thing.
Sign in to join the conversation.