
The market starts the week with a relief bid still intact. Soft July payrolls cut the odds of a September hike, yields eased, and buyers stepped back in. The S&P 500 pushed to fresh highs. The Nasdaq led the week’s percentage gains but has not confirmed with a new all-time high of its own.

Volatility collapsed with that move. The VIX traded with a 14 handle and printed a fresh local low. That is comfortable for trend continuation, and thin insurance into an inflation week.
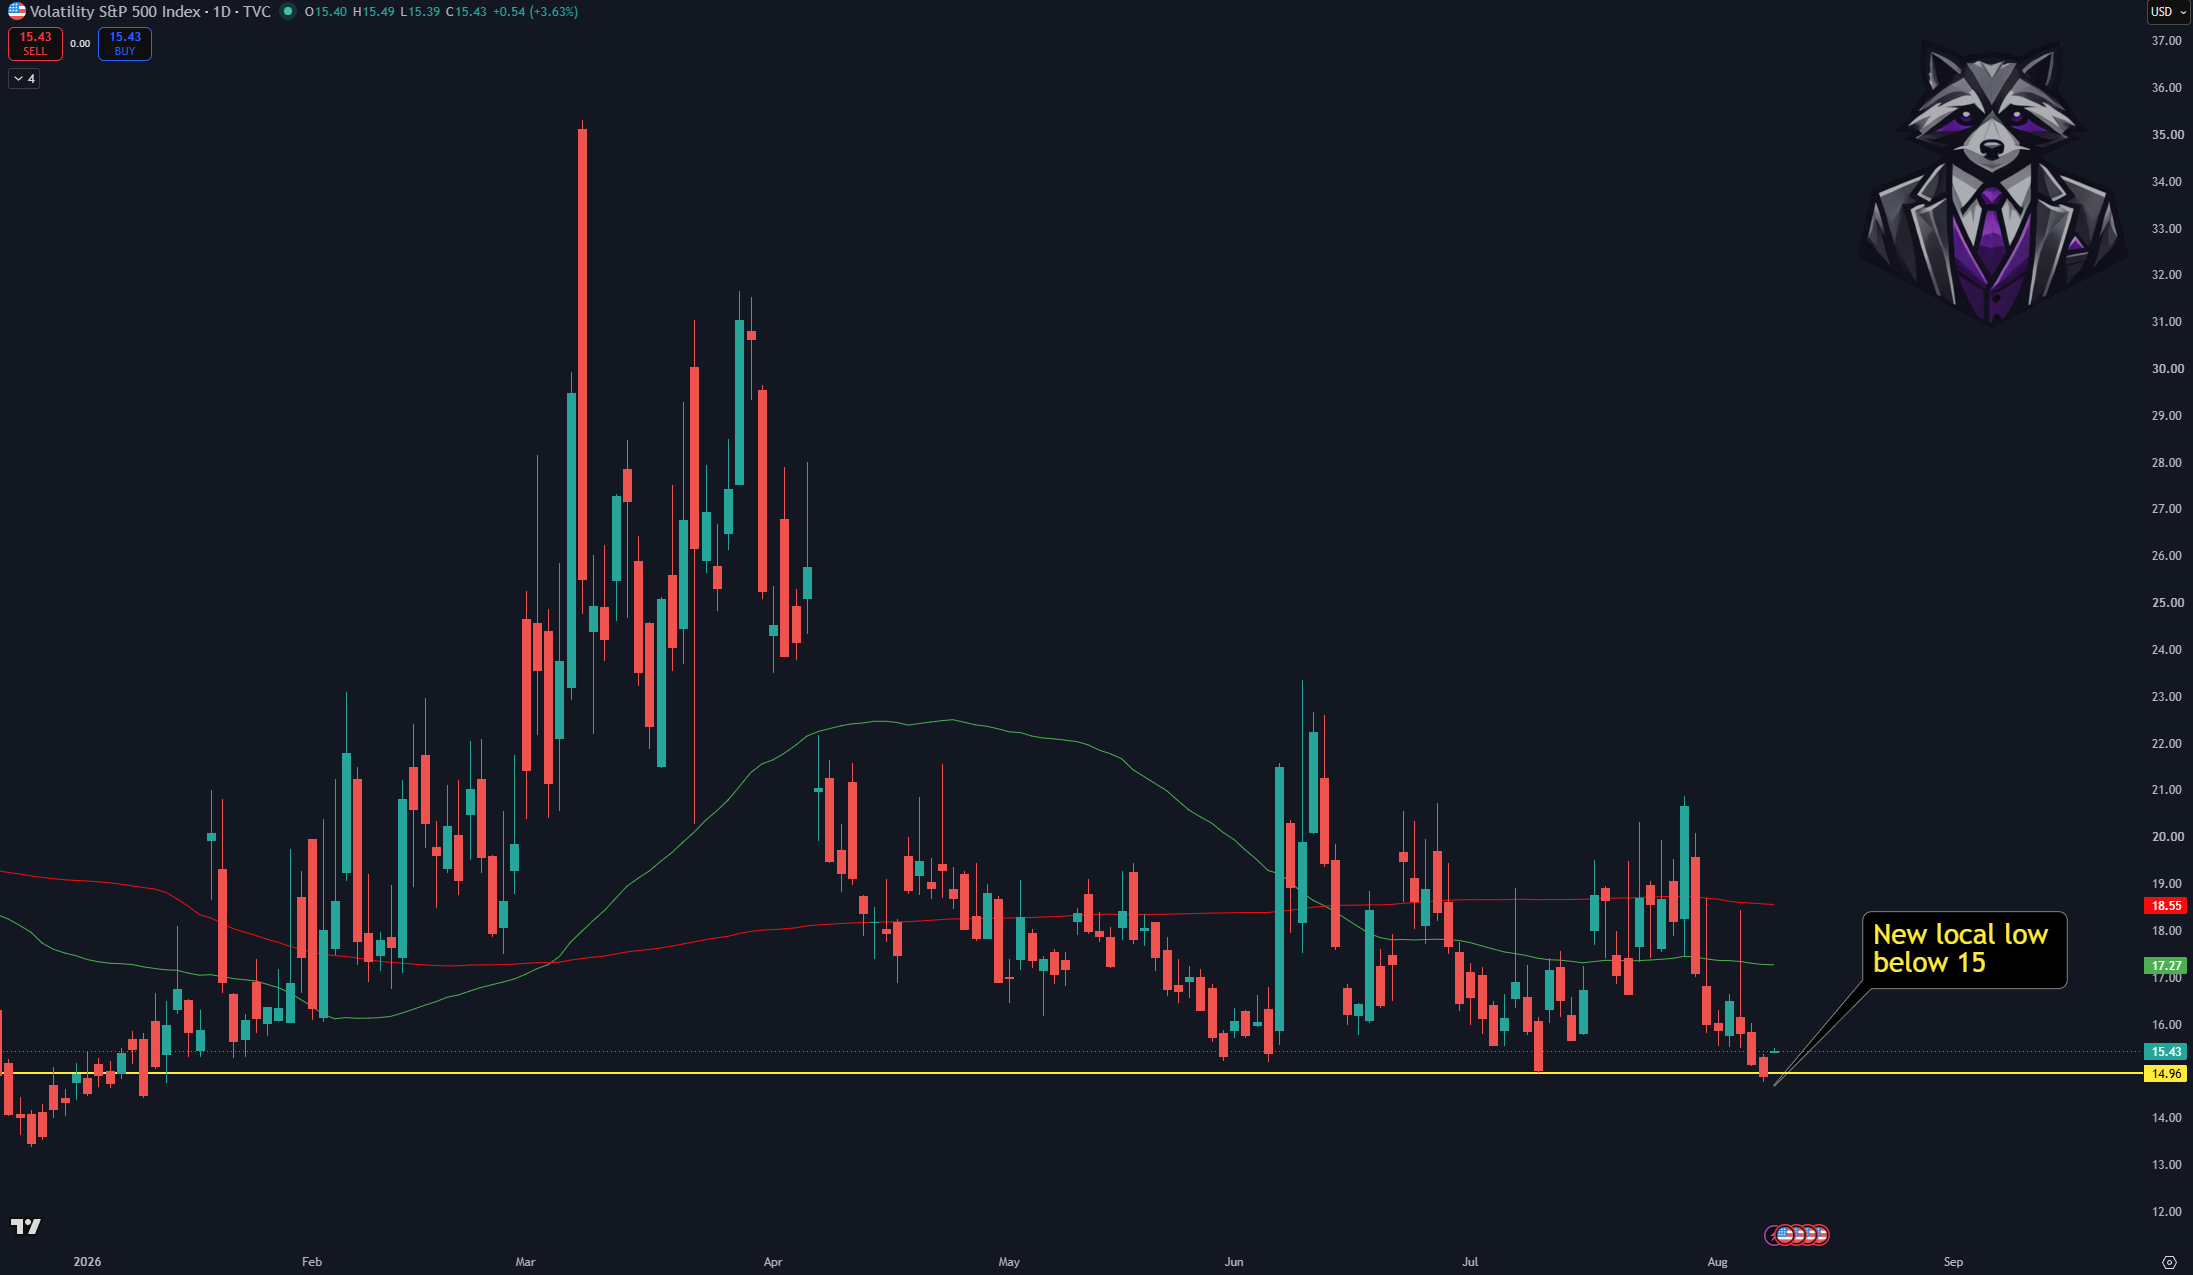
This week’s CPI and PPI prints will decide whether Friday’s rate-relief story sticks or gets rewritten.
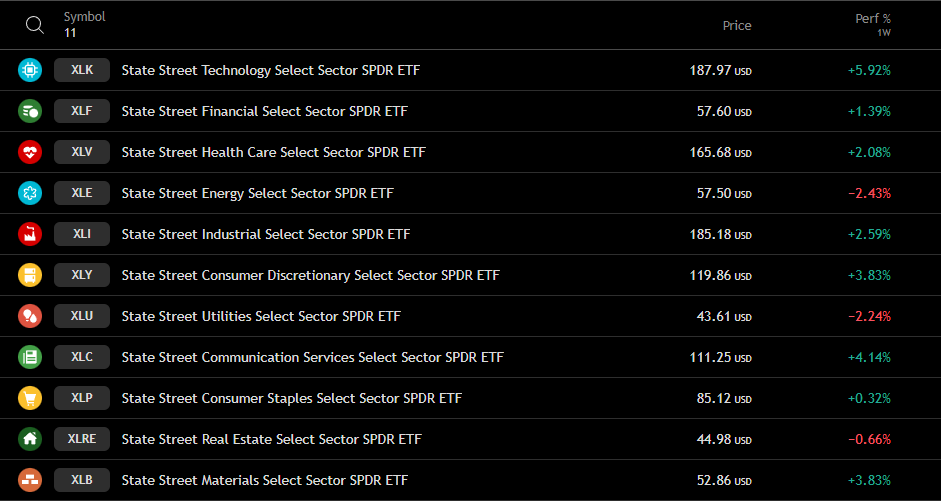
Last week’s advance was real, but it was not uniform. Technology reasserted leadership and helped the Nasdaq catch some of the ground it had lost versus the S&P. Several cyclicals participated less. The tape still rotates; it just rotated back toward the names that move the indexes hardest.
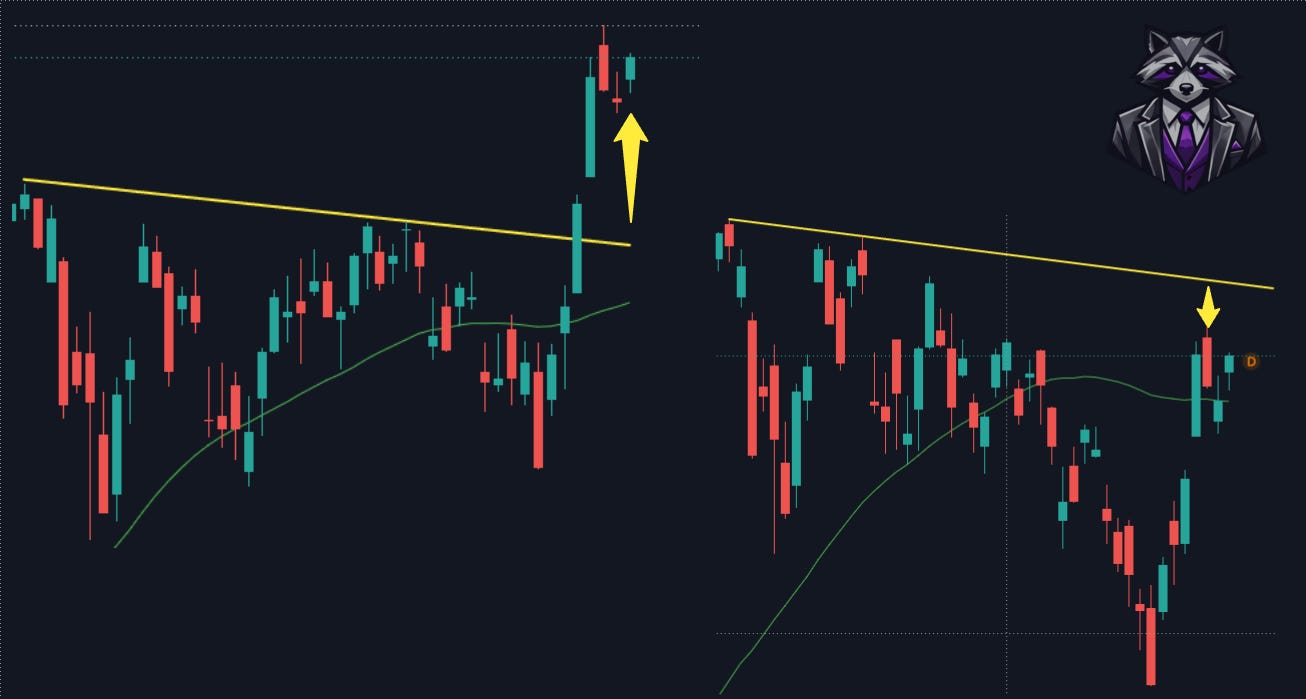
Memory was the soft spot inside the growth complex. SanDisk and Western Digital both gapped lower after earnings even where the prints beat consensus. The broader AI trade still wants larger guidance and clearer returns on data-center spend. That keeps semiconductor participation conditional rather than automatic.
Cross-asset, oil softened as Middle East shipping and ceasefire talk leaned less urgent. Gold had one of its strongest weeks in months after basing near prior lows. Softer yields, a softer dollar, and a soft jobs print gave the metal a cleaner bid. That backdrop is why GLD sits in this week’s watchlist, not as a trade call, but as a structure read against the same rates story the indexes are pricing.
The constructive bias from recent pullbacks still holds as long as buyers keep showing up. Only the Nasdaq among the majors is still hugging its 50-day average closely enough to look unfinished. The risk is not the Friday rally itself. It is carrying compressed vol into CPI and PPI while leadership stays concentrated.
For this week’s August 14 expiration, SPX is starting from a supportive position — but the first real test is already overhead.
HVL at 7745 is the gamma flip. Spot near 7758 sits just above it, so the index is in positive GEX: dips can be absorbed more cleanly than below the flip. The Call Wall (C1) is right above at 7800. Beyond that, the strongest call volume prints at 7940. On the put side, the Put Wall sits at 7670.
The tape looks a touch overextended after the push to highs, but a two-day correction already printed inside that stretch. The open question is whether any further digestion happens in time (sideways under the call wall) or in price (a deeper giveback toward HVL / the put wall).
Key levels from the current structure:
🔵 Regime
7745 — HVL (gamma flip · positive above)
🟢 Call GEX
7800 — C1 (Call Wall · largest call NETGEX)
⭐ Call OI / volume
7940 — CV (largest call volume)
🔴 Put GEX
7670 — P1 (Put Wall · largest put NETGEX)
📊 Options panel
IVRank 27.3 · IVx 14.6 · IVx 5d -0.9% · Put skew PUT$ 38.2% · Implied move ±0.5% (±38.6 pts)
Put pricing skew is historically low. Hedge intensity is thin — the same story the sub-15 VIX is telling. That leaves the book light into a week where CPI and PPI can reprice the rate path quickly. Hedging activity can still pick up before those prints; quiet skew into an inflation stack is not the same thing as a settled regime.
🟢 Upside Scenario — Hold Above HVL, Press the 7800 Call Wall
The bullish path starts with a hold above 7745 HVL.
That keeps the regime supportive and keeps the focus on the overhead call cluster. The first test is 7800 C1. Acceptance through the Call Wall opens space toward the 7940 call-volume peak. In positive gamma above HVL, dips can be absorbed more cleanly, but C1 can still stall the first extension attempt — especially if the market is still digesting the prior stretch higher.
🔴 Downside Scenario — Reject at C1, Lose HVL, Test the Put Wall
The bearish path begins with rejection under 7800 C1 and a failed hold of 7745 HVL.
Losing HVL flips the regime from supportive to fragile. The first major put reference is 7670 P1, the Put Wall. With put skew already compressed and VIX quiet, there is less “paid insurance” cushion if the inflation prints force a faster hedge rebuild on the way down.
The downside map is:
First warning: reject under 7800 C1
Regime line: 7745 HVL
Put Wall: 7670 P1
Below HVL: structure becomes more fragile; vol can expand into the put cluster
🔹 What the Current Structure Tells Us
SPX is constructive above 7745 HVL, but already coiled under the 7800 Call Wall after a short two-day pullback. The first repair is holding the flip. The first extension is clearing C1 toward 7940. Below HVL, put GEX is led by the 7670 Put Wall.
Low PUT$ and a sub-15 VIX say the market is not paying hard for downside right now. CPI and PPI are the catalysts that can change that bid for protection in a hurry.
The key level is 7745 HVL.
Above it, structure stays more constructive.
Below it, the market is more vulnerable to wider swings into 7670.
This week is not only about indexes and inflation prints. Gold’s rebound, Oracle’s call wall, and Microsoft’s mega-cap structure are three instruments worth monitoring.
On the Aug 21 GEX profile, 400 is a real confluence zone, not a lonely Call Wall label. That strike stacks C1 (Call Wall) with the largest Absolute GEX, the highest call open interest, and the largest call volume. Spot is pressed right into that pile, so the options book is heavily anchored overhead.
Underneath, the Put Wall sits at 370. That is the main put GEX floor on this map, well below the flip. Spot holds in a positive GEX regime above 385 HVL, so the first structural story is still the 400 cluster, not a regime break.
Call pricing skew is elevated: CALL$ at 59%. Calls at an equivalent distance from spot are priced about 59% richer than the matching puts. That fits a tape leaning into the call wall rather than paying up for downside.
On the Aug 21 GEX profile, 150 is the hinge. That strike is the Call Wall, the largest Absolute GEX, the highest call open interest, and the largest call volume — a full confluence ceiling with spot near 146.75 pressed just underneath.
Spot holds in a positive GEX regime above 125 HVL. The Put Wall sits on the same level at 125.
Call pricing skew is elevated: CALL$ at 57%. Calls at an equivalent distance from spot are priced about 57% richer than the matching puts — the book is leaning into the call wall, not paying up for downside.
On the All Expiry GEX profile, 500 is the Call Wall and a full confluence pile: largest Absolute GEX, highest call open interest, and Friday’s strongest call volume all land on the same strike. Spot is pressed right into that level, so the long-dated options book is heavily anchored there.
That 500 print also matters as prior support flipped to resistance — structure, not just a GEX label. Worth watching whether price accepts through the wall or keeps rejecting it.
The pricing backdrop is quieter than the wall looks. Call pricing skew is low and IV is compressed, so the call side is not richly overpriced into this cluster. The story is inventory and level memory at 500, not a crowded, expensive call chase.
🏛️ Policy & macro
· CPI — midweek inflation print that can reprice September odds
· PPI — follow-through inflation window after CPI
· Retail sales — July print, consensus around 0.2%
· U. Michigan — preliminary sentiment Friday
📉 Vol & rates
· VIX — can the sub-15 handle survive the inflation stack?
· Yields / dollar — do they confirm Friday’s soft-payrolls relief or reverse on hot CPI/PPI?
· Put skew — PUT$ near 38% is historically light; does hedging rebuild into CPI/PPI?
🏗️ Structure
· SPX — hold 7745 HVL vs rejection under 7800 C1
· 7670 P1 — Put Wall if the flip fails
· NDX — does tech leadership finally print a cleaner high, or stay a catch-up tape?
Last week rewarded the selective book. Soft data eased the rate path, tech reclaimed leadership, and vol got quiet enough that the tape looked easy again.
Quiet vol into CPI and PPI is not the same thing as a settled regime. A relief bid can be real and still fragile if the next print reopens the hike debate. Leadership that concentrates in a few large names can keep the indexes green while the average stock does less work.
That is why we start from structure. GEX is not a crystal ball. HVL is not a mechanical trigger. A call wall is not a guaranteed top, and a put wall is not a guaranteed bottom.
The value is knowing whether price is accepting above the flip, stalling at a Call Wall, or losing the put map before you choose a strategy for the week.
This week’s case study looks at a Microsoft Jade Lizard opened in a high-IV post-selloff environment, with price stabilizing near HVL.
The thesis was range-bound: keep the short put near the 350 put-side cluster (with breakeven below that shelf), and short a call spread defined so a sharp upside move could not create unlimited risk. The position was positive delta, positive theta, and negative vega — built for sideways-to-quiet trade and IV contraction into the April expiry window.
Price did what the structure wanted. After one more dip, MSFT chopped sideways while theta and softer vol worked. The position was closed early with about two weeks still left — roughly $310 profit, over half the original $585 credit — with no adjustments along the way.
The exit was not “max profit.” Delta was still positive, so another leg lower would have started working against the trade. Capturing most of the credit while the thesis was intact mattered more than squeezing the last dollars into expiry.
Full step-by-step breakdown — including adjustment ideas — in this week's video:
⚠️ Trade with flat-delta, high risk-reward structures, keep your positioning adaptable, and always monitor the GEX levels and the surrounding gamma environment — they'll tell you more about the path ahead than the headlines ever will!
You can find additional valuable content on our YouTube channel, and if you feel like trying out our
⭐ GEX-Live Charting View, you can do so with a 7-day free trial here: ⭐
This material is for educational purposes only; TanukiTrade is not a financial advisor, and nothing here constitutes investment advice or a recommendation.
No posts
Comments
Nothing yet. Say the first thing.
Sign in to join the conversation.