
Don’t take my word for it; try it yourself.
Allow me to introduce the Golden Butterfly Portfolio Vintage edition.
There is nothing exotic here.
40% equities, split evenly between large caps (S&P 500 Total Return) and small caps (Russell 2000 Total Return).
40% bonds, split across duration (7–10 year and 20+ year US Treasuries).
20% gold.
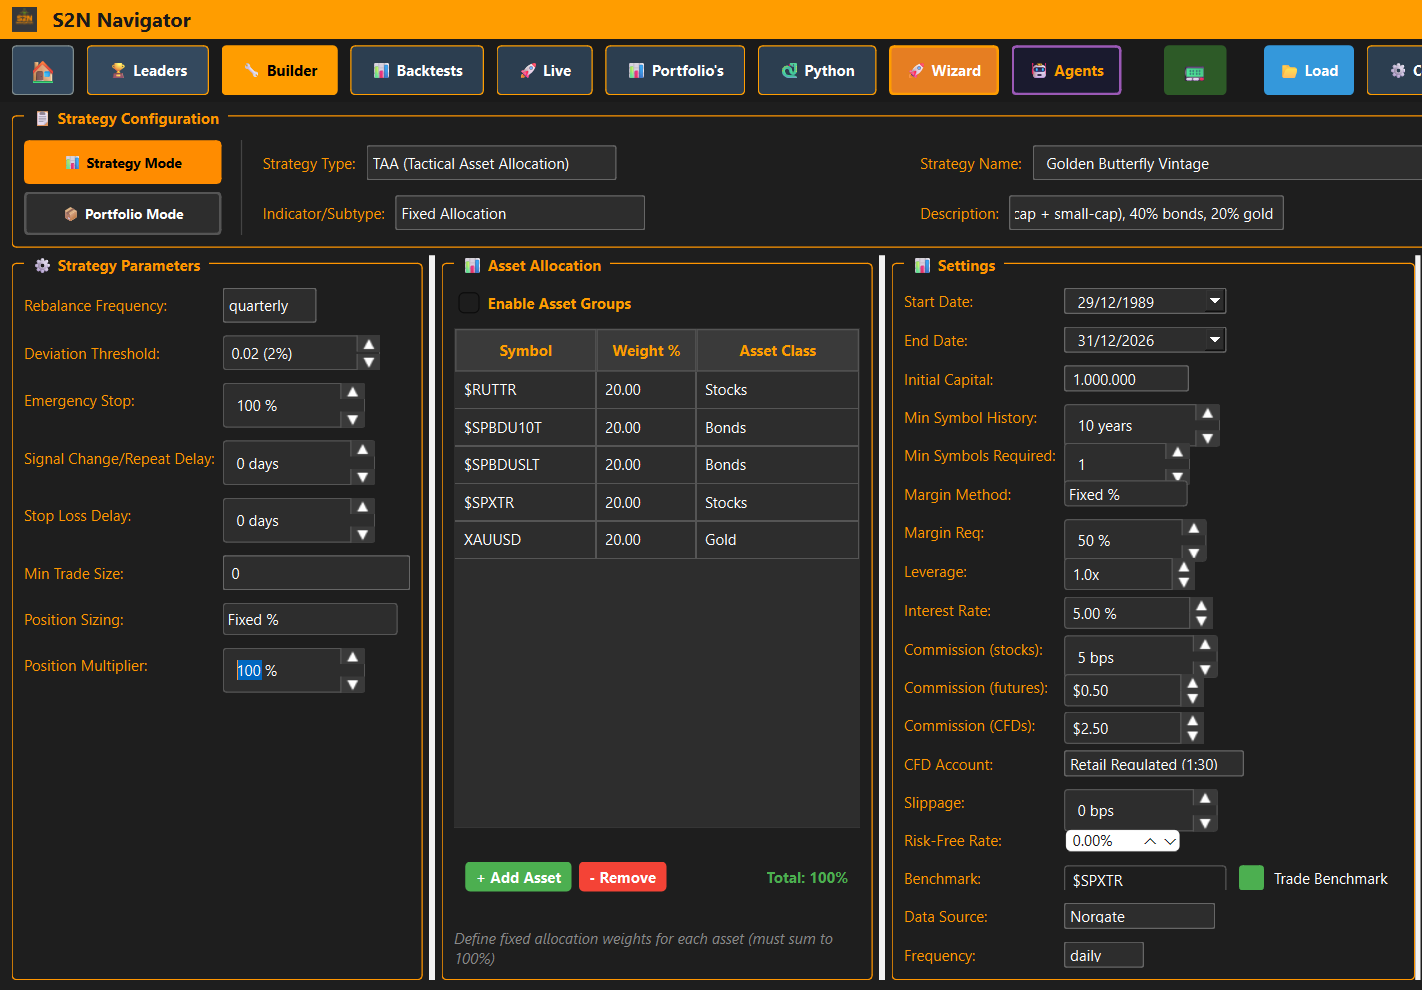
That’s it. No signals. No timing. No optimisation. And yet…
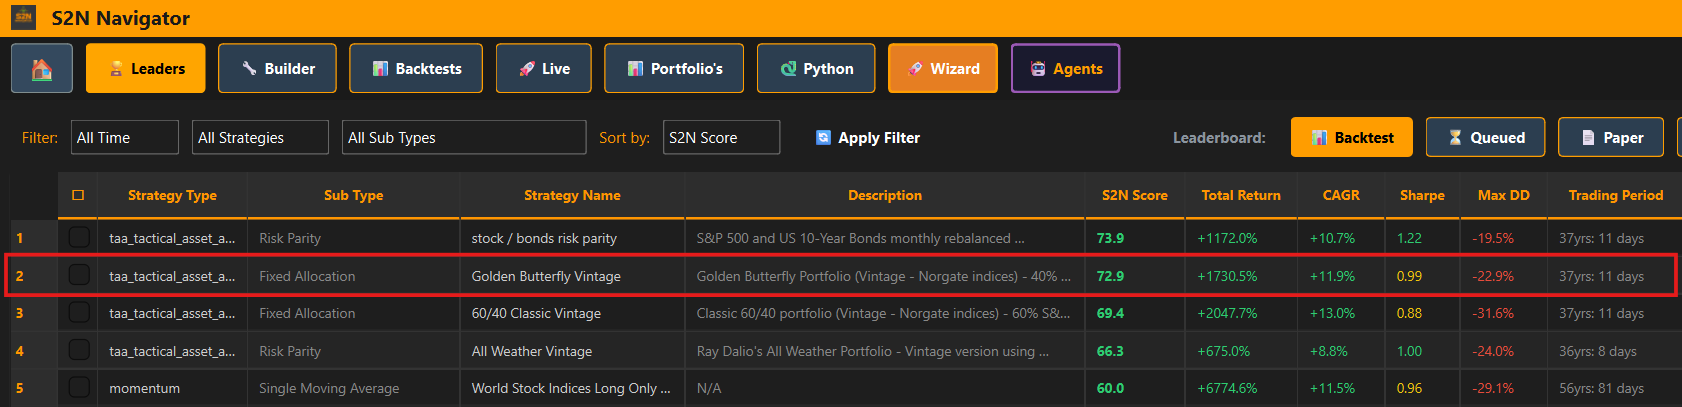
The result is a phenomenal 72.9 S2N Score now ranked #2 on our leaderboard.
I have made a small adjustment to the S2N Score to better account for total return histories. The longer the track record, the less weight we need to place on statistical protections against luck.
If a strategy survives 30+ years of different regimes, inflation cycles, crises and recoveries, that is already doing most of the heavy lifting. Time has a way of exposing fragility. And rewarding robustness.
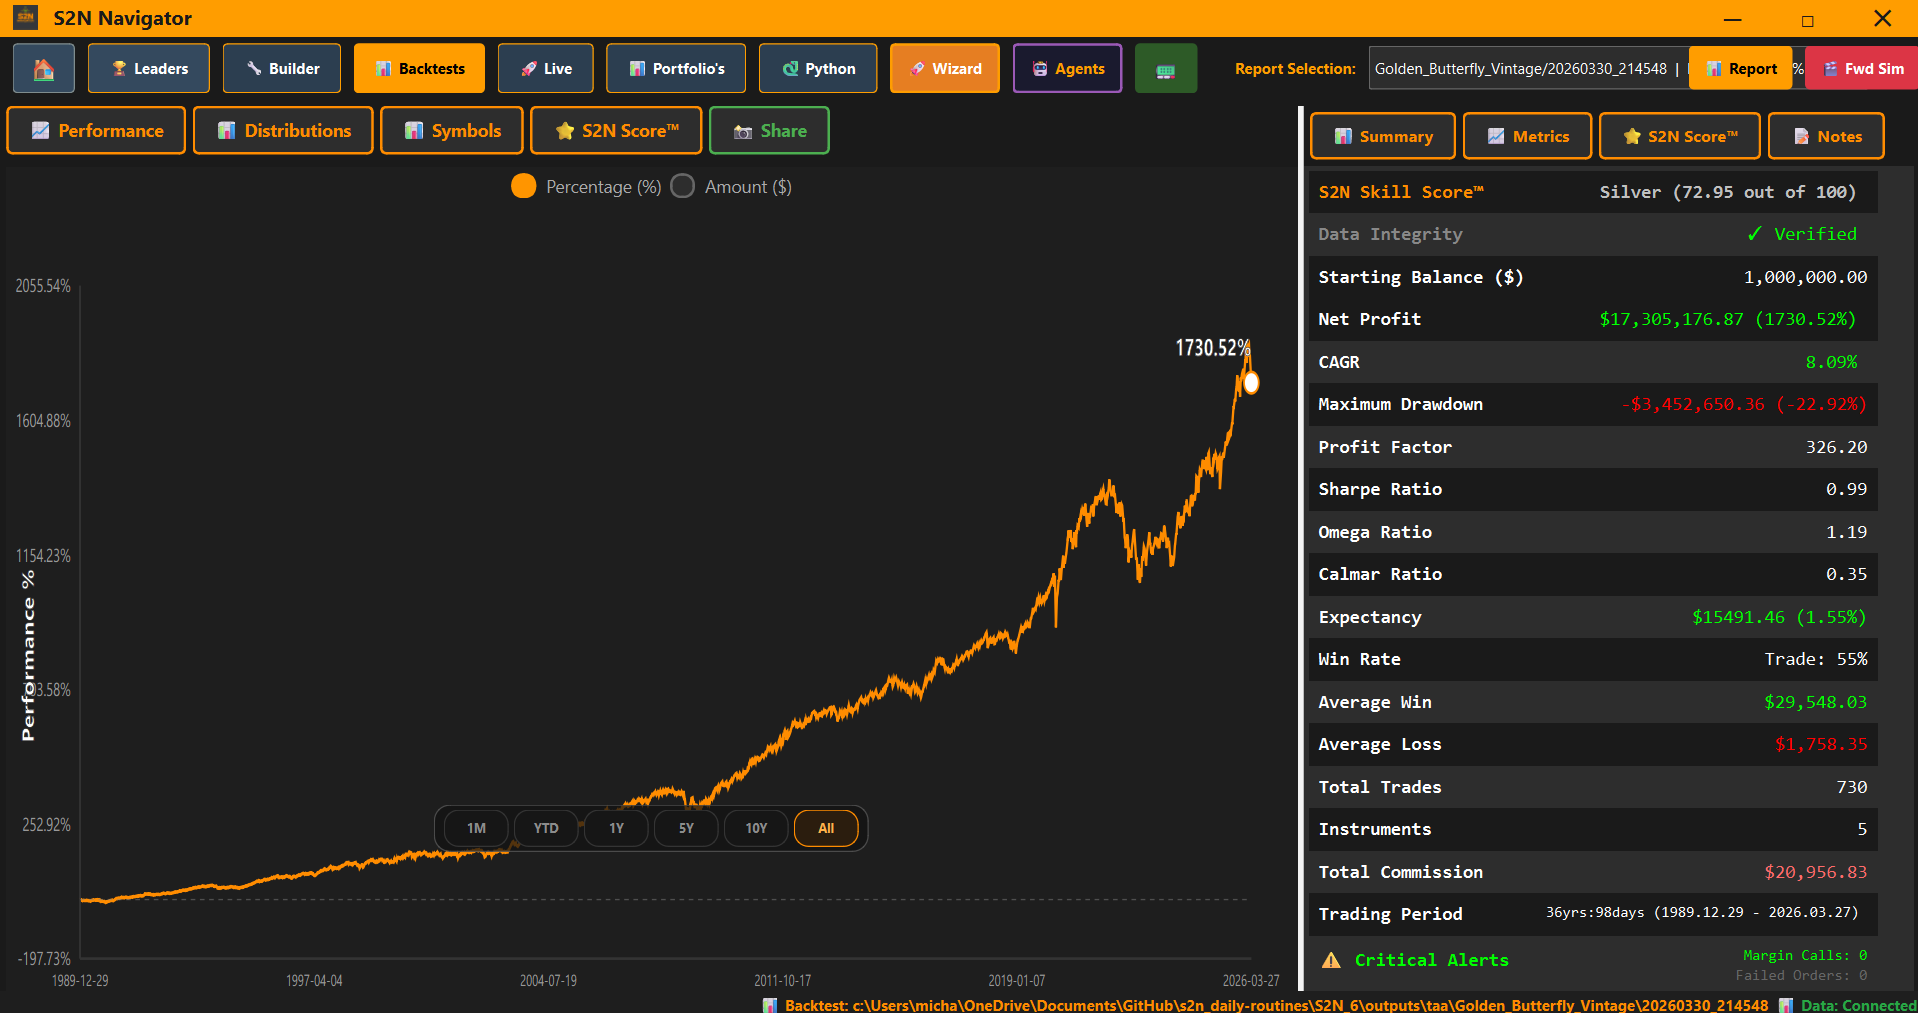
This really is an equity curve to dream of.
The breakdown of the portfolio and each asset’s contribution
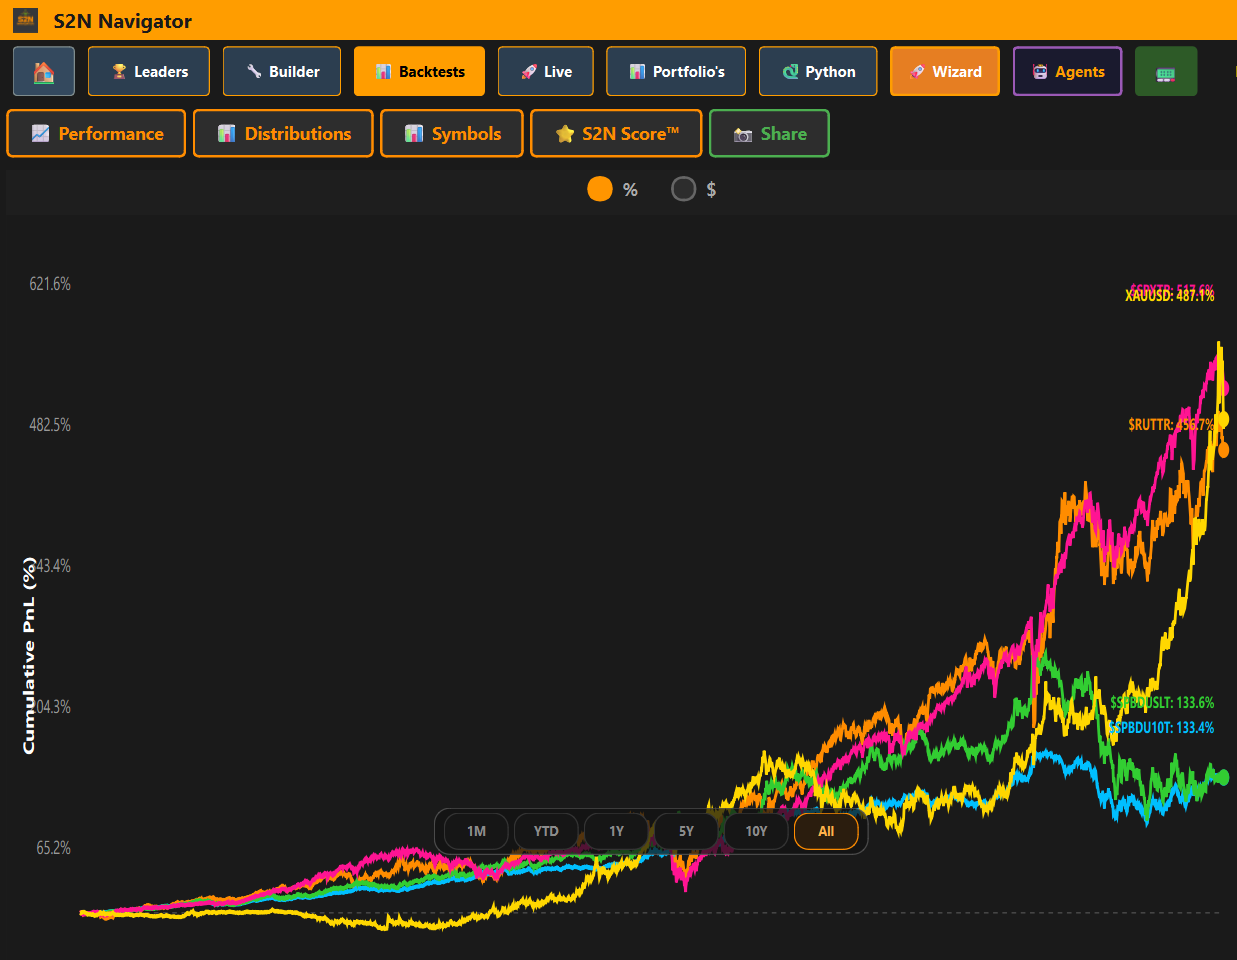
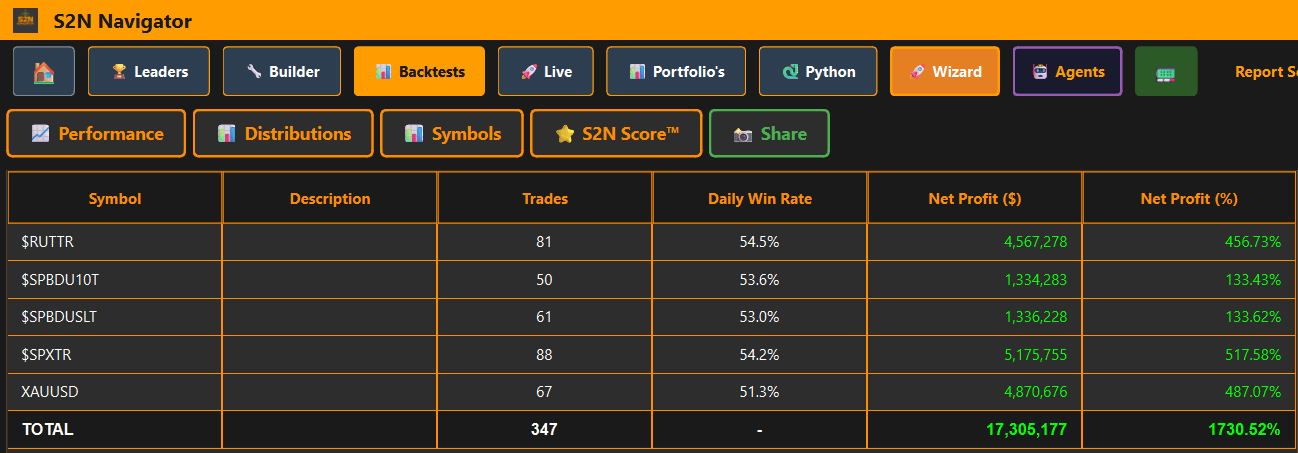
What stands out here is not the return. It’s the lack of fragility.
There is no dependency on a single regime. No reliance on one asset doing the heavy lifting. No clever trick hiding in the data.
Just balance.
This is the uncomfortable truth. You can spend years trying to engineer alpha… Or you can accept that most of it comes from not blowing yourself up in the first place.
Don’t take my word for it; try it yourself.
No posts
Comments
Nothing yet. Say the first thing.
Sign in to join the conversation.