
The Problem
The case against earnings per share as a scoreboard rests on one mechanism. A company that borrows money to repurchase its own shares shrinks the denominator and improves the metric without touching the business underneath. Return on equity moves the same way, for the same reason, and the damage is worse. Earnings per share is at least widely suspected. Return on equity gets quoted as evidence of quality, and screeners are full of businesses posting 30%, 40%, 50% and higher.
Consider a business with $1.00 billion of assets funded entirely by equity, and $150 million of operating profit. At a 25% tax rate it earns $112.5 million. Return on equity is 11.25%. Now borrow $500 million at 6% and use every dollar of it to repurchase stock. Operating profit is unchanged, interest consumes $30 million, after-tax income falls to $90 million, and equity has halved to $500 million. Return on equity is 18.00%.
That is 675 basis points of improvement, produced by a transaction that lowered net income by $22.5 million. Return on assets went the other way, from 11.25% to 9.00%. Same operations, same customers. The company now carries $500 million of debt and a fixed interest obligation that has to be paid in a recession as well as a boom. An investor screening on return on equity alone will systematically prefer the more leveraged of two otherwise identical companies.
There is a second failure, and it is stranger. Sustained repurchases reduce book equity directly, year after year, and a company that has bought back stock for two decades can push the denominator down to zero and through it. At that point return on equity becomes enormous, then undefined, then negative. This happens to profitable, well-run businesses. The metric breaks precisely where it is quoted most often.
S&P Dow Jones Indices runs straight into this problem. Its quality indices, the S&P 500 Quality Index among them, do not rank companies on return on equity alone. The quality score averages three standardized measures: return on equity, the balance sheet accruals ratio, and the financial leverage ratio, defined as total debt divided by book value. High ROE raises the score. High leverage lowers it. An index provider building a systematic quality screen had to subtract leverage back out before return on equity would behave, which is this argument expressed as a formula.
None of this makes return on equity useless. It measures something real, and for one important class of business it is the correct metric. A raw figure taken alone simply cannot separate an exceptional business from a leveraged ordinary one. What follows is what return on equity actually measures, how to decompose it, the four ways it misleads, and when to trust it.
The Definition
How to calculate return on equity is the easy part. Net income divided by shareholders’ equity, and that is the whole formula. Shareholders’ equity is the book value of the company, total assets minus total liabilities, representing the capital contributed by owners plus the earnings retained over time. Both inputs come straight off the financial statements. Net income sits at the bottom of the income statement, shareholders’ equity at the bottom of the balance sheet. The question the ratio asks is a good one: how productively is the business using the owners’ capital?
Warren Buffett made that question central long before the metric became a screener default. In the 1979 Berkshire Hathaway letter he named the primary test of managerial economic performance as a high earnings rate on the equity capital employed, and set it against consistent gains in earnings per share. He put Berkshire’s own figure that year at 18.6% of beginning net worth. Earnings per share had risen roughly 20%, and he called that the improper number to watch. It climbs automatically on a dormant savings bond.
The parenthesis in that sentence is the part the market dropped. Buffett qualified his test as one to be met “without undue leverage, accounting gimmickry” and similar devices. The exclusion was explicit. Describing the fifteen-year record in the same letter, he noted that Berkshire had achieved it while using a low amount of leverage and without significant issuance or repurchase of shares. Both mechanisms that manufacture return on equity were excluded by the man who elevated the metric.
Buffett’s own measurement was stricter than the convention that followed him. He reported operating earnings before securities gains, measured against equity with securities carried at cost, and against the equity base standing at the start of the year. Three deliberate choices, each closing off a way for the denominator to flatter the result. A screener applies none of them.
The weakness is structural and it lives in the denominator. Shareholders’ equity is an accounting figure shaped by things with no connection to operating quality: debt, repurchases, accumulated losses, write-downs, and the accounting treatment of acquisitions. The numerator measures business performance. The denominator measures a financing and accounting outcome. That mismatch generates every problem in this piece.
So what is a good ROE? Convention puts the threshold somewhere in the mid-teens. That threshold is a habit of the industry, and it survives mostly because it gets repeated. A 40% return on equity built on borrowed money and a 20% return built on operating excellence describe different animals, and the headline figure will never tell them apart. Separating them means taking the ratio apart.
The Decomposition
The DuPont decomposition splits return on equity into three components that multiply together. The arithmetic is exact. It survives in professional practice because it answers the only question worth asking about a high ROE: which part of the business produced it? In plain terms, the three components describe how much profit the business makes on each dollar of sales, how efficiently it converts assets into those sales, and how much of the asset base is funded by somebody other than the shareholders.
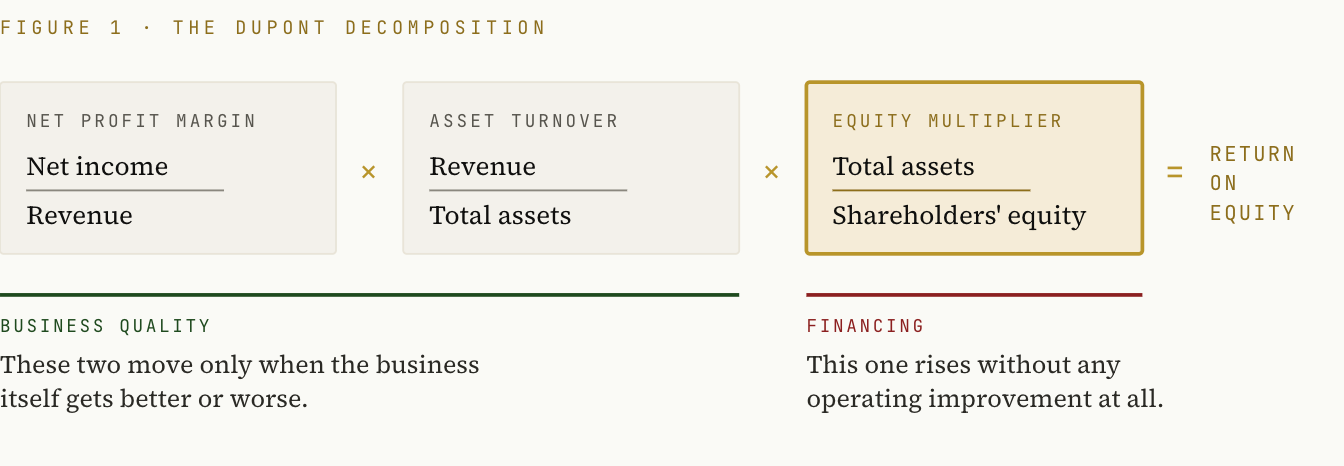
Net profit margin — net income divided by revenue. How much of each dollar of sales survives to the bottom line. High margins usually reflect pricing power, a structural cost advantage, or a model that costs almost nothing to serve one more customer. This is the component tied most directly to competitive advantage. A moat shows up here first.
Asset turnover — revenue divided by total assets. How much revenue each dollar of assets generates. High turnover indicates a capital-efficient business, low turnover a capital-intensive one, and neither reading is automatically the better one. Luxury goods run high margins on low turnover. Discount retail runs the reverse. Both models can produce excellent returns.
Equity multiplier — total assets divided by shareholders’ equity. The leverage term, and the one that matters most here. A business funded entirely by equity carries a multiplier of 1.0x; one funded largely by debt and payables can run at 5x, 10x, or more. This component rises without a single operational improvement. It rises when the company borrows, when it repurchases stock, and when it stretches its suppliers.
The multiplier has to be read against context. A software company funded with equity and deferred revenue might run near 1.5x. A grocer stretching its payables runs higher without having borrowed a dollar. A bank runs many times higher again, by design and by regulation. The figure means nothing in isolation. It acquires meaning against the same industry, in the same period, and against the company’s own history.
Multiply the three and the product is return on equity, exactly. Which gives an investor looking at any high-ROE business one decisive question to ask: margin, efficiency, or leverage? The first two describe how the business works. The third describes how it is financed. Two companies can report the same headline figure with opposite compositions, and the decomposition is the only thing that separates them.
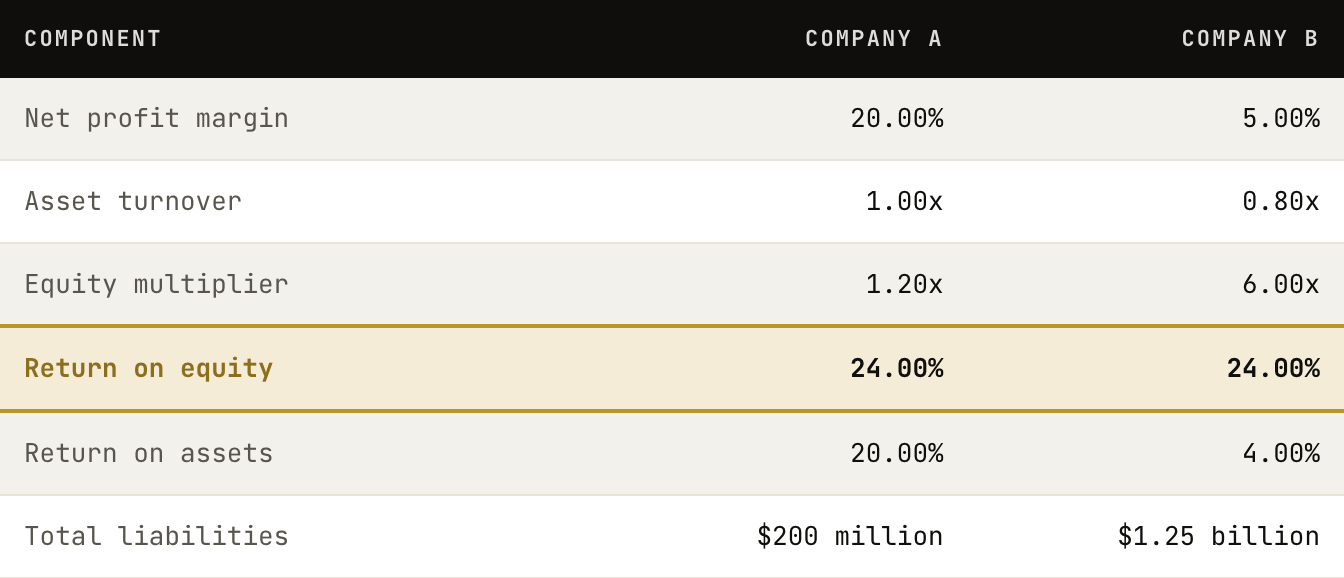
Identical return on equity. Company A earns $240 million on $1.20 billion of assets against $1.00 billion of equity. Company B earns $60 million on $1.50 billion of assets against $250 million of equity and $1.25 billion of liabilities. On return on assets, the measure leverage cannot reach, Company A is five times better. A screen sorted on return on equity ranks the two of them equal.
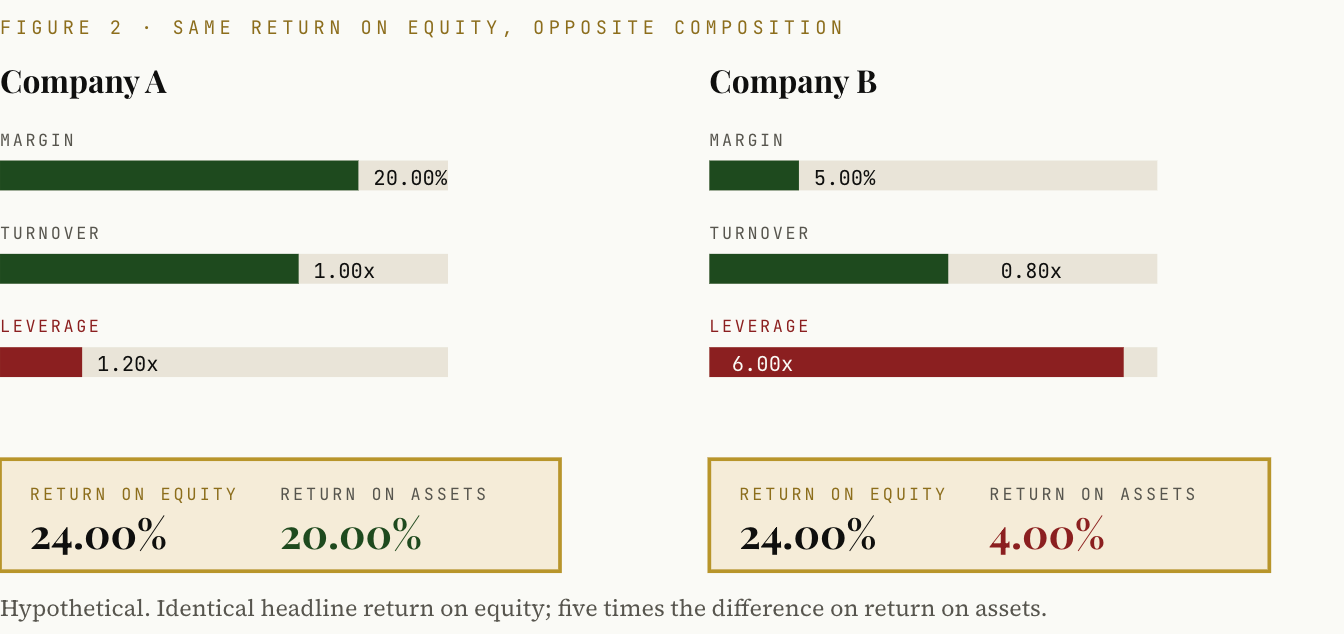
Company B may still be a perfectly viable business. Its owners earn their 24% by accepting $1.25 billion of liabilities against $250 million of equity, and that arrangement behaves very differently in a downturn. The decomposition delivers no verdict. It delivers the composition.
The decomposition takes five minutes. Net income and revenue come off the income statement, total assets and shareholders’ equity off the balance sheet. Four numbers, two documents. What comes out converts a figure that can be manufactured into a description of how the business actually works, and it does so before any judgment about quality is required.
The decomposition inherits the denominator it exists to explain. When shareholders’ equity turns negative, the equity multiplier turns negative with it, and the three components still multiply out to the reported figure while describing nothing at all. Margin and turnover stay perfectly readable in that case. The third term has stopped carrying information. A decomposition that produces a negative leverage multiple is an instruction to stop and use a different denominator.
The Distortions
Leverage inflates the number without improving the business. Debt funds part of the asset base, less equity funds the same assets, and the same operating profit gets divided by a smaller denominator. The mechanism is arithmetic and it is reliable. A mediocre business with enough borrowing will screen better than an excellent business with none. The higher reading is the arithmetic shadow of the added risk, and it vanishes in the year the interest cannot be covered.
Buybacks shrink the denominator, sometimes to nothing. Repurchases reduce book equity directly. Run the program long enough and the denominator approaches zero, then crosses it. AutoZone closed fiscal 2025 with a stockholders’ deficit of $3.41 billion, having repurchased $1.53 billion of stock during the year, against net income of $2.50 billion on sales of $18.94 billion. Return on equity computed from those figures is negative 73.2%. The company’s own annual report puts its after-tax return on invested capital at 41.3% for the same year, which is the figure that describes the business. A screen ranking companies by return on equity places AutoZone at the very bottom, below businesses earning nothing at all.
Accounting shapes the denominator more than operations do. Shareholders’ equity records history. A large acquisition adds goodwill, inflates equity, and depresses the acquirer’s return on equity for years afterward regardless of how the deal performs. A write-down does the opposite: it destroys equity and lifts every subsequent reading, so the metric improves in the aftermath of a failure. Asset-light businesses show the same distortion from the other side. Brands, software, and network positions rarely appear on the balance sheet at anything close to their economic worth, so companies built on them post very high returns on a book value that describes almost nothing.
A single year says nothing about a cycle. Return on equity moves with earnings, so a cyclical business prints a spectacular figure at the peak and a negative one at the trough. Judging quality from either extreme repeats the error of valuing a cyclical on peak earnings. The through-cycle average is the only reading worth having.
The direction of travel makes the point. AutoZone’s stockholders’ deficit narrowed from $4.75 billion at the end of fiscal 2024 to $3.41 billion at the end of fiscal 2025, an improvement of $1.34 billion. Return on equity over the same two years moved from negative 56.0% to negative 73.2%. The balance sheet got healthier and the metric got worse, because a smaller negative denominator divides into a positive numerator more violently.
Every one of the four lives in the denominator. Net income carries its own quality questions, which is the subject of the owner earnings discussion, and those questions apply to any profitability metric equally. What makes return on equity specifically unreliable is that shareholders’ equity is a financing and accounting artifact rather than a measure of the capital the business needs in order to operate. That single fact generates all four distortions. It also points straight at the corrective.
The Comparison
Return on invested capital solves the denominator problem by measuring returns against all the capital the business uses, equity and debt together, net of cash. Because borrowed money sits inside the denominator, borrowing cannot improve the result. The earlier treatment of ROIC made the point on the numerator side as well: operating profit after tax excludes interest, so two identically-operating businesses carrying different debt loads produce the same figure. Financing washes out of both halves.
Set ROE vs ROIC side by side and the decision rule follows directly. Use ROIC when the question is whether this is a good business, because it isolates operating quality and permits comparison across companies financed differently. Use return on equity when the question is what return the owners’ capital is earning given how the business happens to be financed. That second question is a legitimate one, and it is a different one. Both are worth asking. When the two measures diverge sharply, the divergence is itself the information: a high return on equity alongside a mediocre ROIC is a leverage story, not a quality story.
The practical consequence shows up in screens. A high-ROE screen returns a mixture of exceptional businesses and heavily indebted ordinary ones, with nothing built in to tell them apart. A high-ROIC screen returns businesses earning real returns on the capital they deploy. For an investor hunting compounders, the second screen works. Which of the two a company emphasizes in its own investor materials is occasionally revealing.
The Exception
For banks and insurers, leverage is the business. A bank funds assets with deposits and borrowings and earns a spread on the difference. Its balance sheet is the production line, and the size of that balance sheet is the constraint on output. Regulators set the minimum equity an institution must hold against those assets, which makes the equity multiplier a supervised variable. Applying ROIC to a bank produces a confused answer, because no clean line separates operating capital from financing.
For these businesses the appropriate measures are return on equity, return on assets, and return on tangible common equity, which strips goodwill and other intangibles out of the denominator to show the return on capital genuinely capable of absorbing losses. Supervisors use them. The institutions use them in their own disclosure and in their own compensation targets. A bank sustaining a mid-teens return on tangible common equity through a full credit cycle has demonstrated something real about its underwriting.
Buffett reached for the banking measures himself. Reporting on Illinois National Bank in that same 1979 letter, he cited earnings of roughly 2.3% on average assets and put that at more than three times the level of the average major bank. Return on assets, for a bank, from an investor who spent the rest of the letter arguing for returns on equity. The metric follows the business model.
The corollary runs in the other direction too. Comparing a financial institution with an operating company on headline return on equity sets a regulated, deliberately leveraged model against one where leverage was discretionary, and the comparison measures nothing. Where a single comparison spans both types, as it does between a payments network carrying no credit risk and an integrated issuer that lends to its own cardholders, headline returns on equity cannot adjudicate anything at all. Returns have to be rebuilt on a basis that reflects the capital each model genuinely requires. The right return metric depends on where the money funding the business comes from, and choosing the wrong one produces a confidently wrong answer.
The Discipline
Never take a return on equity figure at face value. Decompose it into margin, turnover, and multiplier, and identify which component is doing the work. Check the multiplier against peers in the same industry, because the normal level varies enormously by business model. Look at the trend across a full cycle. Then set the figure against ROIC, and treat a wide gap between them as a leverage story the headline is concealing.
One technical choice deserves attention, because it changes the answer. Return on equity can be calculated against beginning equity, ending equity, or the average of the two, and all three produce different results for any company whose equity moved during the year. Buffett reported Berkshire against beginning net worth. S&P Dow Jones Indices, scoring companies for its quality indices, divides trailing twelve-month earnings by the latest book value per share, which is the ending figure. Neither convention is wrong. Pick one, apply it consistently, and check which one a company has used when it reports the number itself.
Return on equity also teaches a broader lesson about ratios. Any ratio improves when its denominator shrinks, and a denominator that reflects financing decisions will eventually shrink, sometimes deliberately and more often as a byproduct of ordinary capital allocation. The discipline generalizes. Ask of every metric what its denominator represents, and whether it can move for reasons unconnected to the quality of the business.
Return on invested capital establishes whether a business creates value on the capital it genuinely needs. Owner earnings establishes what that business produces for the people who own it. The moat framework establishes whether the returns will still be there in a decade. Each answers a different question. Return on equity sits alongside those three as a conditional measure: informative about how owners’ capital is being deployed, uninformative about business quality until it has been decomposed, and correct as the primary metric only where leverage is the business model itself.
The trap has a live illustration this week. A comparison of two payments businesses, one an open-loop network carrying no credit risk and almost no capital against the volume it handles, the other an integrated issuer that lends to its own cardholders, cannot be settled on headline returns on equity. The two figures are built from incompatible denominators. The head-to-head published earlier this week works that comparison through on a properly constructed basis, with a verdict anchored to price.
Quality Equities publishes independent research for informational purposes only. Nothing published constitutes investment advice or a recommendation to buy or sell any security. The author may hold positions in securities discussed.
No posts
Comments
Nothing yet. Say the first thing.
Sign in to join the conversation.