
Section 1
Two companies are collecting the proceeds of the same infrastructure buildout, and they are collecting them in opposite ways. Nvidia sells merchant silicon — general-purpose accelerators sold to anyone with a purchase order, wrapped in CUDA, the programming layer and library ecosystem that fifteen years of developers have been trained on and that most AI software is written against. Broadcom sells custom silicon: application-specific integrated circuits, which the company calls XPUs, co-designed with the handful of buyers whose internal workloads are large enough and stable enough to justify a bespoke chip. Google’s Tensor Processing Unit is the flagship of that program and has run through seven co-designed generations since 2014. Alongside it, Broadcom sells the Ethernet switching silicon that stitches thousands of accelerators into a single computer, and a large infrastructure software business built from VMware, CA, and Symantec.
The tension is not theoretical. Nvidia’s three largest direct customers accounted for 54% of revenue in the quarter ended April 26, 2026, and the hyperscalers behind those orders are the same companies underwriting Broadcom’s XPU programs. Whether that represents a marginal optimization at the edges or a structural transfer of economics is the most consequential open question in AI infrastructure, and these two businesses sit on opposite sides of it. The market has taken a view. At the July 24 close — the end of the worst week for semiconductor stocks in more than a year, as the market reappraised the pace of AI capital spending — Nvidia traded at $206.84 for a $5.05 trillion market capitalization and 19.1 times next-twelve-month earnings; Broadcom traded at $381.92 for $1.86 trillion and 22.1 times — or 24.4 times once both companies’ earnings are placed on the same accounting basis, an adjustment Section 7 shows is neither cosmetic nor small. Broadcom is priced as the faster-growing asset. Nvidia is priced as the one whose growth is about to be taken away.
What follows evaluates both businesses across five shared dimensions — moat durability, the merchant-versus-custom question itself, business mix and concentration, financial quality and capital allocation, and valuation — declares a winner on each, and closes with a single decisive verdict on which is the superior investment at today’s price, integrating quality and price on a risk-adjusted basis. The verdict was genuinely open at the outset. Both companies clear the quality filter comfortably; neither result was assumed.
Section 2
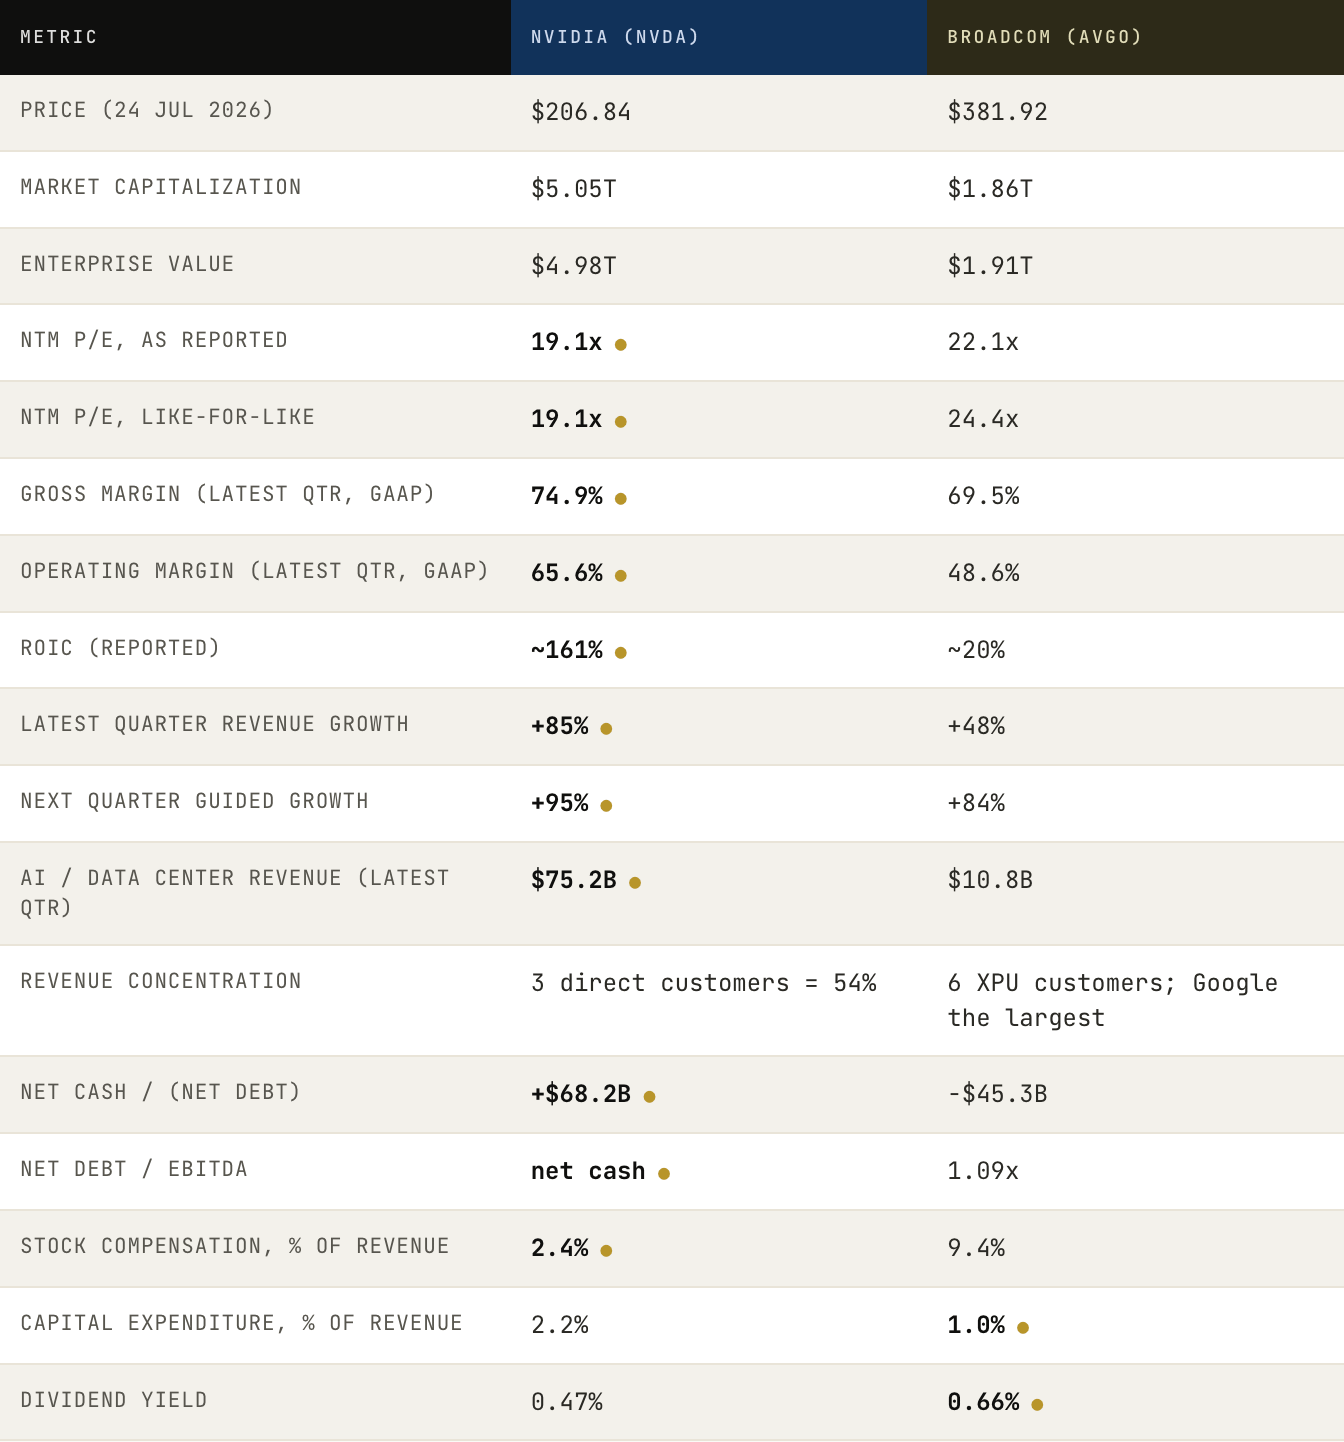
Sources: Nvidia Q1 FY2027 8-K and 10-Q (quarter ended April 26, 2026); Broadcom Q2 FY2026 8-K (quarter ended May 3, 2026); market data at the July 24, 2026 close. Gold dot marks the more favorable figure on that line; it does not imply the line is decisive. Fiscal-year convention: Nvidia's fiscal year ends in late January and is labeled one year ahead of the calendar, so fiscal 2027 ends January 31, 2027. Broadcom's fiscal year ends in early November.
The similarities are the easy part. Both companies are prime beneficiaries of the same capital expenditure wave, both convert revenue into cash at rates that look nothing like traditional semiconductor economics, both depend on TSMC for leading-edge manufacturing, and both are growing at rates that would be implausible at a fraction of their size. Neither is a marginal business.
The differences are where the investment case lives. Nvidia sells to everyone and earns software-like margins on hardware; Broadcom sells to six named customers and blends semiconductor economics with a genuine software annuity. Nvidia is concentrated in one platform and funded by $68 billion of net cash; Broadcom is spread across three engines and carries $45 billion of net debt from the VMware acquisition. Nvidia compounds by reinvesting in its own research and development; Broadcom compounds by acquiring infrastructure assets and running them harder. And on the two lines that matter most for what follows — the like-for-like earnings multiple and the growth embedded in it — the ranking is the reverse of the one the narrative implies.
Section 3
Comments
Nothing yet. Say the first thing.
Sign in to join the conversation.