
A 10-K runs a hundred pages or more, and most of it does not matter. Five sections carry almost all of the analytical value for someone assessing business quality. What follows is where to go, what to extract from each, what to skip without guilt, and the ninety-minute sequence that turns the whole thing into a repeatable process.
Section 1
The Most Valuable Document Almost Nobody Reads
Every public company in the United States publishes, once a year, a comprehensive legal description of itself: what it sells, to whom, how it competes, what could go wrong, and what it earned. That document is the 10-K. It contains audited financial statements, it is written under the threat of securities liability, it is filed with a federal regulator, and it is available free to anyone with an internet connection. It is the single most information-dense source an outside investor can obtain about a business. Almost nobody opens one.
What most investors read instead is a compression. The headline, the analyst note, the earnings recap, the screener row — each is a summary of the 10-K produced by someone else, using someone else’s judgment about what mattered and what could be dropped. Those judgments are often reasonable. They are also invisible. A reader who consumes only the compression has no way of knowing which facts were discarded, which qualifications were smoothed over, or which disclosure sat three paragraphs below the part that got quoted.
The reason this gap persists is not that investors are lazy, and it is worth stating the case fairly. A 10-K is long, legally worded, and structurally repetitive. Large parts of it genuinely are boilerplate, recycled year to year and drafted to satisfy counsel rather than to inform an investor. Someone who opens one expecting narrative clarity encounters instead a hundred-plus pages of defined terms and cross-references, loses momentum somewhere in the risk factors, and concludes that the document is impenetrable. That reaction is understandable. It is also precisely why the information advantage survives.
The resolution is not to read the whole thing. Most of a 10-K does not repay the time spent on it, and treating every page as equally deserving is the mistake that ends most attempts. Five sections carry almost all of the analytical value for someone assessing business quality, and a disciplined reader can extract what matters from a filing in roughly ninety minutes. The skill being described here is not endurance. It is knowing where to go, what to look for, and what to skip without guilt.
The 10-K is where a business is required to describe itself accurately. Everything downstream of it is someone else’s compression of that description.
This piece explains how to read the source.
Section 2
What a 10-K Is, and How It Is Built
Start with what the document is. The 10-K is the comprehensive annual report that U.S. public companies file with the Securities and Exchange Commission. It is a regulatory filing rather than a marketing document, and that distinction is the entire source of its value: the content is prescribed by rule, the financial statements are audited, and the company is legally accountable for what it says. It should not be confused with the glossy “annual report to shareholders,” a separate obligation under the proxy rules that typically wraps the same financial statements in photography and a shareholder letter. Many companies now satisfy that requirement with a “10-K wrap” — the filing itself, bound behind a few designed pages. Where a genuine shareholder letter exists it is worth reading separately, because it is one of the few places management writes without a template and therefore one of the few places candor is observable.
Next, where to find it. Filings are free and public through EDGAR, the SEC’s electronic filing database, and are also posted in the investor relations section of most company websites. EDGAR’s full-text search covers filings submitted since 2001 and searches the entire document including exhibits, supporting keyword, ticker, company name, and boolean queries. Two consequences matter practically. Electronic filing became universal in 1996, so a company’s filing history can be pulled year by year across the whole modern era, which makes year-over-year comparison trivial to set up — an underused technique this piece returns to repeatedly. And a specific phrase can be searched across an entire industry at once, which is how a company’s disclosure language gets compared against its competitors’.
Then the structure. A 10-K is organized into numbered items grouped into four parts, and the numbering is standardized, which means the navigational skill transfers from one company to the next. Part I covers the business, risk factors, cybersecurity, properties, and legal proceedings. Part II carries the market for the company’s stock, Management’s Discussion and Analysis — universally abbreviated MD&A — the financial statements, and the controls disclosures. Part III covers governance and compensation. Part IV holds the exhibit list. The map below shows the full structure with the five sections that carry the analytical value marked in gold.
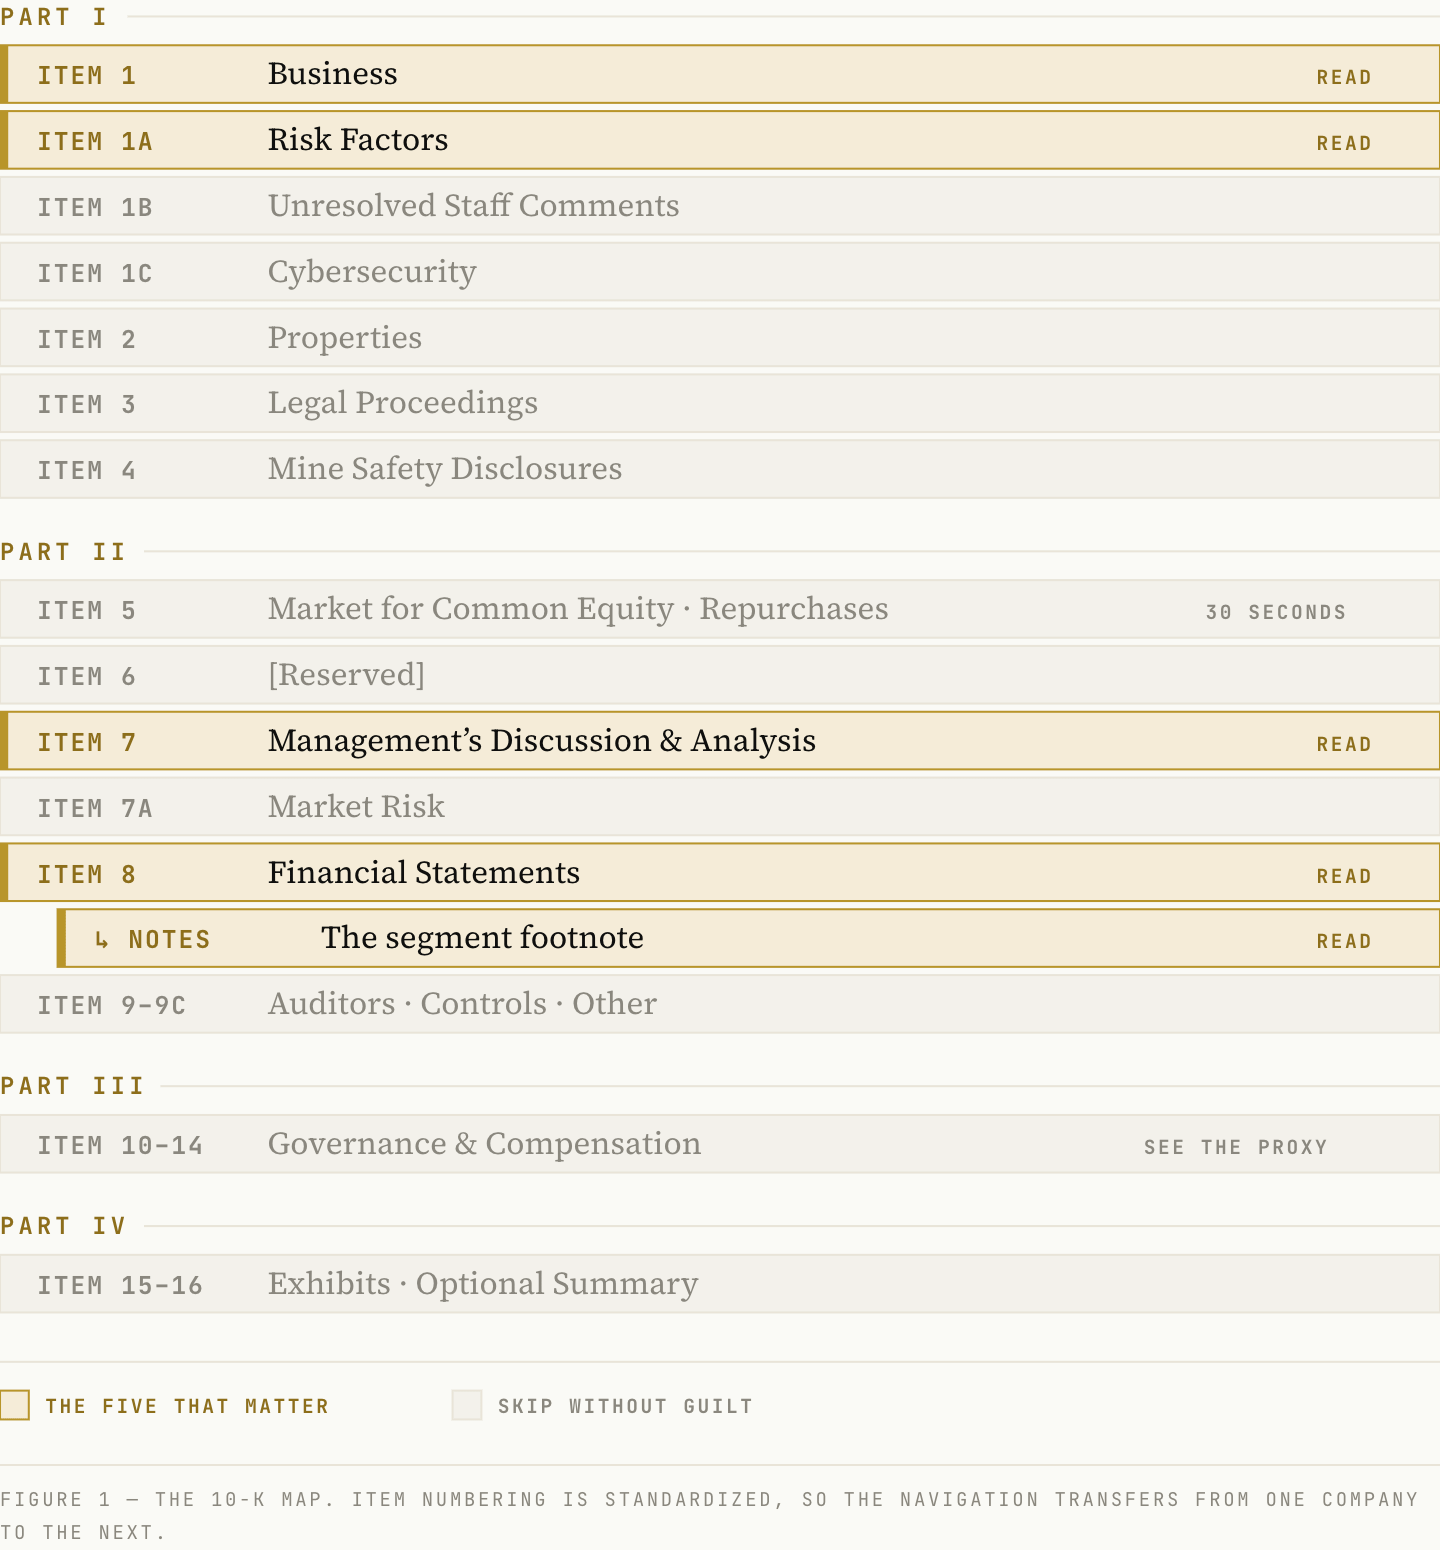
One structural quirk is worth knowing before it wastes anyone’s time. Part III — the governance and executive compensation detail — is usually not printed in the 10-K at all. Most companies incorporate it by reference to the proxy statement, the separate document filed ahead of the annual shareholder meeting that contains the compensation tables, the board biographies, and the ownership detail. A reader looking for how management is paid should go directly to the proxy. It is filed within 120 days of fiscal year end when Part III relies on it, and for anyone assessing whether incentives are aligned with owners, it is the more important of the two documents.
Finally, the timing. The deadline depends on company size, measured by public float — the market value of shares held by outsiders rather than insiders.
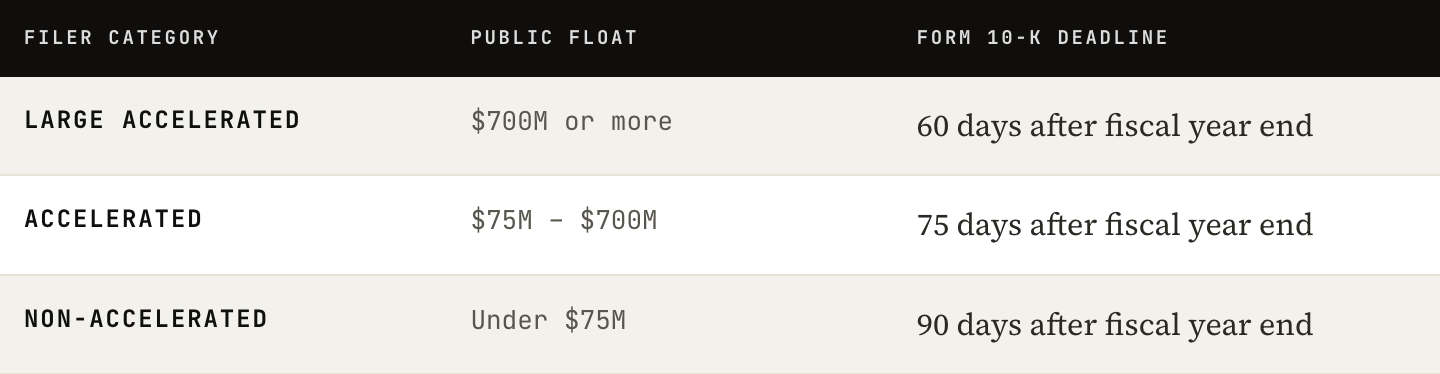
A smaller reporting company with annual revenue under $100M is excluded from the accelerated category and falls back to 90 days. A company that cannot meet its date may file Form 12b-25 for a fifteen-day extension — the fact of that filing is itself informative. Proxy statement due within 120 days of fiscal year end where Part III is incorporated by reference.
The practical consequence is that the 10-K arrives weeks after the fourth-quarter earnings release, by which point the market has already reacted to the headline numbers. It is rarely a market-moving event. That is part of why it goes unread, and part of why it stays useful.
Section 3
The Five Sections That Carry the Analytical Value
One: Item 1
Business — what the company actually does, in its own words
This is the required description of the business: segments, products, customers, competition, regulatory environment, and, since the 2020 amendments to the disclosure rules, human capital resources where material. It is the raw material for every quality assessment — what gets sold, to whom, on what terms, and against whom. What to extract: the revenue model stated plainly, the segment structure, the named competitors, and any disclosure of customer concentration, which is required separately in the financial statement notes for any customer representing ten percent or more of revenues. What a casual reader misses: this section is rewritten more often than investors assume. Reading it alongside last year’s version reveals how management’s framing of its own business is shifting — a new segment definition, a competitor named for the first time, a product line quietly dropped from the description. Note also what this section is not: it is the input to a moat assessment, not a substitute for one, because a company describing its own differentiation is not a disinterested witness.
Two: Item 1A
Risk Factors — what the company is required to worry about
A list of material risks, drafted conservatively by counsel and calibrated to limit liability rather than to inform. Much of it is boilerplate appearing in every filing in the industry, and where the section runs past fifteen pages the company must supply a summary — a fair indication of how bloated this disclosure has become. A reader who treats every listed risk as equally meaningful will learn nothing at all. What to extract: risks that are specific, quantified, or newly added. What a casual reader misses: the value here is almost entirely in the year-over-year difference. Pull last year’s filing alongside this year’s and compare what was added, expanded, and removed. A newly added risk factor is management stating, under legal obligation, that something has changed — frequently months before that change becomes visible in the numbers.
Three: Item 7
MD&A — the business explained by the people running it
Management’s narrative account of the year: what drove revenue, what moved margins, what happened to cash generation, and what the company expects to matter going forward. This is the most readable section in the filing and often the most useful, because it is where the numbers are translated into causes. What to extract: the stated drivers of revenue change, the explanation of margin movement, and the discussion of liquidity and capital resources, which covers how the business is funded and what obligations are coming due. What a casual reader misses: MD&A is typically where price-versus-volume disclosure lives — the most direct evidence of pricing power available anywhere in a filing — and where management’s language about discounting, competitive intensity, and renewal behavior is least guarded.
Four: Item 8
The financial statements — the numbers themselves
The audited balance sheet, income statement, and cash flow statement, presented with comparative prior years. What to extract: the multi-year trend rather than the single year, because one year of anything is an anecdote. The cash flow statement is the most important of the three for a quality investor. It is the hardest of the statements to manage, and it holds the inputs that matter — operating cash flow, capital expenditure, stock-based compensation, and the working capital movements that reconcile earnings to cash. What a casual reader misses: the simple relationship between the top two statements. The income statement gets the attention and the cash flow statement holds the truth. A business whose net income grows while operating cash flow stagnates is disclosing something the headline does not say. Converting these inputs into owner earnings is a separate discipline, and it is where the analysis properly begins.
Five: Within the Notes
The segment footnote — where the mix is revealed
Buried in the notes to the financial statements, the segment disclosure breaks revenue and profitability down by reportable segment — the distinct business lines a company must report separately, drawn the way management actually runs the company — and usually by geography. What to extract: which parts are growing, which are actually profitable, and how the mix is moving. What a casual reader misses: consolidated results routinely disguise a business in which one excellent segment subsidizes a deteriorating one, or in which nearly all of the profit comes from a modest fraction of the revenue. This disclosure also became materially more useful recently. Under an accounting standard effective for fiscal years beginning after December 15, 2023 — calendar 2024 for most companies — filers must now disclose significant segment expenses regularly reported to the chief operating decision maker — the executive who allocates resources among the segments, usually the chief executive — and must identify that person’s title and position. Segment profitability is therefore more decomposable than it was two years ago, and prior periods were required to be recast for comparison.
Skip Without Guilt
Properties is a real estate list. Legal proceedings is boilerplate in most filings and material in very few, and the material ones announce themselves. The market-for-securities mechanics, the exhibit index, and the signature pages change no investment view — with one exception worth thirty seconds: Item 5 contains the fourth-quarter share repurchase table, broken out by month, which shows what the company paid for its own stock and when. Governance and compensation detail generally sits in the proxy statement, which is worth reading carefully. It is simply a different document.
Section 4
Where the Real Information Lives
Nearly every treatment of this subject stops at the primary financial statements. That is where the analysis should be starting. Footnotes — the numbered notes that follow the statements and are formally part of them — are where the summarizing choices get explained: the accounting policies, the assumptions, the disaggregation, and the obligations that never appear as a line item. A reader who studies the income statement and skips the notes has read the conclusion without the reasoning.
Four families of footnote are worth going to directly on every filing.
Note One
Revenue recognition and disaggregation
How the company recognizes revenue, and the breakdown of revenue by type, timing, geography, or category. This is where recurring revenue is separated from transactional, subscription from one-time, product from service, and license from support. That distinction matters enormously to business quality and is almost always invisible on the face of the income statement, where it appears as a single line.
Note Two
Debt, leases, and obligations
The maturity schedule, interest terms, covenants, lease commitments, and contractual obligations that do not sit on the balance sheet as debt. What matters is not the headline leverage figure but the shape of it: when it comes due, at what cost, and under what conditions. A manageable debt load with a wall of near-term maturities is a materially different risk from the same figure spread evenly across a decade.
Note Three
Stock-based compensation
The magnitude, the structure, and the dilution. This is the expense most reliably excluded from the adjusted figures management prefers to present, and it is a real cost borne by owners. The note discloses how large it is relative to revenue and how much it dilutes existing holders — two numbers that frequently change the complexion of a company that looks cheap on adjusted earnings.
Note Four
Accounting policies, estimates, and changes to them
The judgments management makes about useful lives, capitalization, reserves, impairment, and revenue timing. What to watch for specifically is a change in an estimate or policy that happens to flatter the current period. Such changes must be disclosed, and they are — quietly, in language drafted not to attract attention. A lengthened depreciation schedule and an earnings beat in the same year are two facts that belong next to each other.
The Instruction
Read the segment note, the revenue note, the debt note, and the stock compensation note on every filing. Read the accounting policy note whenever the reported numbers look better than the business feels. The notes run long, but those four can be worked through in about twenty minutes, and they routinely change the picture.
Section 5
How to Work Through a 10-K in Ninety Minutes
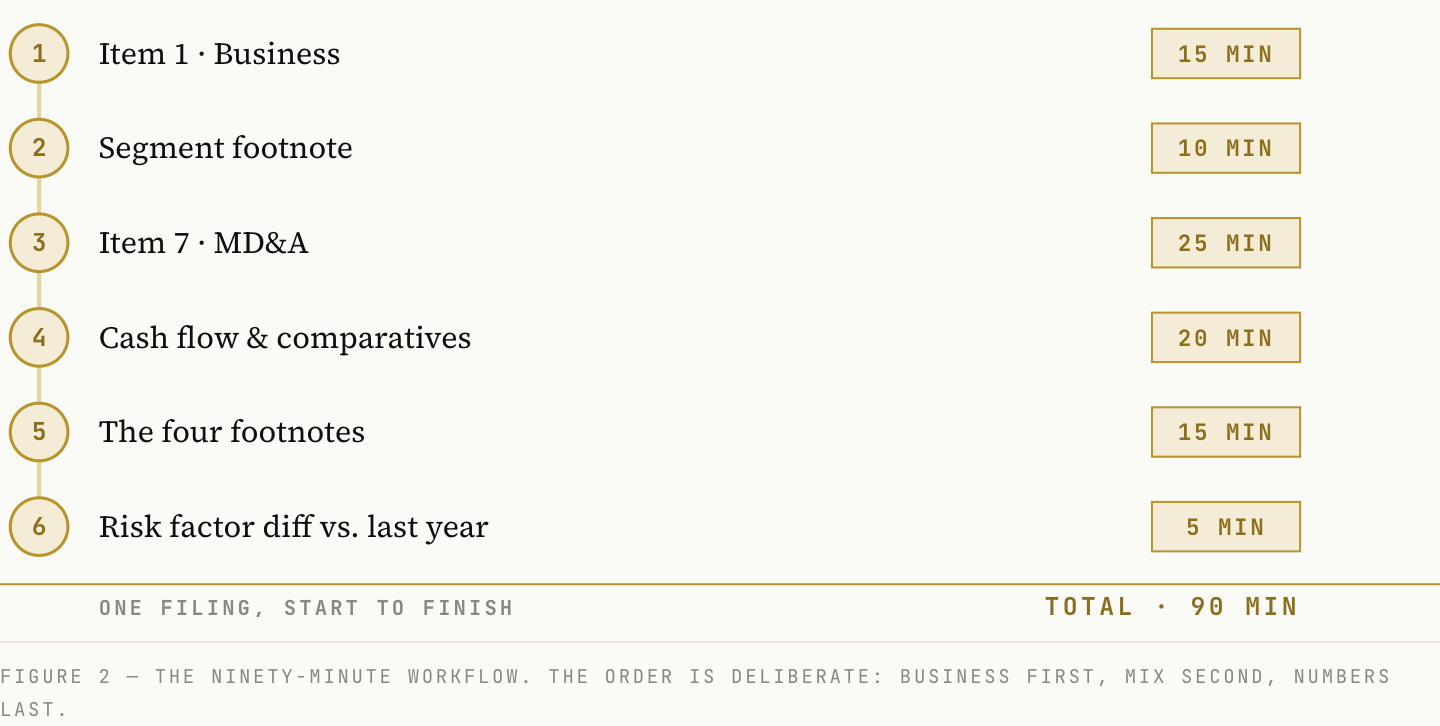
The sequence below is itself the value. It front-loads the questions that determine whether the rest of the document is worth reading, and it deliberately delays the financial statements until the shape of the business is understood.
Read Item 1, Business, properly: Understand what the company sells, to whom, and how it makes money before looking at a single number. An investor who opens the financials first will interpret them through assumptions rather than facts, and those assumptions are very difficult to dislodge once formed.
Go to the segment footnote next, not the income statement: This establishes where the revenue is, where the profit is, and which direction the mix is moving. It frames everything in the financial statements that follows, and it prevents the common error of forming a view about a business that is really a view about one of its four segments.
Read MD&A: Management explaining the year in its own words. Note the stated drivers of revenue and margin change, and note the specific language used about pricing, discounting, and competition.
Work through the cash flow statement and the comparative financials: Read the trend, not the year. Reconcile net income to operating cash flow and note any persistent gap between them, in either direction.
Read the four footnotes that matter: Revenue disaggregation, debt and obligations, stock-based compensation, and any change in accounting policy or estimate.
Diff the risk factors against last year’s filing: Not a full read — a comparison. What was added, what was expanded, what quietly disappeared.
The Habit That Multiplies Everything Above
Read filings in pairs. Open this year’s 10-K alongside last year’s and compare the business description, the risk factors, and the segment footnote directly. Almost everything that matters in a filing is visible as a change, and a change is invisible when only one year is in front of you. This single practice separates investors who read filings from investors who learn from them.
Section 6
What to Look For, and the Language That Should Slow You Down
Markers of Quality
What a good filing looks like
Segment disclosure that is clear and consistently defined from year to year. Revenue that is substantially recurring, disclosed plainly in the revenue note rather than asserted in a press release. Operating cash flow that tracks or exceeds net income across multiple years. Capital expenditure that is modest relative to operating cash flow, which is the arithmetic signature of a business that does not have to buy its own growth. Plain, specific language in MD&A about what drove results, including what went wrong. And where a shareholder letter exists, one that discusses mistakes with the same precision as successes.
Slow Down Here
Language and disclosure that should stop a reader
Segment definitions that change without clear explanation, which is the standard method for obscuring a deteriorating unit. Growing reliance on adjusted or non-GAAP figures — results presented outside standard accounting rules — accompanied by an expanding list of add-backs. Net income growing while operating cash flow stagnates. Receivables or inventory growing materially faster than revenue. A newly added risk factor written with unusual specificity, which is counsel signaling that a general disclaimer no longer covers the situation. Vague attribution of results to “market conditions” without naming a mechanism. And a change in an accounting estimate that happens to improve the current period. None of these is proof of anything standing alone. Each is a reason to keep reading rather than a verdict.
The interpretive discipline underneath all of this is worth stating directly. A filing is written by people who know they are legally accountable for its contents and who would nonetheless prefer the reader come away optimistic. Both things are true simultaneously, and they operate on different parts of the document. The disclosures are reliable. The emphasis is not.
Read the disclosures for facts and the framing for tells.
Section 7
What a 10-K Can and Cannot Tell You
Consider first what the document provides. The 10-K is the most reliable description of a business available to an outside investor, and it is the raw material for every framework worth applying. The business description feeds the moat assessment. The cash flow statement and the footnotes feed the owner earnings calculation. The segment note reveals the mix. MD&A supplies the evidence of pricing power. Nothing downstream of the filing — no screener, no summary, no analyst note — contains information the filing does not, and all of it carries someone else’s judgment about what deserved to survive the edit.
Consider next what it cannot do. A 10-K is backward-looking. It describes the year that ended, not the decade ahead. It cannot establish whether a moat will hold, whether the reinvestment runway extends another ten years, or whether management will allocate capital well under conditions it has not yet faced — and those are the questions that determine long-run returns. Nor does a filing say anything at all about price. It describes a business; what that business is worth relative to what the market is charging for it is answered somewhere else entirely.
The synthesis is uncomfortable and worth sitting with. Reading filings is not an edge because the documents are secret — they are free, universal, and indexed by a search engine the federal government maintains. It is an edge because reading them carefully is unglamorous, slow, and almost entirely unrewarded in the short run. Ninety minutes spent inside a 10-K produces no immediate feedback, no position, and frequently no action.
The information asymmetry in public markets is rarely about access. It is about attention.
The frameworks published here — return on invested capital, owner earnings, moats, pricing power, intrinsic value — all require inputs, and the inputs come from the filings. Learning where they live is the prerequisite to everything else. Every Quality Equities deep-dive begins exactly here: with the 10-K, the footnotes, and the year-over-year comparison — before a single valuation assumption is made.
Quality Equities publishes independent research for informational purposes only. Nothing published constitutes investment advice or a recommendation to buy or sell any security. The author may hold positions in securities discussed.
No posts
Comments
Nothing yet. Say the first thing.
Sign in to join the conversation.