
The Problem
Every quarter, the same thing happens. A company publishes an earnings report showing record revenue and rising profit, the stock falls nine percent by lunchtime, and a large number of people conclude the market has lost its mind. The market is not irrational. It had already decided, before the report existed, roughly what the company was going to earn, and the report is graded against that decision.
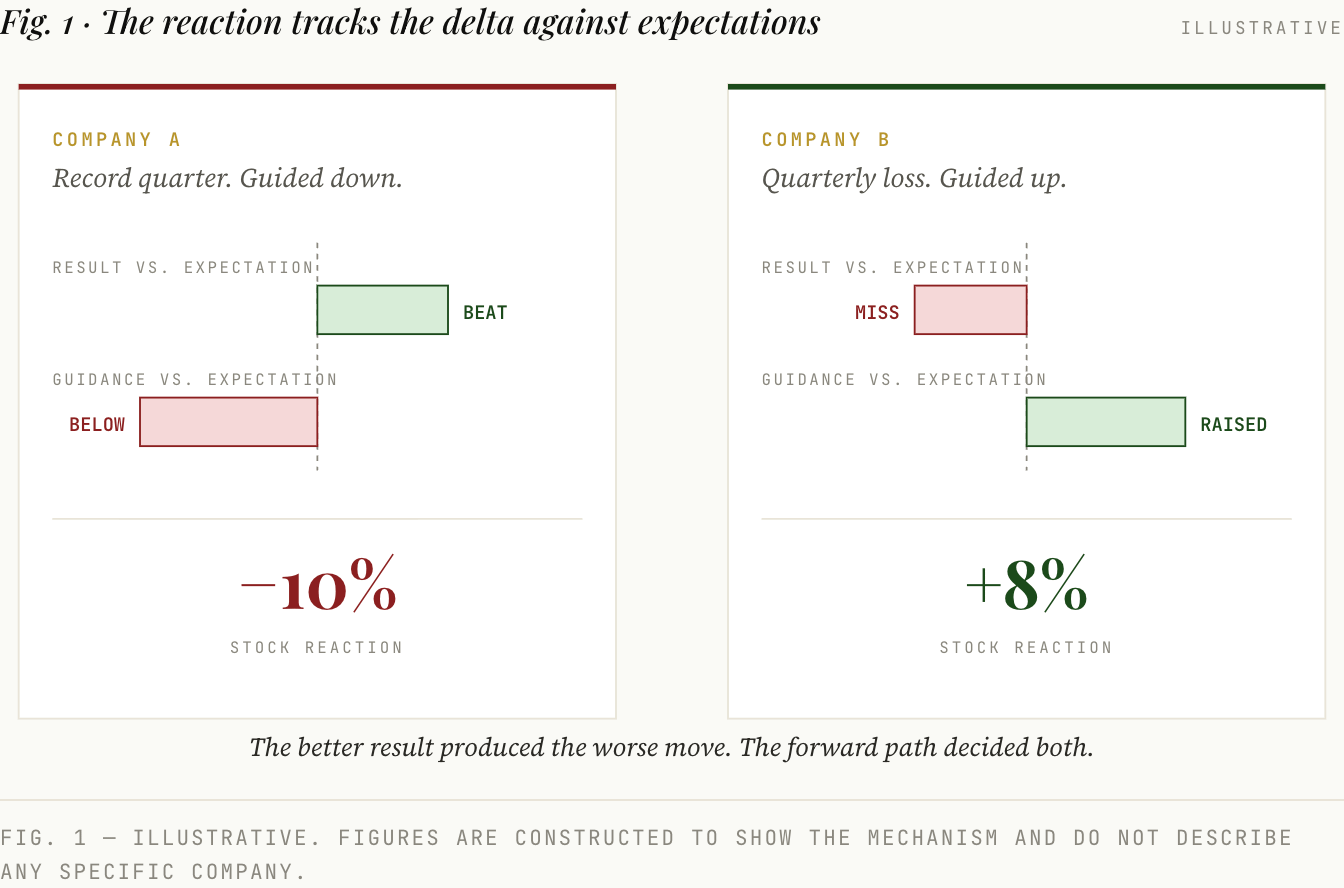
The mechanism is simple once stated. A stock price contains a forecast. When results arrive, the market compares them to the forecast already embedded in the price and moves by the difference. Results that are merely good, against a price that assumed excellent, register as a disappointment. The reported figure carries almost no meaning on its own; the meaning is in the gap between the figure and the expectation it lands against.
Two cases make the asymmetry concrete. A company posts the best quarter in its history and falls ten percent, because it told investors that the next quarter would come in below what analysts had modeled. Another posts a loss and rallies, because the loss was smaller than feared and management raised its full-year outlook. Both moves look absurd to someone reading the headline. Both are obvious to someone reading the quarter as an expectations game.
Alphabet reported its second quarter on July 22, 2026, and the headline was spectacular. Revenue rose 24% to $119.8 billion, operating income rose 30%, and diluted earnings per share printed at $9.11 against $2.31 a year earlier. Almost all of that increase was one line in other income. A footnote discloses that gains on equity securities added $6.26 of the $9.11, which puts the operating figure nearer $2.85 and its growth rate nearer 23%, tracking revenue. Management then raised full-year capital expenditure guidance to $195-205 billion from $180-190 billion, and free cash flow for the quarter came in at negative $5.9 billion as $44.9 billion of capital spending outran $39.1 billion of operating cash flow. The stock fell roughly 7% the following session. The quarter was excellent, the forward path got more expensive, and the market priced the second one.
The stakes extend past the day of the print. Reading an earnings report well has little to do with predicting the one-day move, which is a re-pricing of expectations and mostly forgotten inside a week. The work is extracting what changed in the business and in its trajectory. Some quarters carry real information about durability. Most carry none, and the discipline is telling those apart.
An earnings report has three parts: the press release, the conference call, and the guidance. Each is read differently. What follows covers all three, in the order an analyst takes them, and the whole exercise runs under an hour once the habit is built. For the annual filing that sits behind the quarterly noise, the companion to this piece covers how to read a 10-K.
The Expectations Game
Start with what a share price is. It is the present value of everything the market expects a business to produce, which means every price contains an implicit forecast of revenue, margin, and growth. Consensus, the published average of sell-side analysts’ estimates for the coming quarter and year, is the visible version of that forecast. The expectation actually priced into the stock frequently sits somewhere else. For a beloved growth name it sits above consensus; for an out-of-favor one it sits below, and that difference is what the market means by the whisper number: the unpublished bar the stock is really trading against.
This is the reverse DCF applied to ninety days. The reverse DCF takes the current price and solves backward for the growth rate the market must be assuming over a decade. The earnings reaction asks the same question at quarterly resolution: is this result, together with this updated outlook, tracking above or below the path the price already assumes? A high-expectations stock has to clear a high bar every quarter to stand still. A low-expectations stock can rise on news that is merely adequate. The method itself is covered in the reverse DCF piece.
Two questions follow, and their order matters. The first is whether the results and the guidance came in above or below what the market expected, and by how much; that question explains the move. The second is whether anything in the report changed the multi-year thesis or only the next-quarter number. Most quarters do the latter. Separating them is the entire skill.
For an investor measuring in decades, a single-quarter beat or miss is noise and the one-day move is close to pure noise. The question worth asking is whether the quarter produced evidence about durability: pricing power holding or fading, the moat widening or narrowing, capital being deployed by people worth trusting with it. The expectations game explains why the stock moved. The business signal determines whether the move is an opportunity. Both are worth reading. Only the second compounds.
The Release
The quarterly earnings release is a short document with a specific legal status. Companies furnish it to the SEC under Item 2.02 of Form 8-K, and furnished material carries a lighter liability standard than filed material. The audited, legally filed account of the quarter arrives later, in the 10-Q. What crosses the wire after the closing bell is management’s own presentation of its results, written by the investor relations team and approved by the chief financial officer. Read it in that light.
Read it in a fixed order, with the prior quarter’s release open alongside. First, the headline metrics against expectations: revenue, earnings per share, and the one operating metric the business lives or dies by. Subscribers, same-store sales, bookings, backlog, net revenue retention, whichever applies. Compare each to consensus. That comparison sets the initial reaction and takes about ninety seconds.
Second, the guidance, immediately. Guidance is management’s own forecast of future results, usually covering the next quarter and the full year, and in most releases it carries more weight than the quarter being reported. It tends to sit below the results tables and above the reconciliations, which is why so many readers never reach it. Find it, compare it to what the market expected, and note whether the full-year range moved up, moved down, or held. How to interpret it comes later in this piece; the reason to read it early is that it usually drives the reaction.
Third, the segment and driver detail. Which parts of the business grew, which shrank, and what does management say caused the change? Revenue quality lives here. Growth from price behaves differently over time from growth from volume, and a one-time boost behaves differently from a durable source. Pricing commentary in this part of the release is the most direct quarterly evidence of pricing power available to an outside investor.
Fourth, the non-GAAP reconciliation. Non-GAAP figures are management’s adjusted numbers, stripped of items it considers unrepresentative of underlying performance; SEC rules require any such measure to be reconciled to the most directly comparable GAAP figure, which is why the table exists at all. Find it and read what was added back. Stock-based compensation is the largest and most consequential add-back at most technology companies, and it is a real cost paid in shares. Watch whether the list of adjustments grows from quarter to quarter. A widening gap between GAAP and adjusted results is a signal in itself, and the case for reading through it is made in the owner earnings piece.
What to skip is a shorter list. The CEO’s quote is marketing. The boilerplate description of the business is unchanged from last quarter. The safe-harbor language is legal furniture. Read the numbers, the guidance, the drivers, and the reconciliation; the rest of the release is packaging.
One habit multiplies the value of all of it. Keep the prior quarter’s release open in a second window and compare the metrics table and the guidance line by line. Wording that shifted, a metric that changed position, a range that quietly narrowed: the differences carry more information than either document alone. The deeper version of this technique, applied across annual filings, belongs to the 10-K piece.
The Call
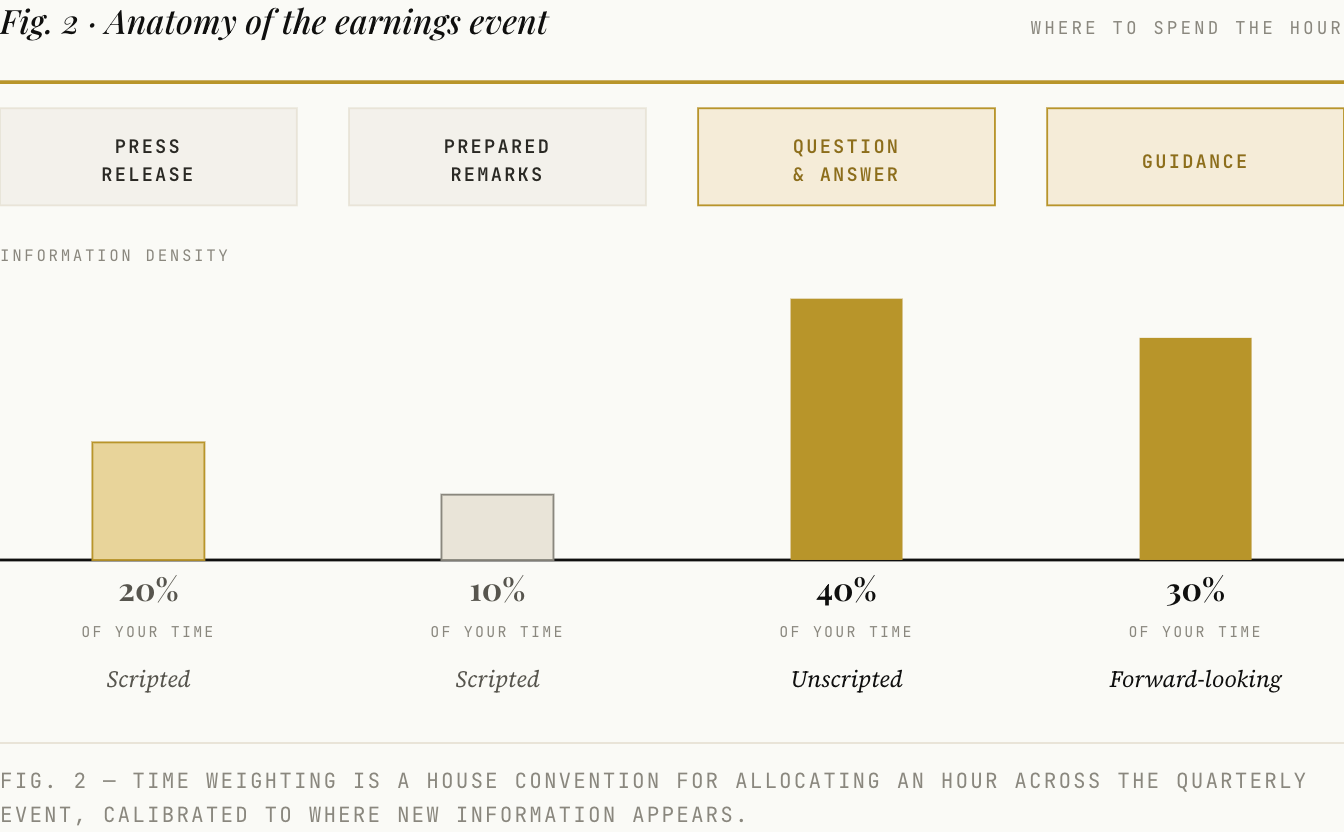
The call usually begins shortly after the release crosses the wire. It has two halves. The first is prepared remarks: the chief executive and chief financial officer reading a script that was written, reviewed, and lawyered days in advance, walking through the results and the outlook in the sequence management prefers. The second is question and answer, in which analysts covering the company ask what they want, in the order they want, with follow-ups. Both halves are useful. Only one of them is unrehearsed.
There is a regulatory reason the Q&A contains information at all. Under Regulation FD, a company cannot selectively disclose material information to favored analysts, which is why calls are publicly webcast and why anything material said under questioning enters the public record. The SEC’s guidance on the point is explicit: previously undisclosed material information provided in a question-and-answer session has to be made available to everyone. Management therefore arrives at the Q&A knowing that every specific number it volunteers becomes permanent and universal. That constraint is what makes the section revealing.
In the prepared remarks, three things repay attention. The stated drivers of the quarter, which give management’s causal story and can be checked against the numbers it just published. The guidance detail, including any change in the assumptions sitting underneath the guide. And the emphasis: what management leads with, what it repeats, and what has quietly dropped out of the script. A metric that opened the remarks last quarter and goes unmentioned this quarter is a tell. So is a new metric introduced to redirect attention.
The Q&A is where an outside reader gets closest to the truth of the quarter. The analysts asking cover the company full time and have models to defend, and their questions are a free map of where informed concern currently sits. Listen for four things. Whether a specific number, asked for directly, is provided or deflected. Whether management answers crisply or answers at length without answering. Whether the same worry is raised by three different analysts, which turns an idiosyncratic question into a real issue. And the difference in tone between the confident script and the same executives under a second follow-up. Evasion has a sound, and this is where it becomes audible.
On Arista's first-quarter 2026 call in May, Ben Reitzes of Melius Research asked the chief financial officer to size what supply constraints had cost the quarter and the guide, and offered $100 million or $200 million to make confirming it easy. The reply addressed when the constraint would bite, pointing at the second half and the following year. The magnitude never came. The call's one-question limit meant no follow-up. Most of the answer sat elsewhere in the same Q&A: Jayshree Ullal had already told another analyst that the 27.7% growth guide reflected how much Arista could ship, that the figure had walked up from 20% through 25%, and that the pace of supplier decommits, meaning orders a supplier had agreed to and then cut back, “does not feel good.”
Reading the transcript is faster than listening, and it can be searched. Company investor relations pages are the primary source and generally post the webcast, and often a transcript, within a day or so; several services publish same-day transcripts for large-cap companies without charge, with historical archives typically behind a subscription. Search first, then read around the hits. The terms worth searching are the ones the thesis depends on: price, margin, competition, guidance, and the company’s key operating metric. For a long-term holder, the Q&A section of a transcript is often the highest-value ten minutes in the entire quarterly event.
The prepared remarks tell a reader what management wants concluded. The Q&A tells a reader what management is worried will be noticed. Read both; weight the second.
The Guidance
Guidance is management’s forecast of its own future results. Most companies guide to the next quarter and the current full year, and some add multi-year targets at an investor day. Because the value of a business is the present value of the cash it will produce over its remaining life, a change in the forward path is worth more than a change in the quarter that just closed. That is the entire explanation for the beat-and-fall: the company won the quarter and lost the future, and the market marked the future down.
The headline number matters less than the change. Did the company raise, hold, or lower its full-year range, and how does the new range compare to the bar the market had already set? A raise that falls short of the whispered figure lands as a disappointment. A hold, in a quarter when a raise was expected, lands as a negative. Guidance is graded exactly like the quarter: against the embedded bar.
Guidance also carries information about the people issuing it. Management sets a bar it expects to clear, so the pattern across many quarters says something about both confidence and candor. A team that guides conservatively and beats consistently is running a different playbook from one that guides aggressively and misses, and over five years that record becomes a genuine input to the management assessment. Watch for a quietly retired target. Watch for a shift from specific numeric guidance to qualitative framing, which usually means visibility has declined. And watch the assumptions behind the guide, which can deteriorate while the headline number holds.
For an investor measuring in decades, one guidance revision is rarely thesis-changing. Demand pulled forward or pushed out is timing. What deserves attention is a change in the structural outlook: a durable step-down in the growth rate, a margin trajectory that has broken, a reinvestment runway that has shortened. Those revisions are rare. They are also the only ones worth acting on.
Alphabet’s July 2026 revision is the test case for that distinction. The change was to capital expenditure alone: $195-205 billion for the full year, raised from $180-190 billion, with management attributing the increase to accelerated delivery of capacity and saying free cash flow would remain under pressure. Revenue and margin guidance were untouched. Whether that is timing or structure is the entire question.
The thesis this revision moved was the hyperscaler one. The capex work treats the July raise as confirming evidence for a deferral already visible on the balance sheet: across the big four, trailing capital expenditure of roughly $434 billion against about $149 billion of recognized depreciation. What the revision leaves unsettled is the part that decides whether to own the shares, because Google Cloud grew 82% to $24.8 billion in the same quarter with backlog up $50 billion, and a cost curve rising into a faster revenue curve is a different proposition from one rising into a flat one.
The Tells
Numbers describe what already happened. Language describes what management expects to happen, and it changes first. Five patterns recur across the quarterly event, and each is visible to anyone reading the release and the transcript with attention.
A metric that disappears. Companies stop reporting numbers that stop flattering them. Subscriber counts, unit volumes, segment breakouts, and same-store figures all vanish this way, usually framed as a simplification of reporting and disclosed in a footnote or not at all. A metric that goes missing in the same quarter that growth decelerates is one of the clearest tells in the entire event.
The vocabulary of deceleration. Watch the adjectives. Growth becomes resilience; specific figures become momentum and healthy; a named driver becomes market conditions. When management stops quantifying and starts describing, visibility is usually deteriorating. Precise language is cheap for a team that has the numbers and expensive for a team that does not.
The expanding adjustment list. The gap between GAAP and adjusted earnings is a running measure of how hard management is working to present a flattering figure. Watch its direction over eight quarters. New add-backs appearing in the reconciliation deserve a specific look, and a restructuring charge that recurs every quarter has stopped being a restructuring charge. The owner earnings piece sets out why the cash figure is the one to trust.
The working-capital and cash divergence. Earnings can be managed for several quarters. Cash is harder. When reported profit grows while operating cash flow stalls, or when receivables and inventory grow faster than revenue, earnings quality is deteriorating underneath an improving headline. The release includes summary cash flow figures for exactly this comparison, and the detail arrives with the 10-Q. For a cyclical business, this is also where peak earnings begin to show strain, a trap examined at length in the reverse DCF piece.
The buyback and the insider signal. Capital allocation corroborates or contradicts what management says. A team guiding optimistically while slowing its repurchases is worth a second look, and so is a team accelerating buybacks into a decelerating business. Insider transactions disclosed around the period add another data point, though they are noisy and often driven by pre-arranged plans. Treat this tell as supporting evidence.
Netflix is the instructive case, because it moved from strength. In April 2024 the company said that beginning with the first quarter of 2025 it would stop reporting quarterly membership numbers and average revenue per member, the two figures the market had used to judge it for a decade. Quarterly membership guidance had already been withdrawn in 2023. The stated reason was that revenue, operating margin, and engagement were the better measures, and the quarter carrying the announcement was among the strongest in the company’s history. The stock fell anyway. Retiring a metric while it still flatters is the sophisticated version of this tell, and the market discounts it the same way, because what gets removed is the ability to check.
None of these is proof. A single soft signal in one quarter is noise, and reading tells in isolation produces a portfolio of paranoid sells. The value is in the pattern and the change: a tell that appears alongside decelerating numbers, or three tells arriving in the same quarter, is the event warning ahead of the trajectory. Read the numbers for what happened. Read the language for what management expects to happen next.
The Discipline
Read properly, the quarterly event is a scheduled audit of the thesis. Four times a year, a business has to describe itself in public, take questions from people paid to find the weak spot, and commit to a forecast it will be graded on ninety days later. That is an unusual amount of accountability. It is also free. What comes out of it, for a patient owner, is evidence on the things that determine long-run returns: whether pricing power is holding, whether the moat is widening or narrowing, whether capital is being allocated by people who tell the truth when the news is bad.
The limits are real. An earnings report describes a quarter and says nothing about what a business is worth, so it can never on its own justify a purchase. It is backward-looking on results and a single revision forward on guidance. And its most visible output, the one-day stock move, is the least informative part of the whole event: a re-pricing of the prior bar, dressed up as a verdict on the business. Price is settled elsewhere, such as in the intrinsic value and reverse DCF work.
Most investors misread earnings because they read for the result and react to the move. The value sits in the trajectory and the tells. The quarter is noise; the trajectory is signal. The prepared remarks are marketing; the Q&A is information. The reported number is backward; the guidance is forward. The headline is the result; the edge is the delta against expectations. An investor who learns to read for the second item in each of those pairs is reading an earnings report the way an analyst does, and will conclude, most quarters, that nothing has happened to a thesis measured in years.
An earnings report is not a scoreboard. It is a hearing, held four times a year, and the informative part is the cross-examination.
The durability of a business is tested in public, one quarter at a time. Whether pricing power is holding, whether the moat is intact, whether management is honest: the quarterly event is where the evidence arrives. That is the whole use of it. The frameworks published here are how to judge that evidence; this is how to find it in real time. Every Quality Equities earnings reaction reads the event exactly this way, against expectations, for the trajectory, and for the tells.
Quality Equities publishes independent research for informational purposes only. Nothing published constitutes investment advice or a recommendation to buy or sell any security. The author may hold positions in securities discussed.
No posts
Comments
Nothing yet. Say the first thing.
Sign in to join the conversation.