
Welcome to Part 2 in a series about the history of modern personality theory, with an emphasis on the Five Factor Model. In Part 1 we discussed:
The idea of traits as components of an individual’s personality, which as a whole tells us something about their tendency towards particular behaviors.
The origins of the so-called lexical hypothesis that lies at the heart of the modern Five Factor Model (FFM)
The basics of factor analysis (emphasis on basics!)
Raymond Cattell’s use of the lexical model and the application of factor analysis to its results
Cattell’s early results from his factor analysis.
Let’s pick up with…
Cattell was not the only psychologist who would be doing foundational work on personality in the 1940s. In fact, prior to the crystallization of the FFM, McCrae and John describe the lexical hypothesis as having played “a very small role.” Most personality research was rooted in what might be called the questionnaire tradition. By this I refer to the vast collection of questionnaires which were developed by researchers based on their own psychological theories of human personality.
Hans Jürgen Eysenck — the son of two German actors: Helga Molander (who has a Wikipedia page) and Eduard Anton Eysenck (who does not) — is worth mentioning as a foundational and extremely influential member of this tradition.
Eysenck moved to London in the 1930s to pursue his education in psychology, though eventually ended up staying due to his fierce hatred of the Nazi party, assuredly in no small part due to their internment of his maternal grandmother — his primary caretaker as a child and a Jewish convert to Catholicism — under the Nuremberg Laws. Because he was a German national, he was not permitted to join the British armed forces, and so was stationed as a research officer at Mill Hill Emergency Hospital — a former school that was converted into a military psychiatric hospital. There, Eysenck would perform the research that would produce his first paper Types of Personality: A Factorial Study of Seven Hundred Neurotics, in which his broad conceptual approach to personality is clear to observe.
Both Eysenck and Cattell were frustrated with psychology’s turn-your-intuitions-about-personality-into-yet-another-theory approach to personality research, but Eysenck felt that biological observations, not lexical ones, should serve as the foundation for personality research. Eysenck was confident that empirical observation was sufficient to pick out the general aspects of human behavior that were worth examination, and unlike many of his peers, was restrained enough to limit himself to two of perhaps the most easily observed and agreed upon domains of human personality: neuroticism and extraversion.1
By the 1960s Eysenck and Cattell were still titans of their field, but in the Greek sense of the word titan. Their progeny had mostly usurped them — though Eysenck to a lesser extent — and formed their own warring pantheon, each sect trying to assert the legitimacy and primacy of their chosen God of personality. The field of personality psychology was still arguing over which of the MMPI, CPI, EPI, 16PF, EPPS, TAT, Bernreuter Personality Inventory, Guilford-Zimmerman Temperament Survey, or their many other cousins, step-siblings, and assorted adoptees captured the correct essence of human personality.
The field seemed… unlikely to be resolving these disputes in the near future.
In 1961, a paper titled Recurrent Personality Factors Based on Trait Ratings was published by Ernest Tupes and Raymond Christal, two psychologists working for the US Air Force (USAF).
Fortunately, the USAF was willing to make radical, pragmatic statements like: “If people have measurable characteristics that predict how likely they are to make good decisions and be effective officers, it would be good for us to know what those characteristics are and how to measure them beforehand, instead of waiting for them to make bad choices that cause people to die before we do something about it.”
Tupes had already done research for the USAF in the 40s and 50s. He developed rating scales that contained 30 of Cattell’s original 35 bipolar traits to look for correlations between personality traits and measures of officer performance. His approach appeared to be relatively successful:
… [we found] peer ratings on personality traits to be predictive of later performance as second lieutenants in the case of the officer candidates, and to be related to concurrent but independent measures of officer performance in [senior Air Force officers].
These were fine results, but Tupes and Christal were interested to know what would come out of a factor analytic approach consistently applied across studies. There was an inkling that there might be some common ground — Tupes and Christal point out that correlations between personality traits and officer performance were quite similar in two of Tupes’ cohorts — but two studies could only be offered as tentative evidence. The scientific literature at the time offered no reason to be confident; it was filled with personality studies that attempted to “replicate” findings from other models, while using their own models, questions, assumptions, and so on rendering any comparisons meaningless. As the authors put it:
Attempts to compare the results of either the Fiske or Cattell analyses with those found by other investigators are generally futile, since it is rarely possible to determine from the studies whether all, some, or for that matter, any of the variables used are similar from one study to another. When what might be recurrent factors are found… differences in the nature of variables identifying these factors are such as to make impossible any but subjective judgments as to their possible similarities.
Their innovation was to apply their factor analytic method not just across Tupes’ cohorts, but to also include Cattell’s original two surveys of male and female college students, as well as the two cohorts from Fiske’s 1949 paper that attempted ‘replication’ of Cattell’s findings.
Though they do not explicitly say so, it is obvious that these cohorts were selected because of the similarities in the rating scales used. The scales are nearly identical in six of the cohorts; two are Cattell’s original surveys of male and female college students using his 35 bipolar traits, the other four are cohorts from the USAF that used surveys containing 30 of Cattell’s 35. The final two cohorts are from Fiske’s 1949 analysis, which used 22 traits that were designed to approximate Cattell’s 35, probably to answer to what degree moderate differences in rating scales would affect the results of their factor analysis.
It is also clear that these cohorts were selected due to the considerable variation between the participants, the better to put to bed any notion that their results could only be applied to well-educated, well-heeled psychology students. This time Tupes and Christal make this explicit:
Briefly, they differ in length of acquaintanceship from 3 days to a year or more; in kind of acquaintanceship from assessment programs to a military training course to a fraternity house situation; in type of subject from airmen with only a high-school education to male and female undergraduate students to first-year graduate students; and in type of rater from very naive persons to clinical psychologists or psychiatrists with years of experience in the evaluation of personality. It would appear that any factors common to all of these groups would have a wide range of generality both in terms of type of subject and type of rating situation.
Thus, the stage was set. Would a consistent methodological approach extract a consistent set of factors, or simply add to the confusion of messy, disparate results that came before it?
In the four Air Force samples and the two Fiske cohorts, five factors were recovered. In Cattell’s male sample, the same five factors were found, plus a sixth that appeared to describe intelligence. In Cattell’s female sample, six factors were found, the extra coming from the fifth factor (O) that split into two.
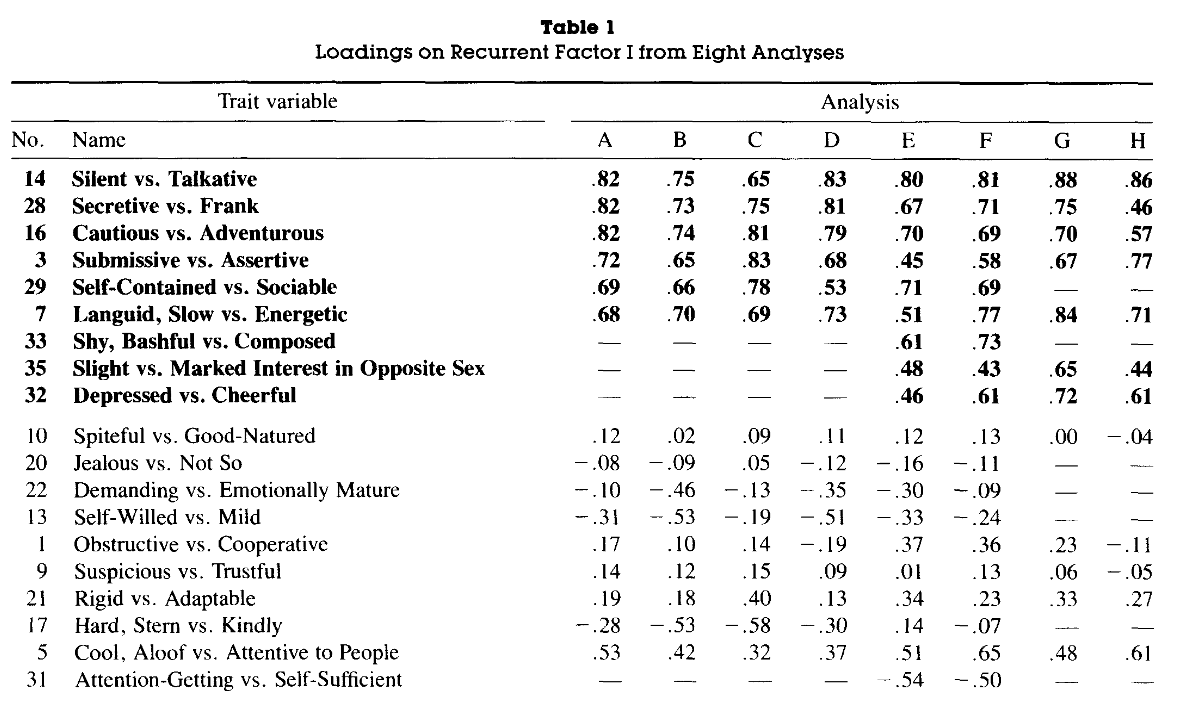
Tupes and Christal called these factors Surgency (E), Agreeableness (A), Dependability (C), Emotional Stability (N), and Culture (O).
These calculations were all done — more or less — by hand, but by the 1960s there were finally bespoke computer programs available to do factor analysis. Tupes and Christal only got access to the program after their initial analysis, and were only permitted to submit one cohort for analysis. The results of this (theoretically) unbiased analysis must’ve been quite gratifying:
It can be seen that the two solutions are for all practical purposes identical. In every instance the loadings for the defining variables are exactly the same or differ by only 0.1. [Only one] loading differs by more than .2, even among the nondefining variables.
Of course, many important questions remained to be investigated as to the nature and generalizability of their findings. Despite the consistency of their findings, Tupes and Christal did not believe that only five factors represented the breadth of high-level personality space:
It is unlikely that the five factors identified are the only fundamental personality factors. There are quite likely other fundamental concepts involved among the Allport-Odbert adjectives on which the variables used in the present study were based.
Two years later, Warren Norman would publish his 1963 paper replicating the same five factors and label them with Roman numerals: (I) Extraversion or Surgency; (II) Agreeableness; (III) Conscientiousness; (IV) Emotional Stability; (V) Culture. This paper seemed to get relatively more attention, and for this reason the Five are often referred to as Norman’s Factors in works published prior to the field reaching its modern consensus on the FFM.
This seems like the appropriate time for us to become more closely acquainted with the five factors. If you want to really relate to the experience, I would encourage you to take this FFM inventory (based on a peer reviewed and publicly available question inventory).
Before I start, a few things:
First, trait scores are normally distributed (more on this in Part 3). So, when I talk about “high E” or “low A”, this should always be understood as “high E relative to the population average.” Unless you live in a very small, insular community, your intuition about what the average individual for any of these traits looks like is probably correct.2
You will also notice that I will be using lots of words and phrases like “tends to”, “usually”, “is more likely to”, and so on. This is not just me hedging my bets! Traits describe an individual’s behavioral tendencies in response to any given situation, not a set of invariant rules that are always followed.
Finally, we must remind ourselves that in trying to assign single words to each trait, we are tasking five words with representing some 5,000 trait-terms. No single word for each factor will be able to capture the entirety of the category without over-emphasizing some of its aspects and giving short-shrift to others. Remember, the Five represent the broadest distinguishable personality traits. The map is not the territory, and all that.
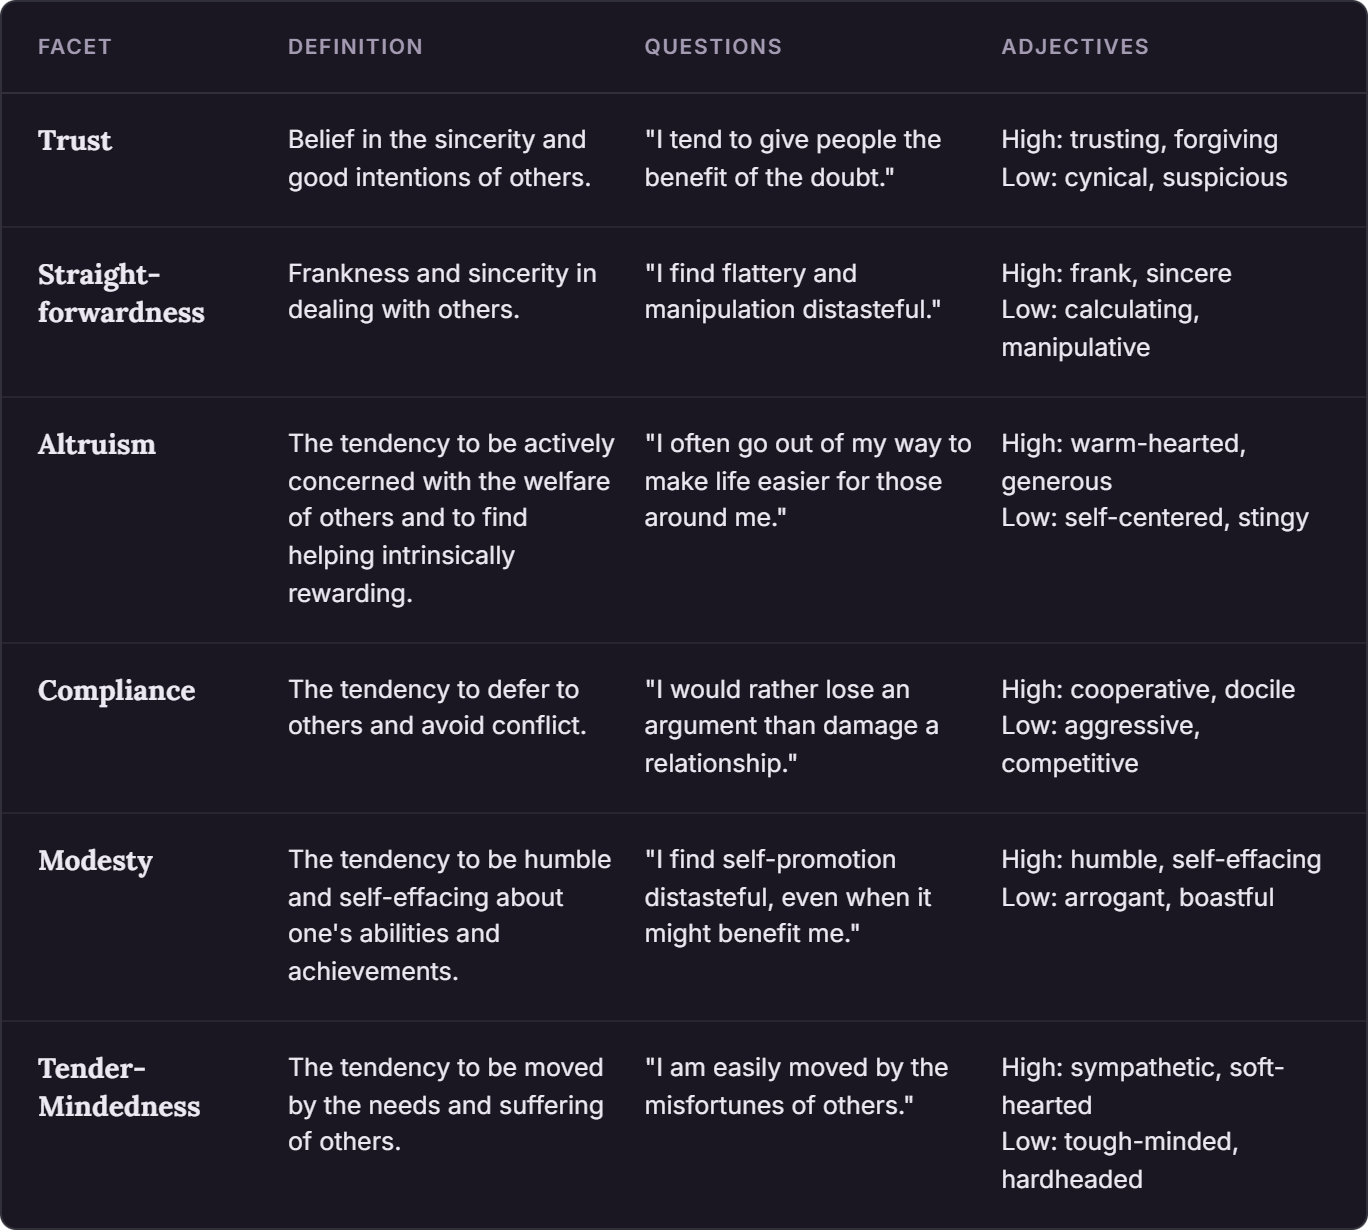
To help better define the contours of each of the Five I will include descriptions of each factor’s facets from the NEO-PI-R.3
Facets represent aspects of the factor to which they belong; distinguishable from one another, but still tied to the main factor. This is important when interpreting the results on an individual level; scores on the Five might give you a general sense of a person, but two individuals who score high on the same trait can look very different from one another. A warm, affectionate grandmother and a domineering trial lawyer are both high in E, but in very different ways!
Tendency towards negative emotionality/affect is the core of N. It might be described as “the degree to which a person experiences and tolerates negative affective states.”4 Or “the degree to which a person experiences the world as threatening and beyond his/her control.” (Hogan & Hogan 2007). Depending on your assumptions, it is either obvious or counterintuitive that other pole of N is simply the tendency to not experience these things, as opposed to a tendency towards positive emotions.
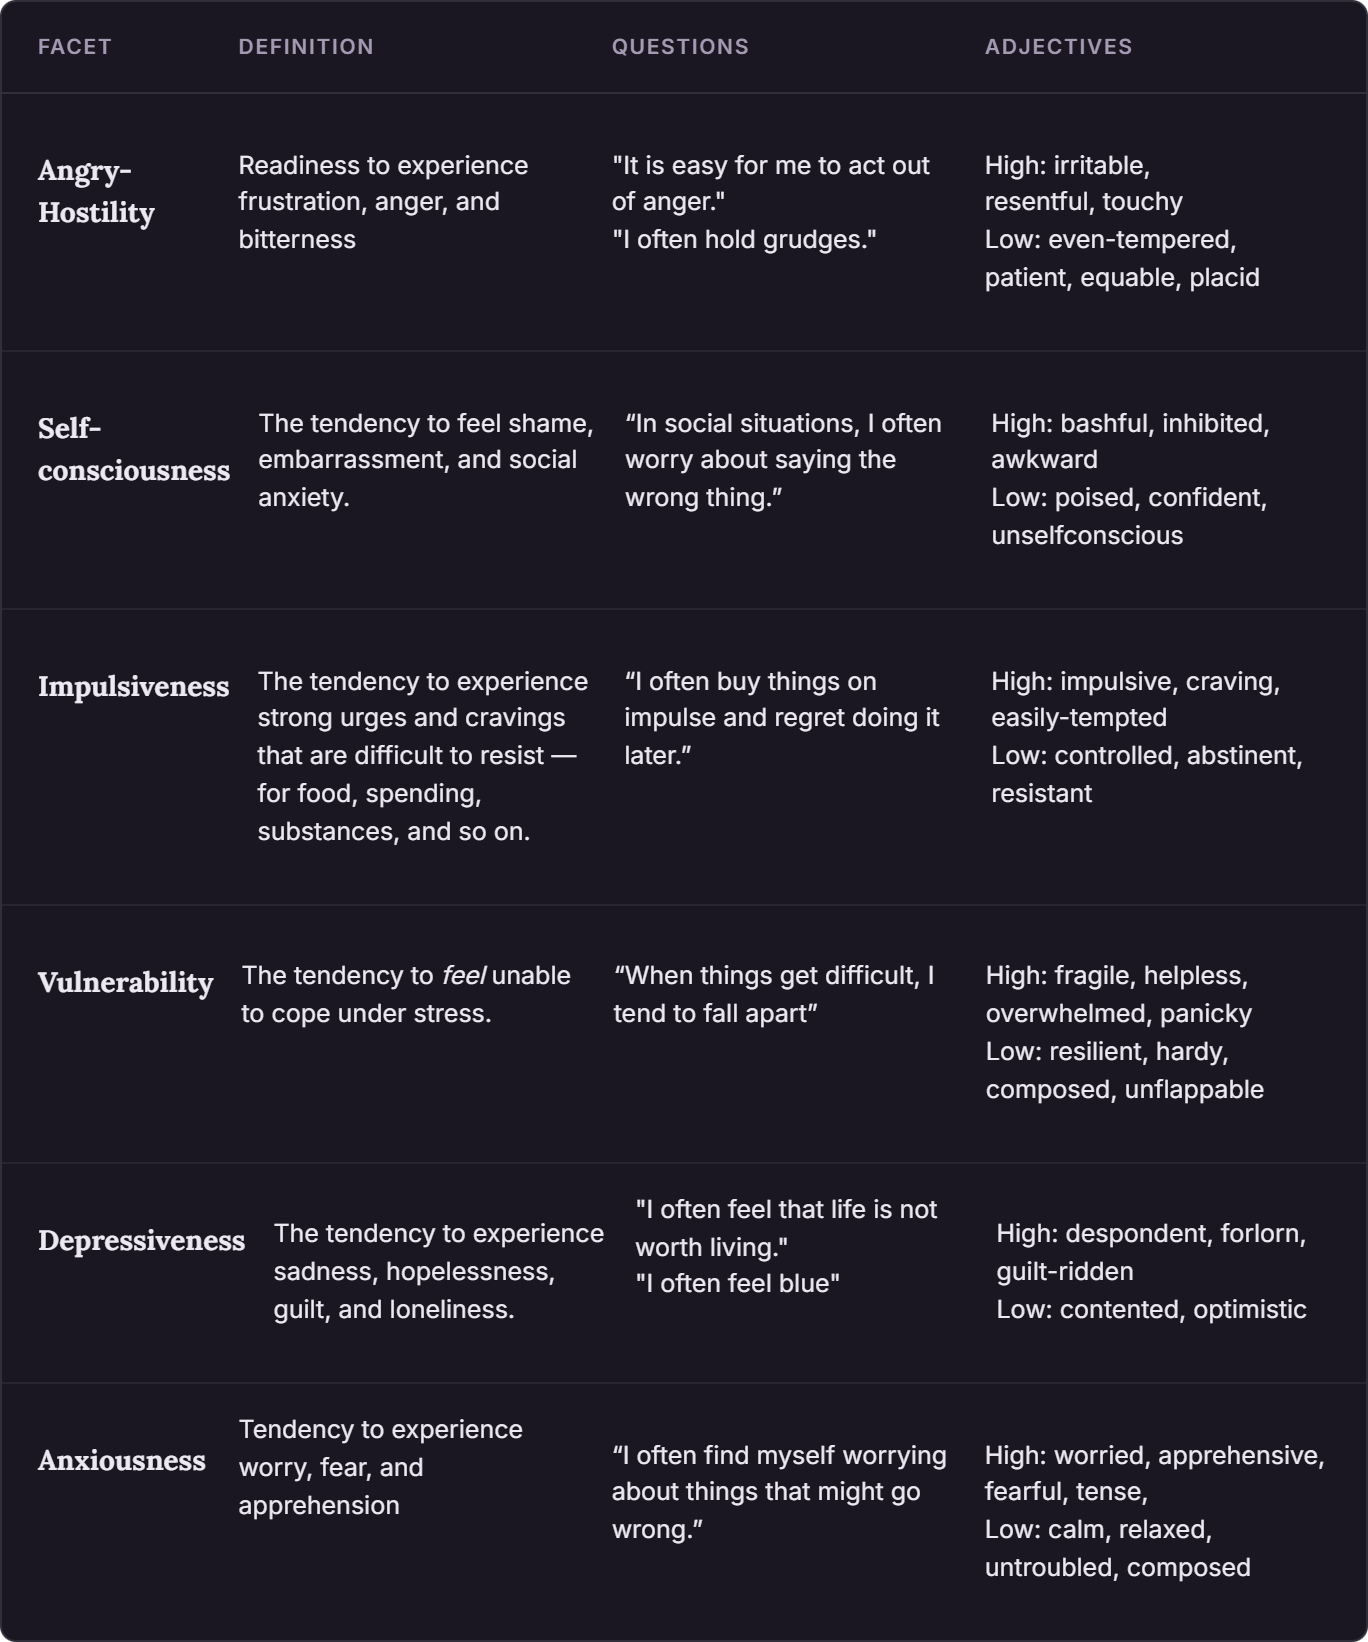
Individuals who are high N tend to be nervous, gloomy, and pessimistic. It often seems as though their default reaction to events is to interpret them in a negative light and become angry, bitter, and frustrated. This may be especially noticeable in social situations, where they have little ability to tolerate perceived or actual social slights. It is not just that they are more likely to become anxious, angry, or sad; they tend to experience these emotions to a more intense degree than others. This emotional dysregulation may predispose towards impulsive behaviors that manifest as a tendency to indulge in various vices such as smoking, drinking, or overeating. In a general sense, they are predisposed to see themselves as people of little value or worth, even if they are able to identify some strengths in themselves.
Low N individuals are the sorts of people we tend to describe as calm, even-keeled, and emotionally resilient. The frequency of their negative experiences tends to be low, as does their intensity, which means that these internal experiences are less likely to drive them to behave impulsively. Socially, they appear self-confident and unbothered by the opinions of others, which reflects the lack of strong emotion those opinions tend to elicit. While they do not view themselves as generally worthless, it would be a mistake to assume that they necessarily have high opinions of themselves.
There has been much debate about precisely which traits lay at the core of E, but it seems to be some mix of sociability, assertiveness/social dominance, and energetic nature. John and Srivastava (1999) describe it as implying “an energetic approach to the social and material world.” I should also point out that E captures the tendency to experience positive emotions (or not), in the same way that N captures the tendency to experience negative emotions (or not).
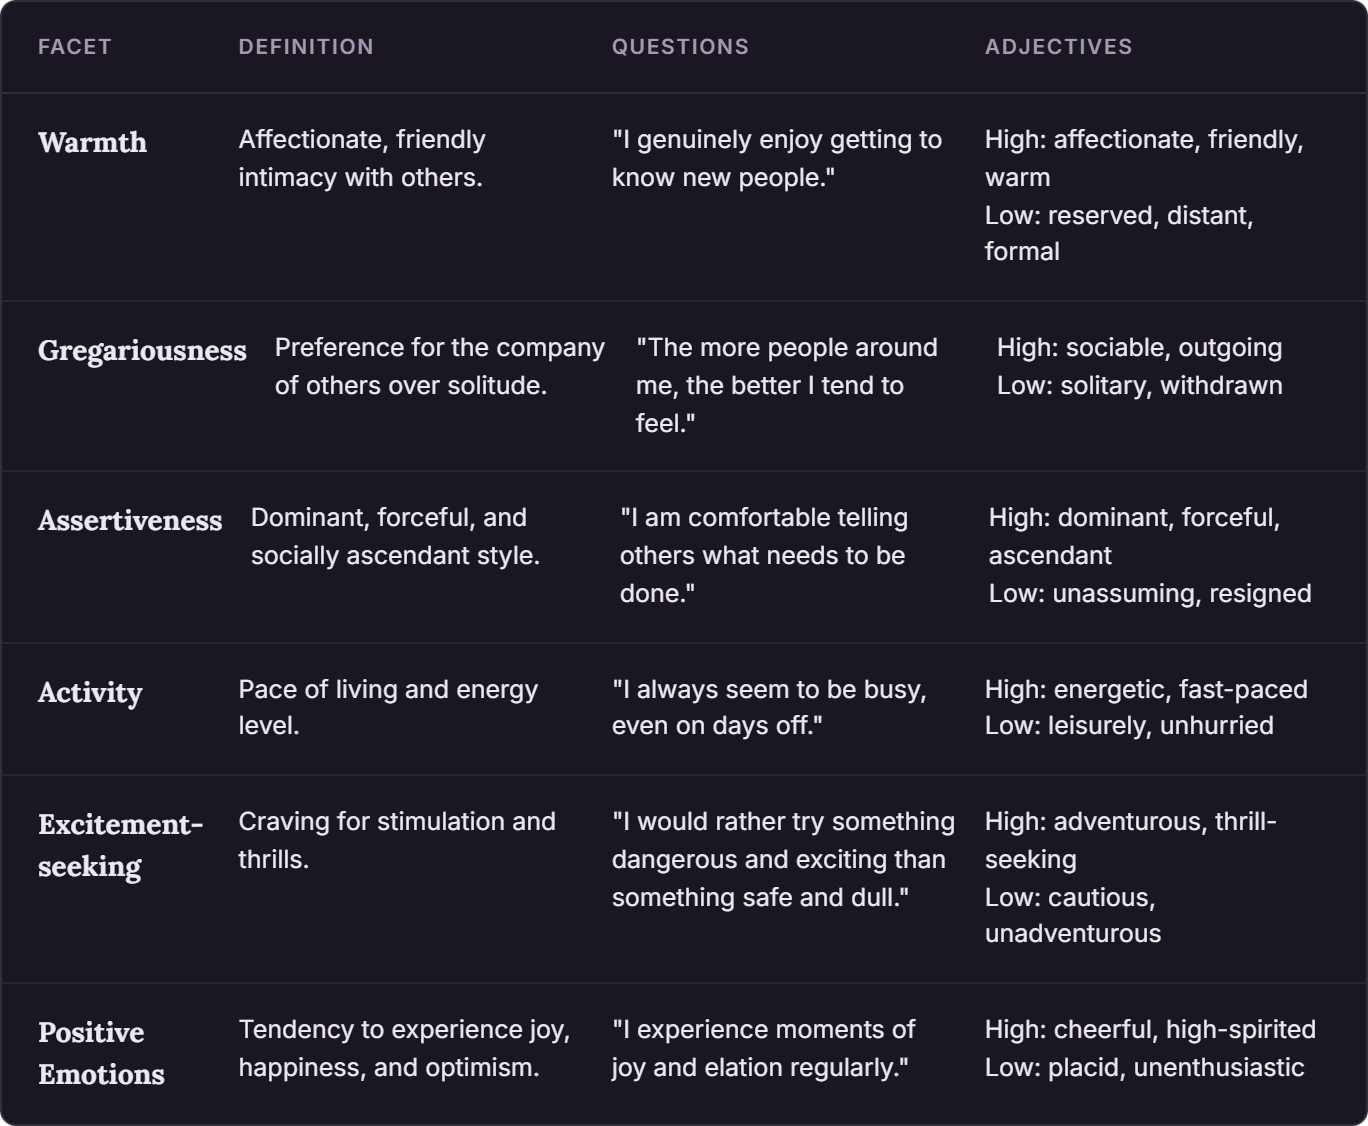
Individuals high in E are described as energetic, friendly, charismatic, and cheerful. They are usually socially assertive and interpersonally persistent; the sort of people who constantly seem to be going out and doing something exciting… and trying to get you to do it with them. They tend to openly express their affection for others and do not feel awkward about doing so. At the extremes, some high E individuals may appear to do things just for the sake of doing something, even if it is reckless and means very little to them. Others may come off as interpersonally disingenuous, pushy, attention-seeking, performative, and unable to know when to shut up. Just because high E individuals like others doesn’t mean that the feeling is mutual. As Costa & McCrae remind us:
Salesman, those prototypic extraverts, are generally happier to see you than you are to see them.
Individuals low in E are the sort of people we might see as solitary, formal, cautious, unenthusiastic, and unhurried. At social events they tend to keep to themselves or to small groups of people; if put into a large group they are not interested in trying to lead the conversation or fill silence. Even when they are genuinely interested in others, they do not radiate warmth in the way that high E individuals do. They are often the sort of people “you have to get to know” before they open up. At the extremes, low E individuals may seem totally disinterested in social life or so emotionally bland that you wonder if they’re even familiar with the concept of a good time.
(A) mostly captures the rest of the interpersonal aspects of personality that fell outside of E.5 John and Srivastava conceptualize A as “[contrasting] a prosocial and communal orientation with antagonism and hostility.”
It is worth noting that A (along with C and in my opinion O) is what we might call “highly evaluated”; it contains traits that are most strongly associated with our societal morals. Regardless, this does not diminish the fact that both traits represent objective, observable differences between individuals. I have also seen some individuals complain that the evaluative language that captures A and C somehow reflects a flaw of the FFM or a thumb on the scale from psychologists who have poorly selected their adjectives, but this is exactly backwards! If we accept the lexical hypothesis, evaluative language is present in the FFM because it is present in ordinary language, and therefore reflects some important, salient aspect of personality worth communicating and identifying.
Individuals who are high in A are the sorts of people generally described as nice or kind. They tend toward honesty, though they will generally do their best to soften the blow and avoid arguments. “Let’s agree to disagree” is the sort of thing that a high A person often says. A is also where you will find the traits associated with ‘bleeding-hearts’; more likely to be moved by the plights of others, more likely to notice them in the first place, and more likely to actually do something about it. At the extremes, high A individuals may be seen as spineless, naive, and gullible. Unwilling to stand up for themselves even when a situation demands it, or such a bleeding-heart that they find excuses to keep giving money to the fentanyl addict who turns around and buys their drugs right in front of their eyes.
Individuals low in A might describe themselves as “realistic about how the world works.” They do not necessarily think that everyone is out to get them, but usually believe that people are motivated by their own interests. Interpersonal conflict tends to be seen as a necessary part of life. Total fabrication is not typically acceptable, but selectively framing the truth or offering partial truths may be seen as justified if there is a good reason. The suffering of others is noticed and responded to — they are not uncaring — but they are more likely to be selective about how and when they offer aid to others. Very low A individuals are the sort of folks most of us would view as sociopaths. They are experienced as Machiavellian, callous, rude, and manipulative.
C seems to capture something approximating self-control, but with a broader framing than the phrase implies. It certainly captures concepts of self-restraint — the opposite of C is often referred to as Impulsivity — and a tendency to adhere to some form of a moral code. However, it also captures self-control in the proactive sense; C has been called will to achieve and McCrae and Costa use undirectedness as its antonym in some papers.
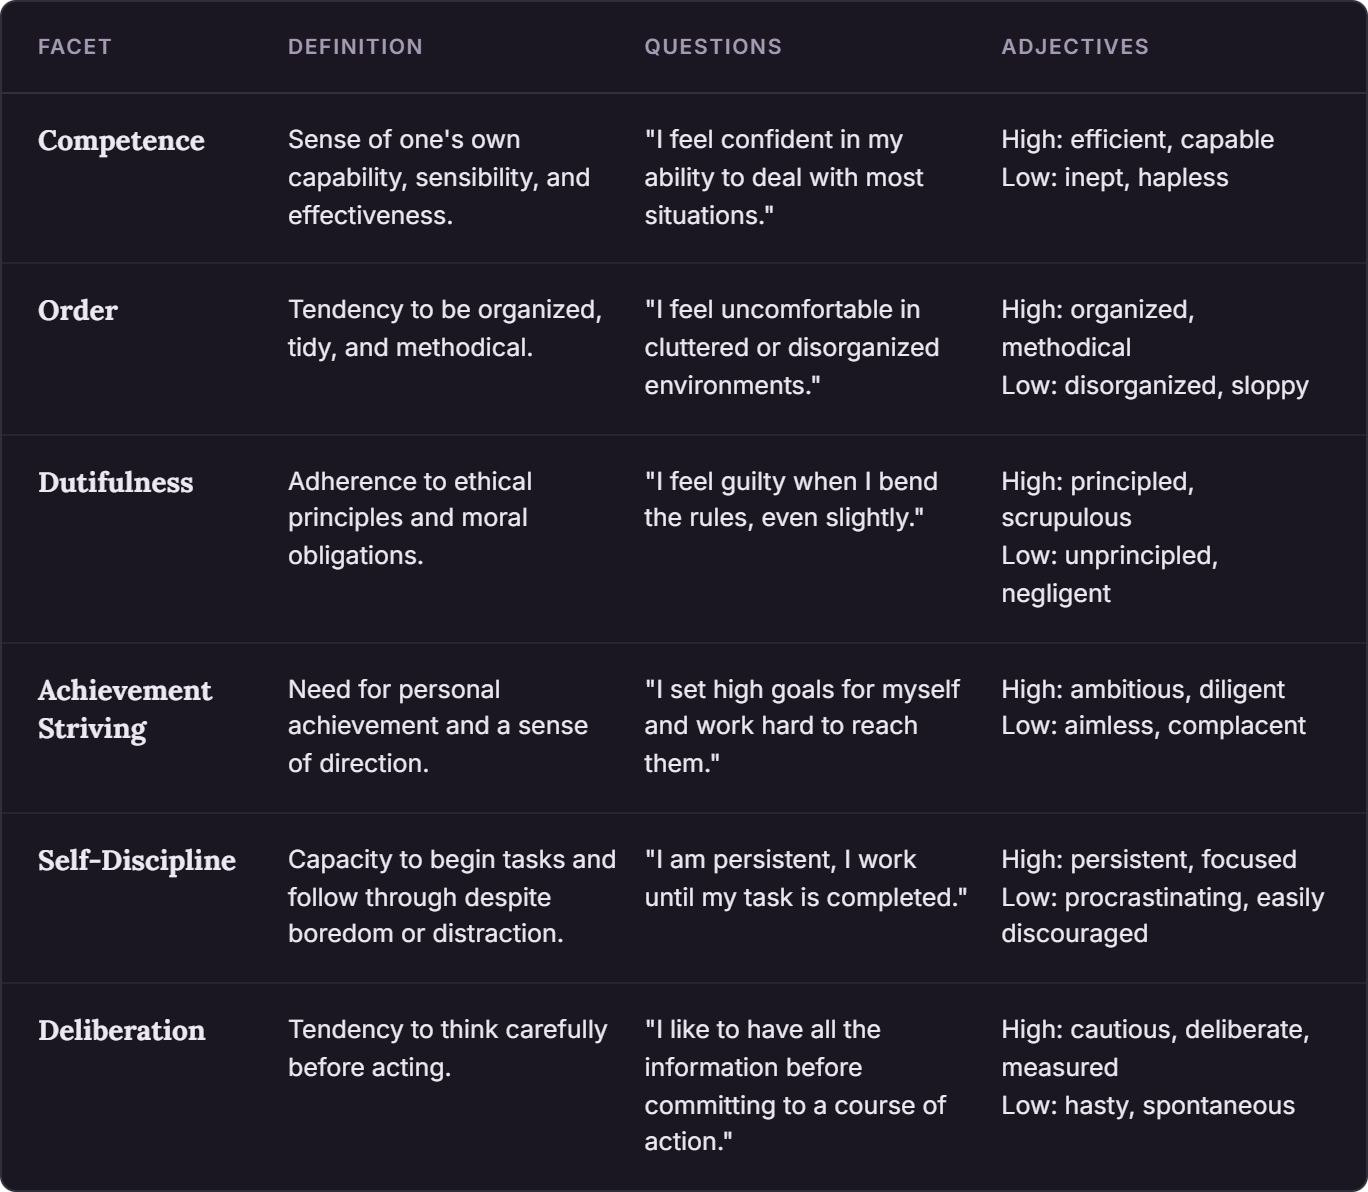
Those high in C are often the coworkers you admire for their work ethic. They tend to be orderly and clean and may find the lack of neatness in others perplexing. They are confident in their abilities and set their goals... probably a little too high, actually. Planning is usually done systematically and deliberately, sometimes even when it’s not really necessary. Boredom, grunt work, and long time horizons can be tolerated in service of a goal, though it may be difficult for them to know when to step away. Their promises and commitments are usually kept, which usually gives them a reputation for reliability. Extremely high C individuals tend to be experienced as rigid, hyperambitious, and inflexible; the workaholic with an immaculate home that they never actually spend time in because they seem to be in the office 24/7.
Low C individuals might be described as messy, undisciplined, and flaky. Important, frequently used items or objects might be put somewhere reliably, but organizing everything else is just… not that important most of the time. They might view themselves as less capable than others in terms of their ability to get things done which may reflect a poor sense of how capable they actually are. Commitments are hedged or made lightly, partially because something more interesting might come along, and partially because they have no desire to push through tedium. At the lowest end of C are people who are regarded as lazy.
John and Srivastava say that (O), “describes the breadth, depth, originality, and complexity of the person’s mental and experiential life.”
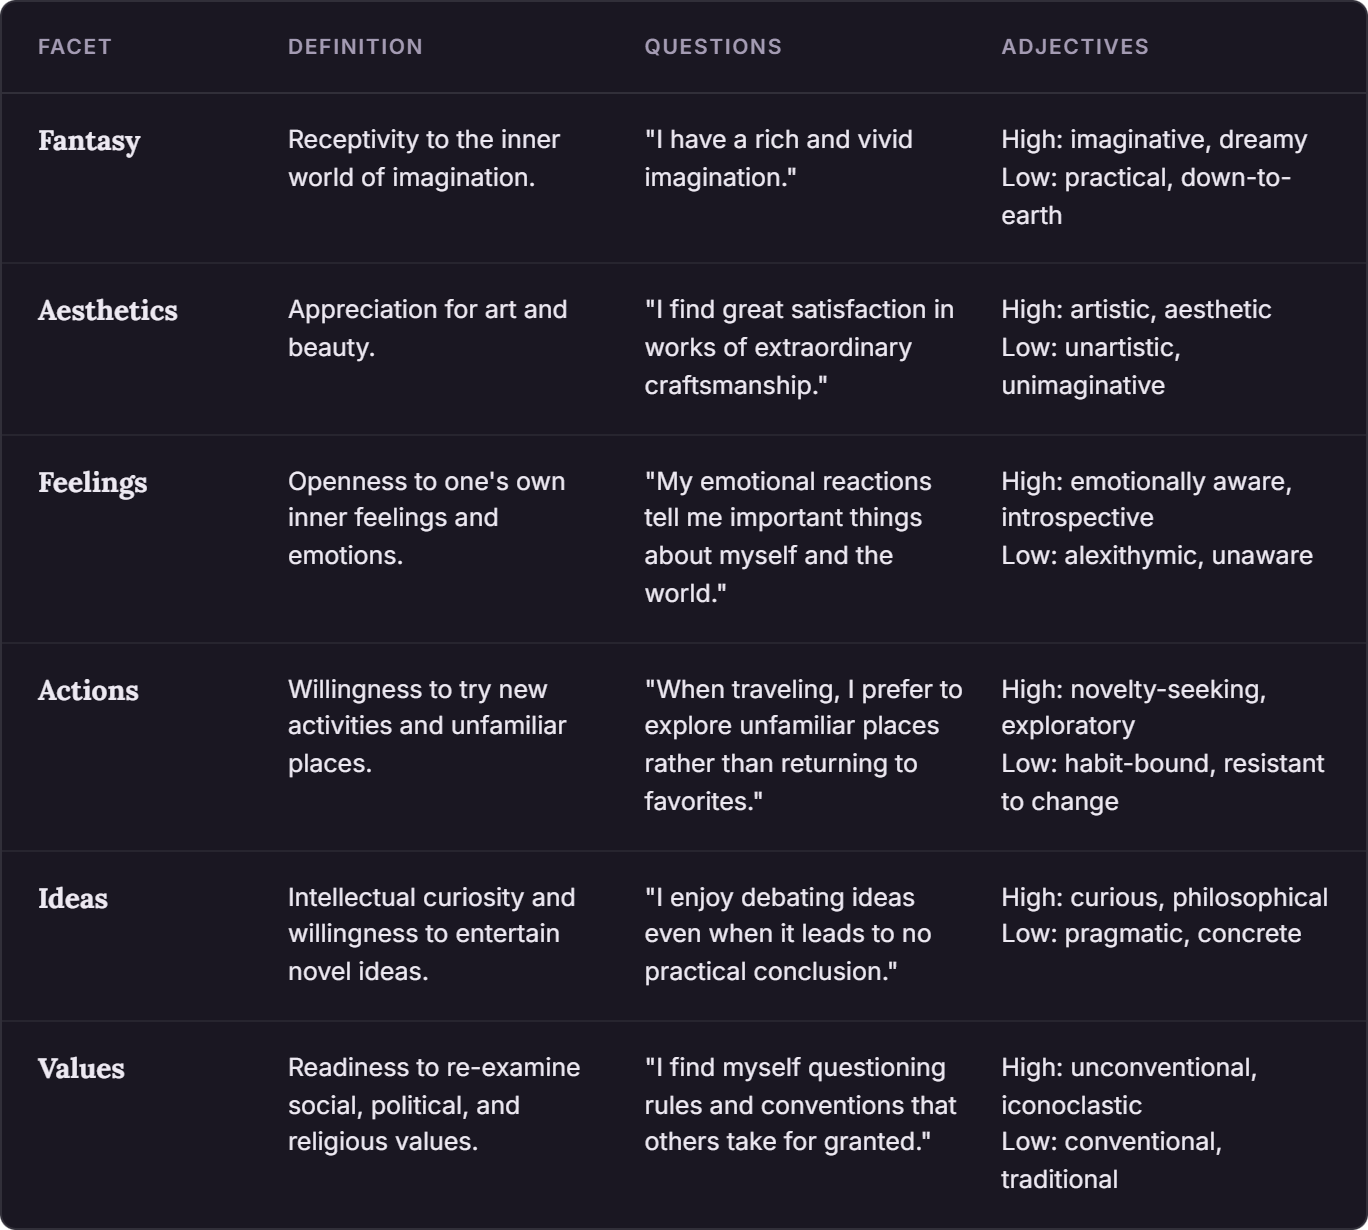
Individuals high in O tend to be curious and imaginative. The sorts of people who have “rich internal experiences.” They tend to be willing to engage and consider new and unusual thoughts or ideas without dismissing them out of hand, and often come up with a few of their own while daydreaming. They tend to interrogate and notice their emotional experiences more than others and usually have a better and more nuanced vocabulary for describing their moods. Those at the upper extremes of O might struggle to keep themselves grounded to such a degree that they alienate themselves from others, coming off as pretentious and self-absorbed.
Individuals low in O tend to be seen as more practical, conventional, and simple in nature. They are content with doing things the usual way, whatever that way might be, because routine is comfortable. Fantasizing is often seen as uninteresting or pointless; why engage in something abstract when the real world is right here? Art and music is enjoyed, but not necessarily viewed as deep or moving. Those with exceptionally low O may come off as totally concrete, either unable or unwilling to engage with even the narrowest hypothetical or challenge to the status quo.
Although those high in O may be seen by themselves and others as more intelligent, intelligence (g) is its own, separate factor. There is a modest correlation between the two (r = 0.30), and it may be that one predisposes to the other, but they are not the same.
Even with explanations of the facets, there are some that are difficult to distinguish without some further explanation.
The degree to which an individual has a generally positive view of themselves is primarily captured in facets of N: self-consciousness and depressiveness. C’s competence is more reflective of an individual’s cognitive assessment of their ability to handle tasks. An individual high in all three might view themselves as highly skilled at their job, but this does nothing to change their belief that they are ultimately a worthless, unlovable human being.
N’s vulnerability is a bit harder to distinguish from competence, and there are arguments that it cannot be. The idea is that vulnerability is about the affective experience of falling apart under pressure, while competence reflects an individual’s more detached, cognitive assessment of their ability. An individual high in both, when presented with a hypothetical in which they are given a task free of external stressors, they might confidently assert their ability to complete it, but would also admit that they would fall apart under a scenario with more realistic workplace pressures and interpersonal conflicts.
It is worth spending a moment to tease apart the differences between C’s deliberation, self-discipline, and E’s impulsivity. Deliberation is about how someone plans to approach a pre-defined task. Those high in deliberation are more likely to spend considerable time outlining, researching, and investigating the problem they are faced with before they begin to tackle it. Those low in deliberation are the sort of people who prefer to get started and figure things out as they go along. Self-discipline refers to the ability to avoid procrastination and tolerate the boredom that attends the task. E’s impulsivity is more about an individual’s reaction to uncomfortable internal states.
The person who is high in deliberation, self-discipline, and impulsivity spends a month researching the absolute best method to quit smoking, discusses it with their physician, and consults a few friends. They even meticulously write out a calendar with specific dates to cut down by exactly one cigarette a day, despite the fact that they find doing so extremely tedious and boring.
Then, they give up on day 2 because their cravings are too strong to resist.
If N and E already seem to capture positive and negative emotions, what distinguishes O’s feelings?
Think of N and E as containing information about the frequency and intensity of an individual’s positive and negative emotional experiences. O’s feelings instead captures the degree to which an individual tends to reflect and examine those emotional experiences.
People low in feelings but high in E’s positive emotionality are the kind of people who tell you that last night’s party was “GREAT! The best time ever!” but when you ask them what they enjoyed about it, they look at you with a puzzled expression on their face and say “I don’t know, it was just fun.”
Well let me tell yo-
Starting in the 1970s and continuing into the late 1980s, arguments over the meaning of the results obtained by personality inventories would lead to what McCrae and John refer to as the “demoralization of personality psychology.”
Researchers using personality inventories had taken for granted that they reflected real-world behavior and were applied consistently across individuals, but this had not been rigorously tested. In the 1970s, a series of studies would cast doubt on this assumption and forced the field to reckon with whether or not it had truly escaped its susceptibility to what Galton called “verbal magic”.
Borkenau, in his 1992 paper summarizing the history of this particular academic spat, outlined two major questions that the field needed to answer.
That is: Can trait ratings for a single individual be assigned consistently based on observed behaviors?
To my eye, this question contains at least two subsidiary ones: (1) Do trait terms generally seem to mean the same thing across individuals (e.g. is my ‘gregarious’ your ‘gregarious’?) (2) If yes, do differences in trait ratings actually reflect differences in behavior between individuals?
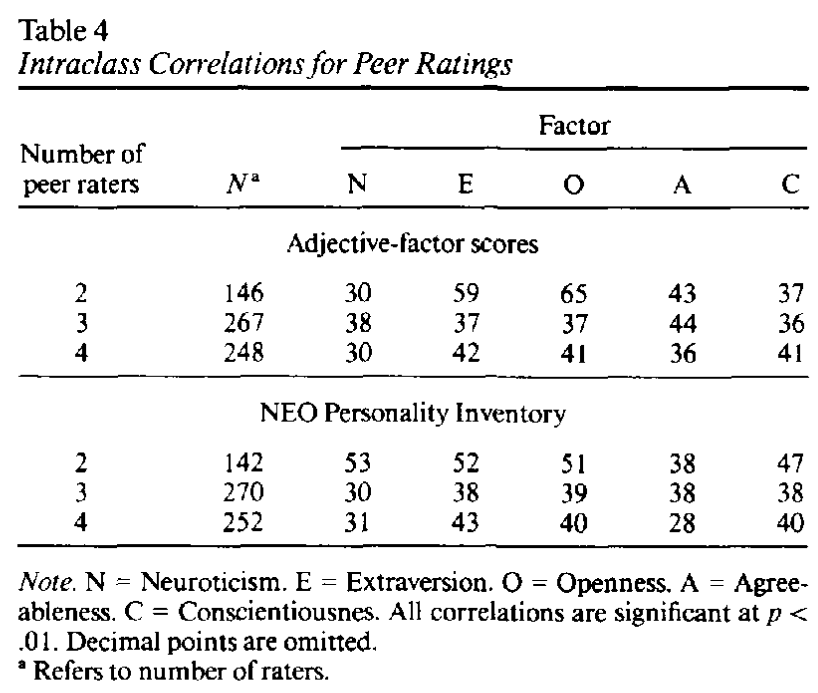
The first question can be answered in many ways. For example, we can ask whether or not two (or more) people rating the same individual produce substantially similar results. Many papers from the time showed that the answer was clearly yes, including McCrae & Costa (1987):
We can also ask whether self-report and peer-ratings correlate with one another. Again, many studies from the 1980s answered this affirmatively, including McCrae and Costa’s 1982 paper which correlated responses between self-ratings and spousal-ratings and found that “correlations ranged from .30 to .58 for the individual scales and from .51 to .60 for the 3 global domain scores [N, E, and O]” More modern meta-analyses, such as Connelly & Ones (2010) have also confirmed good self-peer reliability, finding that the average correlation for each of the Five Factors ranges from r=0.39 to r=0.51.6
Should we be surprised that self-peer correlations aren’t higher? Initially, I was somewhat underwhelmed by these numbers and skeptical of the r = 0.3 “barrier” that is sometimes used as a cutoff for validity in personality research. But the more I think about it, the less I think that this is the right question. Practically, we should be concerned with whether or not the strength of these correlations are sufficient to enable us to make meaningful predictions about the world.
For a little bit of real-world context, the correlation between:
Sex and height is r = 0.67
IQ and academic achievement is r = 0.54
Gender and weight is r = 0.26
Funder and Ozer, in their paper Evaluating Effect Size in Psychological Research: Sense and Nonsense, give the excellent example of Robert Abelson’s essay “When a Little is A Lot” Abelson, a baseball fan, wonders how much a single at-bat correlates with a player’s overall batting average. The top 10% of hitters average above 0.285 (they hit a non-foul ball at 28.5% of the time they’re at bat). In the 2025 season only 7 players had a batting average >0.300. These players get paid a lot of money.
You, like Abelson, might be surprised to learn that the correlation between a player with a batting average of 0.270 and the results of a single at-bat was a measly r = 0.056! Practically, Abelson points out, this means that when a manager selects a pinch hitter for a crucial at-bat, it matters very little who he selects in that individual instance. But, after 400-500 at-bats over the course of a single season, that small difference in correlation produces a practical difference that is valued in the millions of dollars!
To bring things back to the personality domain, take Funder and Ozer’s example of how high A might impact social functioning (emphasis mine):
How long will it take before he finds himself enjoying the enhanced popularity that is the reliable long-term result of [being high A] (Ozer & Benet-Martínez, 2006)? A back-of-the envelope calculation suggests that if the correlation between agreeableness and an individually successful social interaction is .05 (which is a hypothetical, conservative estimate), and if the student has 20 social interactions a day, then the consequences for his popularity in less than a month (550 interactions/20 interactions per day = 27.5 days) will be as noticeable as the consequences of batting ability for a baseball player’s success at the end of the season.
A more detailed discussion of real-world predictiveness will come in part 3, but I think this should tide over our misgivings for at least the present moment.
These self-peer ratings clearly indicated that trait terms were fairly consistently interpreted across individuals, but only suggested that trait ratings reflected true differences in individual behavior. Sam may be rated differently from Amy because of some difference between the two of them that has nothing to do with the differences in their behaviors. Maybe Sam has a tattoo on his forehead that says THIS MACHINE KILLS FASCISTS and so everyone rates him as very low in A even though he is actually average. Maybe Amy is a once-in-a-generation beauty and so everyone perceives her as being very high A because of some sort of psychological tendency to envisage very beautiful people as kind and benevolent.
The obvious way to answer this question would be for trained raters to compare the results of rating scales to observed behaviors (what the field calls ratings of ‘on-line behavior’). These studies had been done, but for reasons that I will explain in the next section, the studies suggested that the relationship between these two things were not so clear.
How else might we get at this question? Well, if we think raters really are basing their scores based off of an individual’s behaviors, it would be reasonable to assume that the visibility of the behavior should impact reporting. Specifically, we would hypothesize that more visible behaviors should be reported more similarly between raters.
Paunonen (1989) showed exactly that. When pairs of individuals were asked to rate a third person — with whom they were only somewhat acquainted — on a particular domain of behavior, the agreement between their responses improved based on how publicly visible the behavioral domain was. In further confirmation of our hypothesis, the visibility of the behavior did not improve agreement between individuals who knew the subject well.
Another hypothesis goes like this: Because some behaviors (and thus some traits) are difficult to observe, we should expect that self-other ratings should generally improve with the degree of familiarity between two individuals. This also appears to be true, and is best illustrated by this excerpt from Connelly & Ones (2010) meta-analysis:
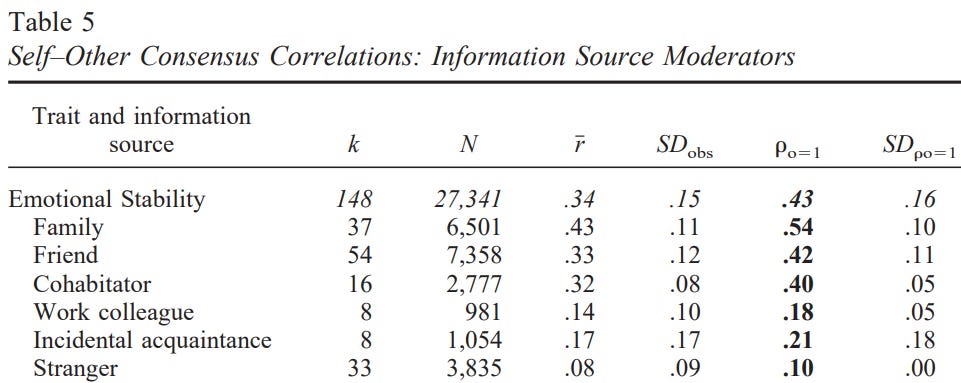
As the intimacy of the relationship increases, so do the correlations between self-other ratings: spouses/dating partners > friends/roommates > colleagues ≈ strangers.
In short, all signs pointed to a shared trait vocabulary being used to evaluate the specific behaviors of a specific individual.
This second question goes a little bit like this:
At some point, while judging someone’s personality, people have to make inferences because they’re not creepy little weirdos who follow their subjects around documenting every second of their day.7 When asked whether or not someone “Generally enjoys being the center of attention” a judge may not have had the chance to observe whether or not this is literally true and so has to rely on a mental model of expectations about how traits and behaviors co-occur. For example, we might have a general expectation that people who we have observed to be talkative also tend to be sociable. We refer to this as Implicit Personality Theory (IPT).
The question, then, was whether or not IPT accurately reflects reality, or something else.
The arguments around IPT were very concerned with the concept of semantic relationships: The degree of similarity or difference in meaning between two terms. Talkative and verbose — near synonyms — are highly semantically related. Talkative and sociable are related, but less so. Talkative and reserved are near semantic opposites.
The problem was that it was unclear where semantic relationships were formed, and how much they influenced IPT.
One hypothesis might be that semantic relationships don’t influence IPT at all. Instead, imagine that IPT is simply formed from accurate perceptions of correlations between behaviors in the real world, and semantic relationships are the products of these observations. When judges lack sufficient information about an individual’s personality, they rely on this accurate internal statistical model to make the guess that is most likely to be correct. Thus, even though some of the responses on the questionnaire are guesses, the FFM that results is still an accurate account of real-world associations between traits and behaviors. We call this the accurate reflection model of IPT.
The skeptical hypothesis is not so sanguine about our ability to perceive reality so accurately. Instead, what if IPT is based on the semantic relationships between different words? If semantic relationships are just a product of real-world observations, then we have nothing to worry about, but it’s not clear that we can make that assumption! Take this collection of semantically related words: gregarious, sociable, outgoing, happy, and cheerful. Why are they semantically related? It might be because they are all traits and behaviors common to people who are high E… but it could also be because they are: words with positive valence; traits that my culture values; or traits that God hard-coded our brains to associate with one another just to mess with psychometricians. The skeptics further assert that these semantic relationships distort our memories of witnessed behaviors, perhaps causing us to misremember the actual nature of events (e.g. someone who was only seen to be talkative is falsely remembered as talkative and sociable).
If we imagine a world in which (1) the semantic relationships that IPT draws upon contain incorrect information about how traits and behaviors co-occur -and- (2) everyone in the sampled population generally forms the same semantic relationships between terms, what would we expect?
We’d expect to a find a model that consistently produces the same factors, wouldn’t we? The problem is that those factors would just reflect some quirk of how we mentally categorize different terms. They would tell us nothing about how personality relates to behavior. This assumption, that semantic relationships always contaminate the IPT in significant ways, is called the strong version of the distortion model of IPT.8
How might you experimentally differentiate the accurate reflection model from the distortion model? While both predict that semantic similarities should resemble correlations among ratings of personality, the strong distortion model predicts that correlations among personality ratings and measured behaviors should be substantially different.
Testing this is pretty easy. Put a group of people in a room together for some period of time and have a hidden group of people observing them in real-time, recording the frequency of a range of particular behaviors. Then, some amount of time later, ask the people who were being observed to give ratings based on memory and compare the results.
For a little while, the evidence seemed to favor the strong distortion model of IPT quite, er, strongly. A 1980 study by Shweder & D’Andrade found a very weak correlation (r = 0.22) between memory-based and on-line behavior scores, but a very strong correlation between memory-based scores and semantic similarity (r = 0.75!). Even more strikingly, there was no correlation between on-line behavior scores and semantic similarity (r = 0.00!!!).
As Borkenau pointed out, Shweder & D’Andrade’s observations were just one of a collection of studies that all appeared to show the same thing: poor correlations between personality traits and on-line measurements of behavior, but very strong correlations with semantic similarity:
It seemed like Shweder and D’Andrade were right! People weren’t reporting what they actually observed, they were being led astray by the semantic similarities distorting their IPT.
Borkenau, though, was not so sure. He was willing to concede that the distortion hypothesis was probably right about one thing: IPT and semantic relationships did not come from observations of co-occurrences between traits and behaviors. Where the semantic relationships come from was left as an open question. Maybe they are evolutionarily hard-wired. Maybe they reflect cultural models. Probably, it was some combination of the two. Whatever their true origins, Borkenau contended that semantically related terms were not distortionary, but referred to “overlapping act universes.” This is the overlap hypothesis of IPT.
For example: Let’s say that it is a fact that people who are orderly are also the sort of people who keep their promises and vice versa. Now, imagine that Grug is trying to decide who to trust to defend wife and child while go hunting after move to new village (old village attacked by big lion). Og promise defend wife and child, but Nog also promise defend wife and child. Grug not know if Og or Nog keep promises with other village members, but Grug see Og tent messy and blood offering to spirits on Og shirt, while Nog tent clean and blood offering to spirits in designated sacrificial area.
You can see how evolutionary pressures might hard-wire semantic associations that cause Grug to (correctly!) infer that Nog is more likely to keep his promise than Og when it is both easier and less risky for Grug to use orderliness as a proxy for dutifulness. Remember that Borkenau says that the relationship runs in both directions, so instances of Nog (or Og!) keeping their promises would also act as proof that Nog is likely to keep tent clean and sacrifice blood off his shirt.
Even if there was no hard-wiring, cultural transmission could do the same thing. When Grug small, Grug parents tell Grug that it important for blood only spill on sacrificial altar and never trust people who tent messy.
So, even if it is true that semantic associations do not arise from an individual’s direct observations of behavior (this is what the accurate reflection model proposes), these associations are still driving the assumptions underlying IPT, and so personality ratings should still correlate with observed behavior.
Many findings in psychometric literature aligned well with the overlap hypothesis. Take prototypicality ratings, which represent the degree to which a specific act, e.g. “talking animatedly at a party”, is felt to represent various different traits.
If the overlap hypothesis is true, we should expect “talking animatedly at a party” to correlate well with terms like gregariousness and talkativeness, and anticorrelate with terms like shy or reserved. They did.
The overlap hypothesis also was consistent with findings that semantically similar terms closely correlate with personality ratings.
The remaining problem — that still flatly contradicted Borkenau’s hypothesis — were all of those studies showing a nearly non-existent correlation between personality ratings and on-line measures of behavior.
Borkenau, however, suspected that the methodology behind the on-line rating of those studies contained a flaw that would be the key to proving the overlap hypothesis correct. The flaw in question was that the on-line raters in those studies — either by design or as a consequence of the rater’s behaviors — only paired a single observed behavior with a single trait term. To Borkenau, this was nonsensical. Surely seeing an individual offer to lend their car to a colleague should be indicative of both trustfulness and altruism. He suspected that if raters were asked to match an observed behavior with all appropriate trait terms, the results would be quite different.
So, Borkenau did his own study to test this exact idea. The results from his 1987 study in the first table are the product of a forced-choice rating scheme; one behavior to one trait-term. However, when raters were instructed to assign as many trait terms to a single behavior as they felt were appropriate, the results looked rather different:
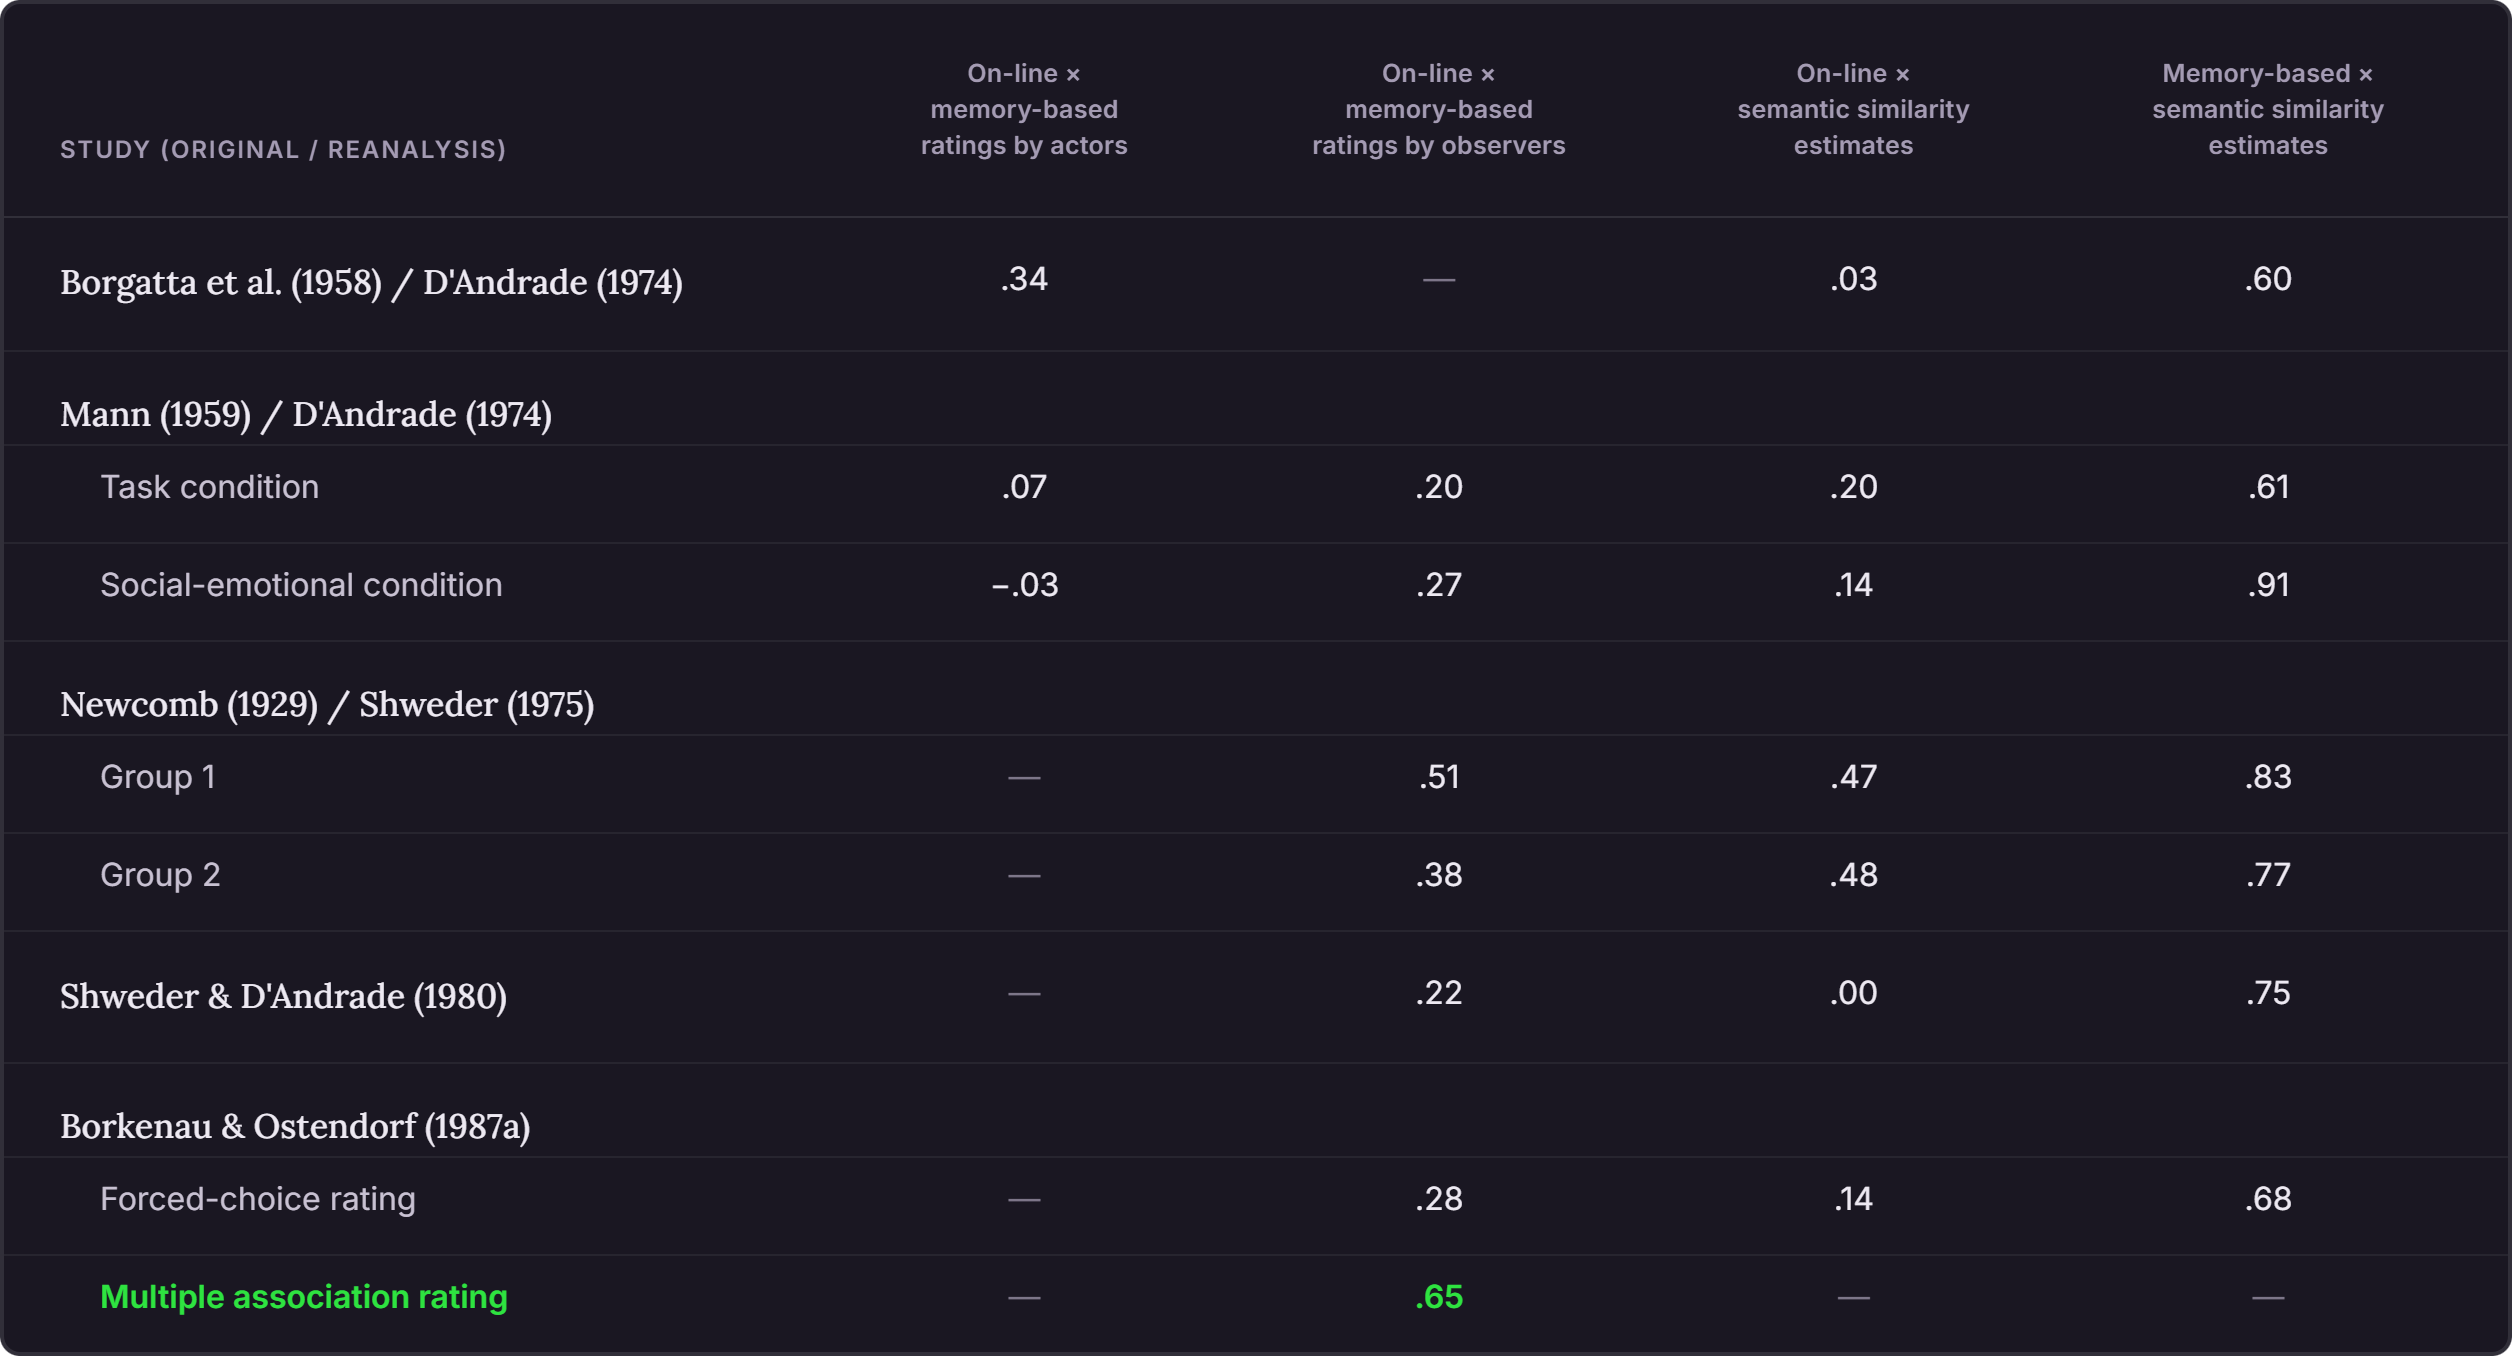
This is not Borkenau’s only critique leveled at the distortion model — he walks through many more in that 1992 paper — but I think it is his most effective on putting the “personality traits are cognitive fictions” argument to bed.
Unfortunately for Tupes and Christal, their 1961 paper would only be appreciated in retrospect; there is no real indication that the field felt their findings represented anything significant at the time. But why not? McCrae and John observed that the field of personality psychology did not really believe that the discovery of a unified model of personality seemed particularly likely to come out of the field in its present fractured state:
One reason for this may have been the theoretical differences that divided personality researchers; another may have been the apparent hopelessness of any empirical attempt to identify basic dimensions. There were, after all, hundreds of personality inventories and scales, all requiring considerable time to complete. A grand factor analysis of all these would require thousands of subjects willing to donate days of their time, and even then there was no compelling reason to believe that the results would tell us any more than what kinds of traits trait psychologists were most interested in measuring.
Still, in 1970s there was a feeling in adherents of the questionnaire tradition that there was something missing. Eysenck's Neuroticism and Extraversion were generally regarded as fundamental aspects of personality, but it was clear that they could not capture the entirety of high-level personality traits. This led to a series of papers proposing the addition of further high-level domains that essentially matched the factors Tupes and Christal described a decade prior.
Oddly enough the first additional domain proposed was one approximating the FFM’s (O). In 1974 Tellegen and Atkinson published a paper titled Openness to absorbing and self-altering experiences (”absorption”), a trait related to hypnotic susceptibility in which they report finding:
…the familiar dimensions of Stability [N] and Introversion [E] and a 3rd factor, Absorption. Absorption is interpreted as a disposition for having episodes of “total” attention that fully engage one’s representational (i.e., perceptual, enactive, imaginative, and ideational) resources.
McCrae and Costa also argued for the existence of O (they called it Openness to Experience) and published their first personality inventory in 1985 with items designed to measure N, E, and O (that’s why it’s the NEO-PI).
The concept of C was suggested in 1980 as a further addition to such a model, but A never quite made it into the discussion before the lexical and questionnaire traditions eventually merged in the early-mid 1980s.
According to my 4th edition of The Handbook of Personality: Theory and Research, it was in 1983 that Costa and McCrae realized that their NEO system closely resembled three of the Big Five, but did not cover C and A. Their decision to revise their inventory to specifically include these two factors, seems to me to represent the clearest first step in the merging of the lexical and questionnaire traditions. A series of 3 studies by McCrae and Costa — two in 1985 and the third in 1987 — showed that their adapted questionnaires were able to capture C and A.
Still, it was not so clear that the two traditions were ready to be fully harmonized. A question lingered:
Did the questionnaire tradition capture anything additional about personality that the lexical hypothesis had missed?
In Part 1, Cattell contended (and I agreed) that natural language was likely to pick up on all major aspects of personality. However, Cattell was making this argument in the 1940s and I have the benefit of writing from 2026. In the 1980s the answer to this question was unclear. Maybe the questionnaire based tradition was asking questions about aspects of human personality that just couldn’t be reached by a lexical approach. Maybe there was a Jungian Shadow Factor that only the MBTI would pick up on because only the Jungians knew the secret phrases needed to get people to access their Shadow and admit that they were into feet or whatever.
The easiest way to answer this question was to simply collect responses to personality ratings based in the lexical hypothesis alongside responses to non-lexically based questionnaires (e.g. the MBTI, California Q-sort, MMPI) and compare the results of a factor analysis on both.
In 1986, McCrae, Costa, and Busch decided to ask this question using the California Q-Sort (CQS), primarily because of its origins. It was developed solely by psychodynamically oriented clinicians in the 1950s, well before Tupes and Christal published their 1961 paper. In fact the paper by Block describing the CQS, The Q-Sort Method in Personality Assessment and Psychiatric Research, was also published in 1961. The fact that the psychodynamic tradition was the dominant lens through which American psychiatry had chosen to view personality disorders (the current psychodynamically based 3-cluster model was added to the DSM-III in 1980) clearly presented a chance to put the lexical hypothesis to the test.
The Q-sort itself consists of 100 questions, printed onto note cards, with statements about the individual in question. Here are some examples taken straight from Block’s 1961 paper:
These note cards were then to be sorted (hence Q-sort) into 9 subgroups with a defined limit of cards — 5, 8, 12, 16, 18, 16, 12, 8, and 5 (notice the symmetry) — based on how well/poorly they described the individual. For example, among the cards that the judge felt were salient in describing the subject, he must select only the five most salient for the first subgroup, and then would have to select the next 8 most salient, and so on. My impression is that this is done to help reduce the cognitive burden of trying to simultaneously evaluate 100 statements at once
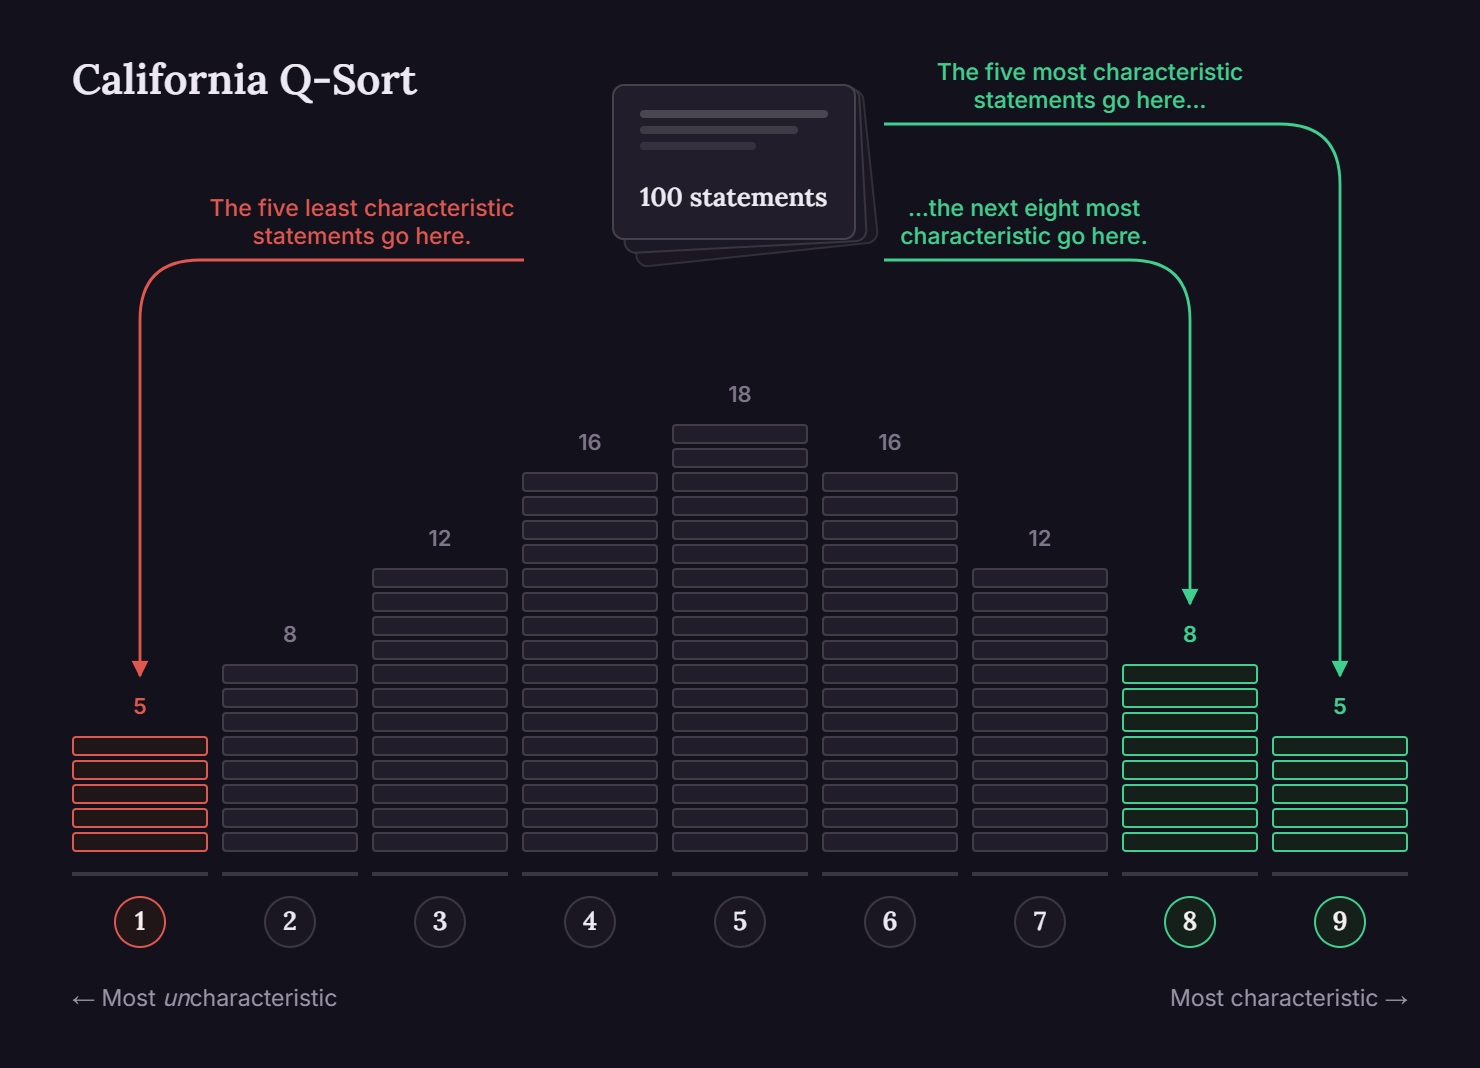
403 men and women from the Baltimore Longitudinal Study of Aging were recruited and assessed as follows:
Self-Reports
NEO-PI
Adjective rating scales
Preliminary A and C adjective scales
California Q-Sort
Spouse-ratings
NEO-PI
Peer-ratings
Adjective rating scales
NEO-PI
Interviewer Ratings (i.e. performed by a trained psychologist)
California Q-Sort
In 1986 they would publish their findings in Evaluating comprehensiveness in personality systems: The California Q-Set and the five-factor model. Let’s see how the NEO-PI matches up against the CQS in Table 3:
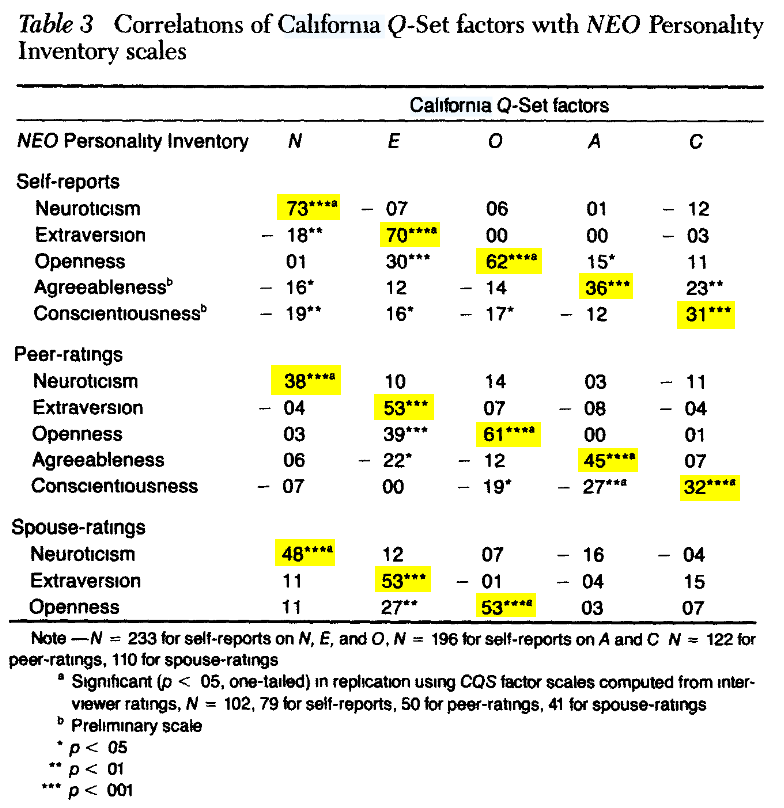
The big story here is that the CQS and the lexically-based inventories are all picking up on the same five major factors! They are not perfectly correlated, but this is to be expected. Remember that the NEO-PI is specifically designed to measure the FFM, and so uses questions that are specifically designed to minimize overlap between domains. The questions of the CQS are not and so contain questions that clearly overlap domains. For example, consider #53:
53. Various needs tend toward relatively direct and uncontrolled expression; unable to delay gratification.
Does this item better refer to a tendency to act impulsively in the pursuit of urges/cravings/desires (a facet of N), or a lack of tolerance for boredom/drudgery (a facet of C)?
I should be careful to mention that the authors are upfront about the fact that their factor-analysis of the CQS results suggested that either 7 or 9 factors would be needed to best explain the results. Naturally, they went with neither option. Instead, they picked 8 because that was the number found by Lorr in his 1978 factor-analysis of the CQS in a cohort of high-school aged children.
The additional three factors consisted of:
(1) A factor positively correlated with elements of E and C regarding productivity and level of energy and negatively correlated with A. This factor, “appeared to contrast strong vs weak aspects of character.”
(2) A factor about the tendency towards “introspection, comparison of self with others, evaluation of others’ motives, attention to social cues, and awareness of impression made on others” — importantly there is no emotional valence attached to these questions! — that might be interpreted as Psychological Mindedness.
(3) A factor clearly centered on physical attractiveness. Which is not a personality trait.
Of these three surplus factors, only the physical attractiveness factor represented a replication of the three surplus factors found by Lorr. Another minor, but consistent indication that the Five really did stand alone.

OK. So. The FFM can be recovered from the CSQ. What about other questionnaires? As it turned out, the five factors (or a subset, in more narrowly focused questionnaires) seemed to be recoverable in datasets from pretty much every personality questionnaire you cared to look at:
So, did the questionnaires capture something universal about personality that the FFM didn’t? Well… no, not really
There did not seem to be any additional aspects of personality that were only captured by psychological questionnaires. Psychologists — especially psychologists studying pathological behaviors — did not seem to have some unique insight into common aspects of human personality that could not be captured by a lexical approach. There were no traits that were consistently recovered across multiple different questionnaires except for the Five. The FFM really seemed to represent the highest level of distinguishable personality traits that were common to every group of individuals the field had studied so far.
Remember that the FFM is an attempt to describe a set of high-level personality traits that appear to be common across all individuals. This does not exclude the possibility that unique facets or traits might be found in particular sub-populations. There may be small, idiosyncratic aspects of personality that are only apparent in very specific sub-populations, because only members of those sub-populations actually notice or care.
For example, if you just looked at a sub-population of only psychiatrists, you might discover a new factor related to how a psychiatrist reacts when eliciting intense affect from their patients. The questions that load on this factor suggest that at one pole is the tendency to remain emotionally insulated, and at the other pole is the tendency to become emotionally involved and enmeshed. Maybe we call this trait Clinical Detachment vs. Affective Absorption.
If we look at the components of this trait, we see that it is made up of facets we’re already familiar with, things like tender-mindedness, compliance, depressiveness, anxiousness, angry-hostility, deliberation, and positive emotionality. In the general population these traits don’t form into a single factor, but in this example there seems to be something peculiar9 about people who choose to become psychiatrists (or perhaps something that being a psychiatrist does to the covariation of these traits.)
There are also some other interesting things that you might be able to imagine could have been personality traits in some other weird timeline of humanity. Like, what if there was a lot of variation in an individual’s tendency to view time in a particular temporal frame, and for whatever reason this mattered a lot societally or evolutionarily? Well, then maybe Zimbardo's Time Perspective (ZTP) would be the 6th factor… or something.
With many of the major theoretical arguments against the FFM put to bed by the studies of the 70s and 80s, the subsequent decades would feature a number of parallel efforts to refine and sharpen the growing consensus around the FFM.
First, scholars of the lexical tradition, including Lewis Goldberg, Oliver John, and Fritz Ostendorf would further develop and refine sets of adjectives that both replicated the FFM and better captured the entirety each factor.
The lexicicians (is that a word?) would also produce many studies looking at the cross cultural applicability of the FFM. That is, do we see the same Five Factors in people who speak different languages or in other cultures? Probably more on this in Part 3, but the short answer is that the Big Five are definitely the same across English-speaking cultures and in German. N, E, and C seem to be pretty consistent, O and A are on much shakier ground.
The field would also produce and validate a collection of inventories specifically for the FFM, including the Big Five Inventory, the International Personality Item Pool, and of course the NEO-PI.
Of course, now that the field had finally settled upon a single model to work from, other questions loomed. How consistent were the Five over time? Were they heritable? How culture-bound was the FFM? How language-bound was it? How do they relate to the DSM personality disorders? Could they be intentionally modified? Did they predict specific outcomes? If so, which ones?
Find out the answer to (some of) these questions in Part 3.10
This would later be expanded to include Psychoticism; which represented a predisposition toward impulsivity, aggression, tough-mindedness, and antisocial behavior. Basically a blend of C and A
Again, more on this later
My presentation of the names, descriptions, and precise boundaries of the facets are not to be taken as consensus among the field, though there are at least 3 facets from each of the Five that are generally replicated amongst the major FFM inventories, even if they go by slightly different names.
This is not my quote, but I cannot find where I pulled it from. If you can identify it, let me know.
Together, A and E form the Interpersonal Circumplex, which traditionally consists of the two axes of Dominance/Status and Affiliation/Love. E is described to either be strongly aligned with Dominance/Status or as existing somewhere between Dominance and Affiliation, while A clearly captures most of the Affiliation/Love axis.
N = 0.43, E = 0.51, O = 0.45, A = 0.39, C = 0.50
But now that I think about it, I wonder what the correlation is between self-stalker ratings are.
The weak version, which Borkenau says is “hardly controversial” is that ratings are occasionally distorted depending on the conditions in which certain behaviors are observed. The weak version “merely suggests that humans can be deceived about the actual covariation among events.”
I mean it’s many things, but just the one thing for right now
I am really going to try and get this done before my wife’s due date on September 1st. Promise.
Comments
Nothing yet. Say the first thing.
Sign in to join the conversation.