
Have you ever come across the idea of bootstrapping a yield curve backwards?
Picture this: you deploy a standard, well-tested bootstrapper in the market, only to discover later that it fails completely. This is exactly what happened to me in one of the markets I follow. I am using QuantLib. Then, I implemented my own bootstrapper - same outcome. Tried a different approach - same result again.
After this triple coincidence, I found myself genuinely scratching my head…
Let me explain:
Yield curve bootstrapping is a relatively common quant topic. In it’s most elementary form, it is taught in every quant finance program and is a frequent interview question too. However, when implemented in a multi-million-dollar market making business, it can become very fiddly. Every investment bank has a sizeable team maintaining it.
Over the past decade or so in this business, I have always bootstrapped IBOR curves the same way: starting from deposits, then incorporating FRAs/futures, and finally doing the swap section - progressively solving pillars from the evaluation date towards the maturity of the longest swap instrument.
In 2024, most central banks attempted to tame inflation by aggressively hiking short-term rates, pushing term deposits to record levels and inevitably inverting the entire yield curve during the process. One day, this shape brought situation in one of the markets, where the curve could no longer be bootstrapped correctly using regular method.
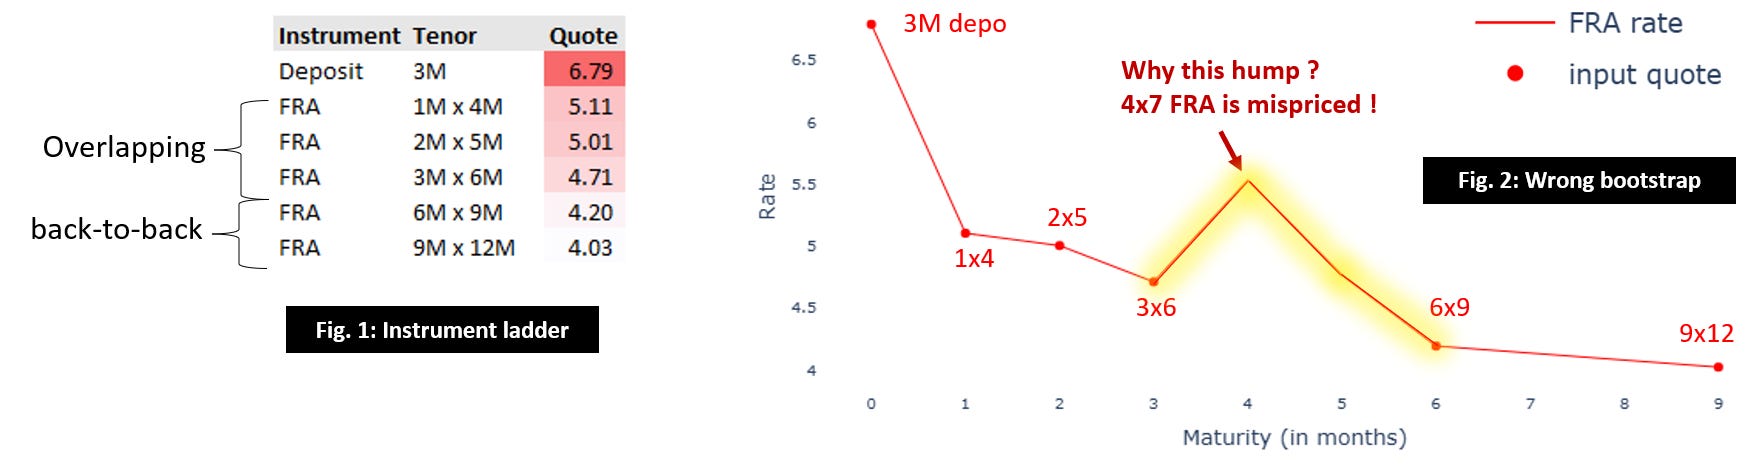
What makes this market unique is trading of overlapping IBOR-style quarterly FRAs on the short end (1x4, 2x5, 3x6), followed by back-to-back FRAs (3x6, 6x9, 9x12). The interaction between overlapping and back-to-back FRAs causes many “regular” bootstrappers to produce curve which cannot be used for trading.
This situation meanwhile vaned and I won’t disclose market particulars, but the mathematics holds universally, even on stylized examples.
You can try this yourself:
Plug the attached instrument ladder (Fig. 1) into your favorite quant library (e.g. your own implementation, QuantLib, or a proprietary solution at your own firm), and you will likely get the same result (Fig. 2). Would you be happy to trade such curve ?
The solution is to bootstrap the yield curve backwards - starting from long-term instruments and progressively working backwards to solve for the short-term instantaneous rate of the curve. This way, the characteristic hump can be avoided.
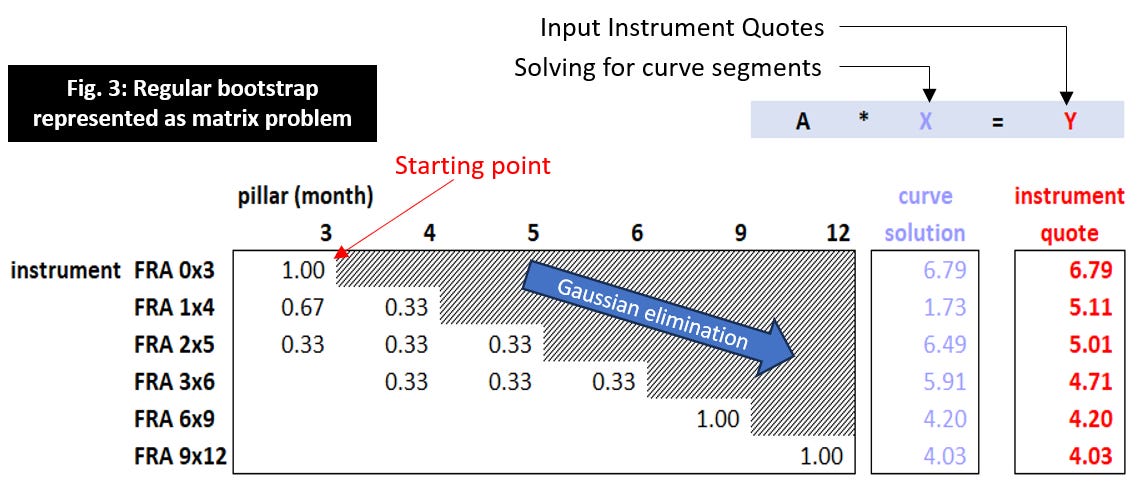
How exactly is this done? Regular bootstrapping is essentially solving a lower-triangular matrix using Gaussian elimination. The regular method solves this matrix from the top-left corner (e.g. from 3M deposit, which defines the instantaneous forward rate on the segment between T and T+3M).
In this example, yield curve is descretized monthly, so the matrix parameters (0.33, 0.67, etc) represent weighted day count fractions which form a three month FRA formula.
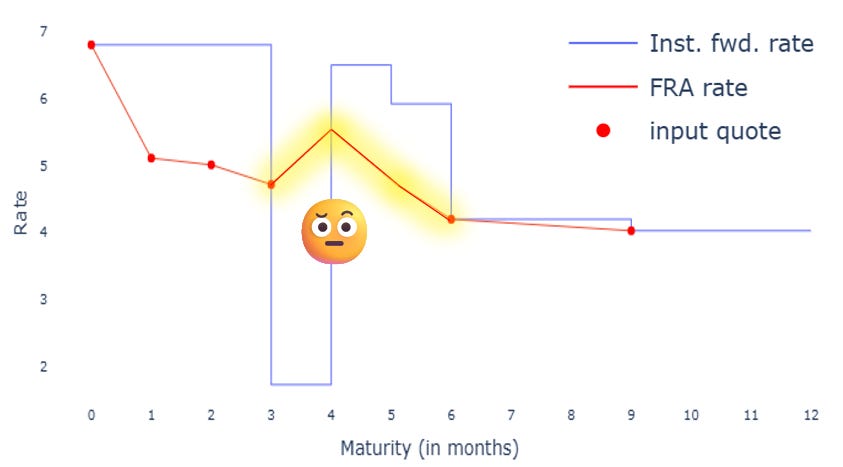
The result is unsatisfactory:
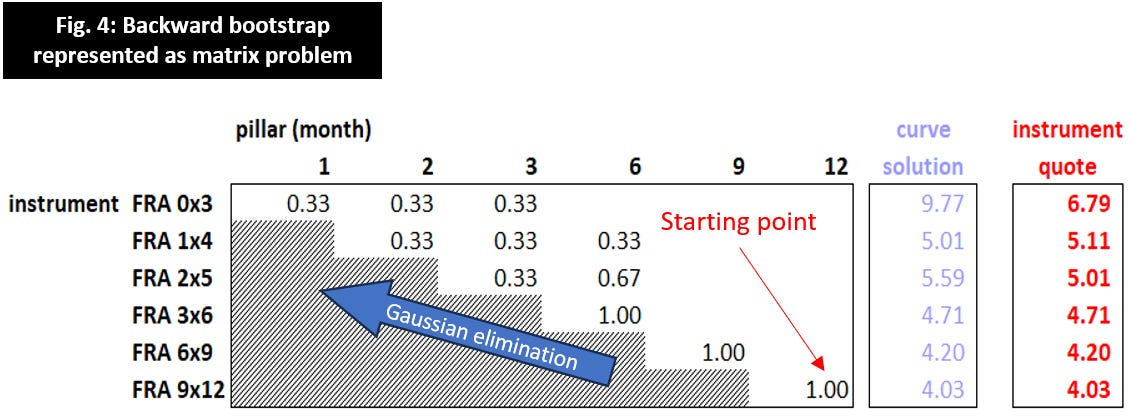
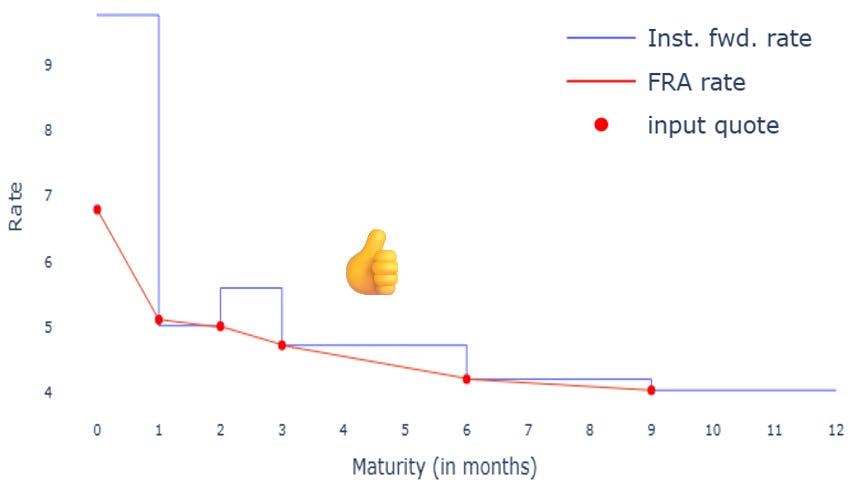
To bootstrap backwards, we introduce two additional degrees of freedom (at T+1M and T+2M). This redefines the problem into an upper-triangular matrix (Fig. 3) and solve it using Gaussian elimination from the bottom-right corner. This is the essence of “backward bootstrapping.”
The result is much better:
After spending few days “inventing” this solution, I discovered that in fact I did not invent anything new. Mathematically identical method (albeit worded differently) has been proposed in a 2014 paper by R. Baviera and A. Cassaro:
https://papers.ssrn.com/sol3/papers.cfm?abstract_id=2158131
The beauty of mathematics is that almost all new problems always reduce to a handful of fundamental principles described hundreds years ago. It’s extremely hard to come up with something new. However, one never stops learning. And that’s exactly the reason why learning mathematics is so important.
Let me know in comments how your own bootstrapper deals with this !
No posts
Comments
Nothing yet. Say the first thing.
Sign in to join the conversation.