
I’ve been puzzling over why the 85 and over population began growing after 2020 even though the oldest baby boomers are only turning 80 years old this year. The answer it turns out, as the following chart shows, is that 85 years ago births and birthrates had already begun to pick up from the trough of the Great Depression.
The blue line is the birthrate and the orange line is the number of births. They more or less follow each other until the late 1970s when the birthrate stays low while the number of births increases as the large number of baby boomers reach their childbearing years.
We hit a low point of 2.3 million births in 1933. The babies born during that year are turning 93 this year. The numbers gradually increased after that reaching almost 2.6 million in 1940 and just above or below 2.9 million during the years between 1942 and 1945, babies who are 81 to 84 today.
Then things took off with the number of babies reaching 3.4 million in 1946, the onset of the baby boom, over 4 million by 1954 and a peak of 4.3 million in 1957. They stayed above the 4 million mark through 1964, the last year of the baby boom.
As the chart shows, the birthrate then dropped precipitously, though the number of births by not quite as much since the total US population grew from 179 million in 1960 to 247 million in 1989, the next year the total number of births exceeded 4 million. In addition, there was a rebound because by then the baby boomers themselves had reached their childbearing years.
They stayed around 4 million through 2010, but then began declining again as shown in this chart.
We now seem to have stabilized at around 3.6 million births per year, from a much larger total population of 331 million in 2020.
But getting back to our 85 and over folk, as the following chart I created with the help of Claude shows, their numbers are already growing substantially by 44% this decade and will skyrocket by 58% during the decade between 2030 and 2040, before slowing to a more moderate 29% growth rate in the decade after 2040.
At the same time, while we keep hearing about the 10,000 plus baby boomers turning 65 every day, the number of Americans aged 65 to 84 is only projected to grow 21.5% this decade and then essentially stop growing after 2030.
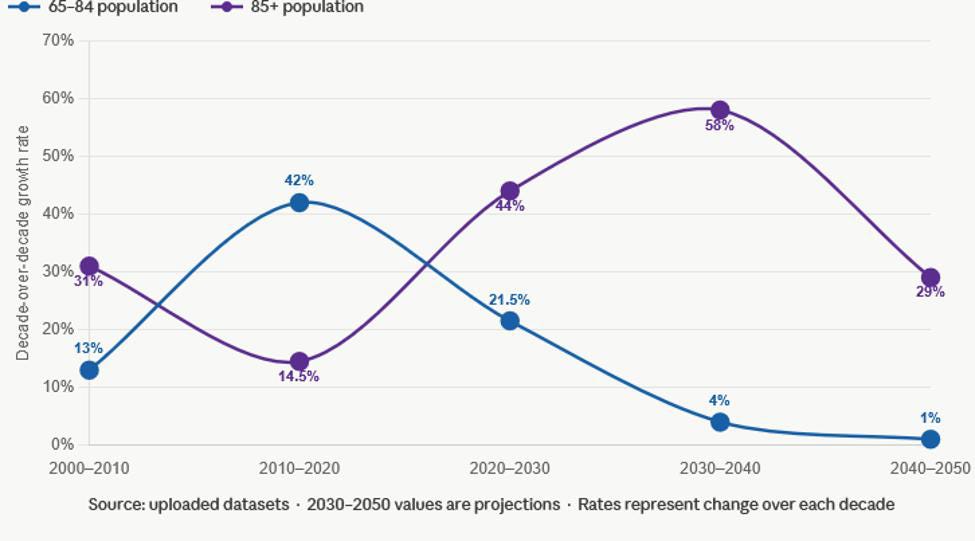
Remember, the future rates of increase of the older cohort will be on a higher base. In 2000, there were just 4.2 million Americans aged 85 and above. During the decade beginning in 2030, we will add more than this amount, approximately 5.3 million, and the following decade another 4.2 million. As a result, there will be more than four times as many of these older seniors in 2050 as there were in 2000.
Further, they’ll be older. Those of the baby boomers who age into their late 80s during the 2030s will be in their 90s during the 2040s. (These are the reasons I keep trying to ring the alarm about the coming elder care crisis.)
One more question: Why are people already talking about the dearth of college-age students and a “demographic cliff” which seems to be resulting in the closing of a lot of small colleges? Apparently, colleges and universities saw a 15% decline in enrollment between 2010 and 2021.
Yet we hit the highest number of births — a bit over 4.3 million — in 2007, exactly 50 years after the peak baby boom year of 1957. Those babies turn 19 this year, presumably in college if they choose that route.
So higher education leaders should not be explaining a decline in interest in their product on the absence of likely customers. That’s coming in the future.
No posts
Comments
Nothing yet. Say the first thing.
Sign in to join the conversation.