
This post will go through housing starts, then permits, then completions and finally units under construction. All figures m/m unless noted. SF = single-family (1 unit); MF = multi-family (5+ units). Seasonally adjusted annual rate (SAAR) basis. Note this report is subject to significant revision — the 90% confidence interval for housing starts m/m for example is ±9.5%.
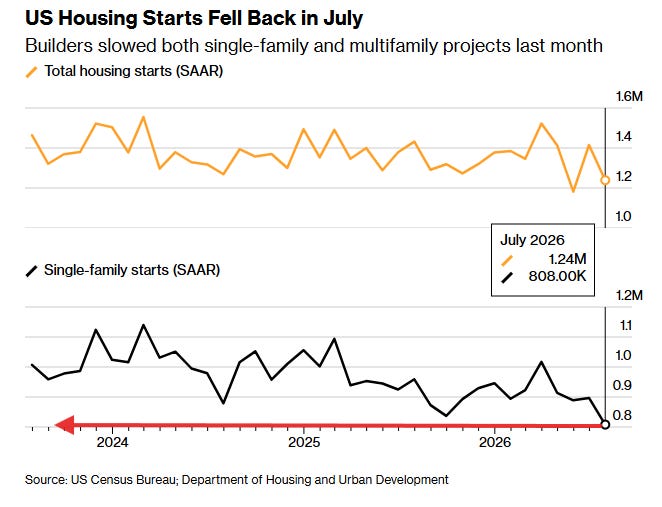
US Housing Starts Jul: 1239K (est 1345K; prev 1427K; prev R 1415K)
-Housing Starts (M/M): -12.4% (est -5.9%; prev 19.0%; prev R 18.1%)
US Building Permits Jul: 1443K (est 1406K; prev 1374K)
-Building Permits (M/M): 5.0% (est 0.6%; prev -3.0%)
Housing starts drop -12.4% in July from June (m/m) to 1.239mn SAAR — the third major monthly drop in four months and back near post-COVID lows — with the decline broad-based as SF starts slid -9.9% to 808k, the weakest since November 2022 (and second weakest since May 2020), and MF fell back -15.6% after June’s surge.
Building permits went the other way, rising +5.0% to 1.443mn, the highest since February, with SF permits climbing to a four-month high — a more hopeful leading signal.
Completions dropped -9.1% to 1.212mn, the least since May 2020, with SF completions also at their lowest since May 2020 and MF at the least since April 2022.
Looking at what’s “in the pipeline”, total units under construction edged down to 1.262mn (-0.2% m/m, -6.0% y/y), remaining just above the May level of 1.252mn, which was the least since November 2020 (but also the highest prepandemic since November 2006). It has been little changed this year, so perhaps is starting to stabilize.
Comments
Nothing yet. Say the first thing.
Sign in to join the conversation.