
US Pending Home Sales (M/M) Jul: -2.3% (est 0.0%; prev -5.4%; prev R -4.8%)
- Pending Home Sales NSA (Y/Y): -2.5% (est 1.1%; prev 2.3%; prev R 2.7%)
Existing home sales normally represent 90% of home sales in the US but fell to as low as two-thirds due to low supply (which has improved) and homebuilder incentives for new homes. They are now back to around 85% (over the past year). Pending home sales are contract signings not actual transactions so a little more forward looking. Contract signings usually lead sales by about 45 to 60 days.
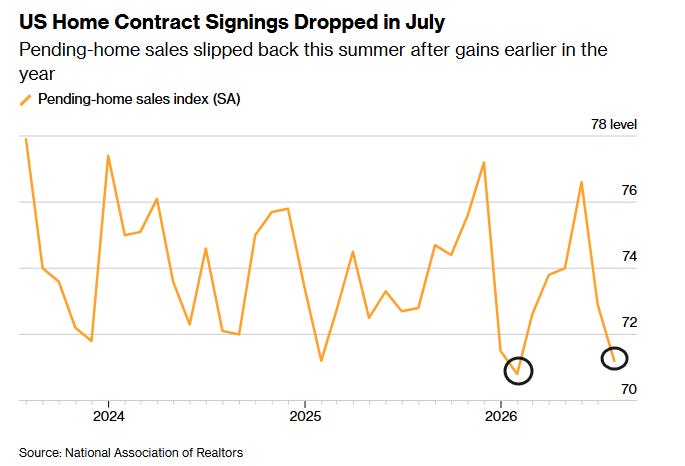
July pending home sales fell -2.3% from June (m/m), a second straight monthly which pulled the index level to 71.2, the second least on record (to 2001) after January’s 70.9, almost fully reversing the recovery seen earlier in the year. That was versus estimates for a flat read. “A reading of 100 is equal to the average level of contract activity during 2001, which was the first year to be examined.”
Contract signings fell -2.5% from July 2025 not seasonally adjusted, the biggest annual drop since April 2025 and also well under estimates of +1.1%.
The average 30-year mortgage rate according to Freddie Mac’s weekly survey rose steadily in July from 6.43% on July 2nd to 6.66% on July 30rd, the highest in a year.
All four US regions declined m/m. Y/y only the Midwest remained positive, while the Northeast, South and West all slipped into negative territory (the West down a sizable -7.1%).
Comments
Nothing yet. Say the first thing.
Sign in to join the conversation.