
I’ll start with a confession. I spent years doing data science — clustering, forecasting, prediction, all of it — on problems that were quietly, yet now looking back, obviously about place, and I had no idea GIS was a thing. Geographic Information Systems, an entire discipline with its own tools, its own decades of theory, its own community — and I had walked past it the whole time. I was doing geospatial analytics without the word for it, just doing all sorts of calculations on data sets with long and lat coordinates.
That gap — between data science, geospatial analytics, and GIS — is the thing this article ains to narrow. And if you already work with data, you are much closer to this field than you think - all you need is just a map.
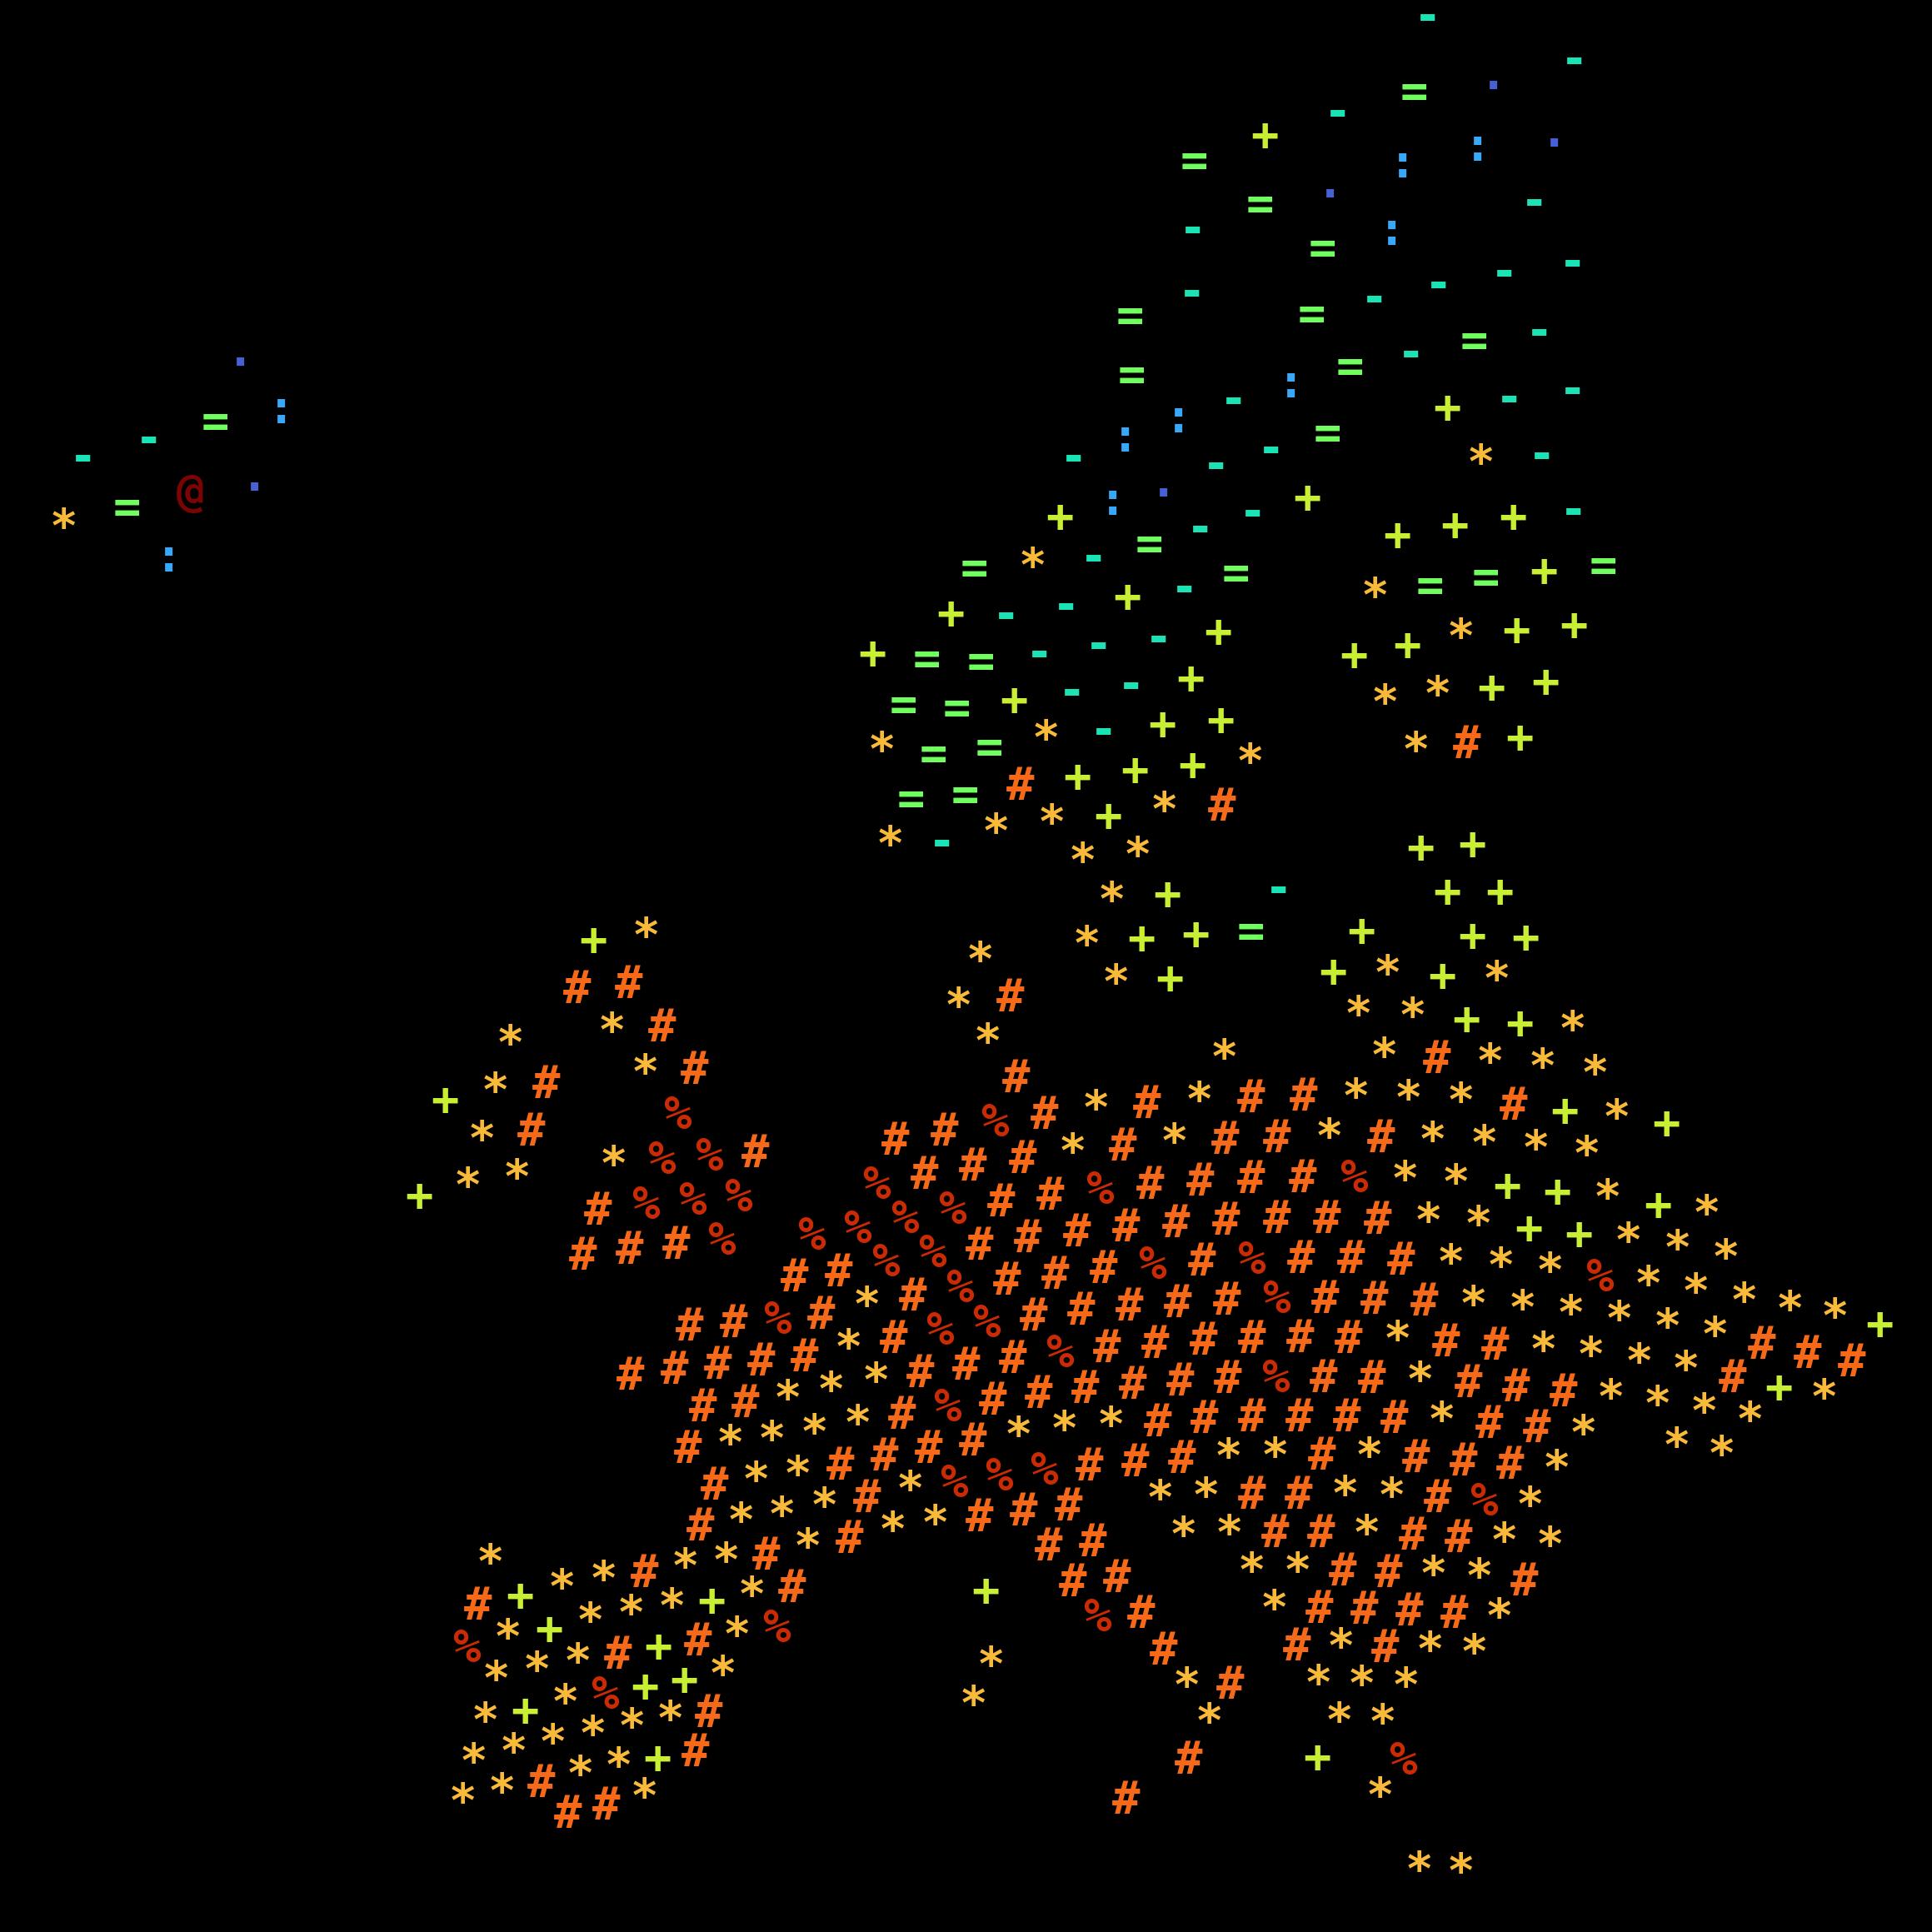
So here it comes - the map.
The one-sentence version I’d say out loud: geospatial data science is data science on maps.
Data science is the practice of deriving insight from data — and overwhelmingly, that means tabular data. Rows and columns, features and observations, each row assumed to be independent of the next. Almost every tool data scientists use quietly assumes that independence.
Spatial data breaks the assumption. Here, observations are not independent. Things that are close together are more related than things far apart. That’s Tobler’s first law of geography — “everything is related to everything else, but near things are more related than distant things” — and it’s the single biggest conceptual jump you have to make coming from ordinary data science. Once you internalize it, a lot of the field falls into place: why you can’t just shuffle rows, why “location” is a feature unlike any other, why a whole branch of statistics exists specifically for spatial data.
Everything else is downstream of that one idea.
Geospatial data science isn’t one thing — it’s a cluster of connected sub-areas. The main ones a beginner should recognize:
Urban analytics. Cities, mobility, land use, accessibility, real estate, infrastructure. This is the sub-area that’s quite literally all around us as soon as we step outside of our house, and for most people it’s the most intuitive place to start — you already have opinions about how your city works. Here you will learn how to put numbers behind.
GeoAI. Less a topic than a batch of tools — and definietly the most popular one in 2026. This toolbox covers machine learning and deep learning applied to spatial problems: detecting buildings from satellite imagery, predicting land use, segmenting terrain.
Transportation and mobility. Networks, routing, logistics, transit, flow. Anything about how people and goods move through space.
Environmental and agricultural analytics. Remote sensing, land cover, vegetation, elevation, climate - a huge amount of it powered by satellite and raster data.
Of course, these labes are not exclusive - a logistics problem is a network problem but easily can become an urban problem as well, with also significant occasional environntal imapact. The sub-areas are a way of orienting yourself, not a set of boxes you have to pick from.
The field, as a growing subfield of data science, is primarily Python-first, and the good news is that a small set of libraries covers most of the ground. The engine room you will import the most (apart from supporting powerhouse libraries running in the background, like GDal):
Shapely — the geometry engine underneath almost everything. It creates and manipulates geometric shapes, connecting tabular data to spatial units: points, lines, polygons. GeoPandas, OSMnx, and most of the stack call it under the hood.
GeoPandas — pandas, extended to hold geometry. While preserving everything Pandas can do on tabular data, it also unlocks a host of spatial operations (thanks to Shapely being nicely integrated). If you know pandas, you’re most of the way here.
rasterio — for raster data: elevation, satellite imagery, land cover, temperature. Roughly half of all spatial data is raster, and rasterio is how you read, transform, analyze, and write it.
Around that core sits a wider toolkit you'll grow into: pyproj and cartopy for projections and cartography; H3 (spatial indexing, courtesy of Uber) and libpysal / esda / spreg for spatial analysis and spatial regression; xarray and rioxarray for large multi-dimensional grids; OSMnx and networkx for street networks and graphs; and the general data-science staples — NumPy, matplotlib, scikit-learn, statsmodels, and XGBoost — that do the numerical and modeling heavy lifting. And once your data outgrows files on disk, you'll meet the spatial databases: PostGIS (the PostgreSQL extension that's long been the industry standard for storing and querying spatial data at scale), DuckDB with its spatial extension (which has quickly become a favorite for fast, local analytics on large geospatial files — including Parquet and the newer GeoParquet format), and SpatiaLite (a lightweight, serverless option that brings spatial querying to a single SQLite file). You don't learn these all at once. You reach for each one when a problem asks for it.
Here’s the thing people get wrong, and I made the same mistake: they overvalue the topic.
The instinct, especially if you’re trying to break into the industry, is to hunt for the one golden domain - urban green coverage, forestry, precision agriculture - that will be your ticket in. As if there’s a single right direction and your job is to guess it.
The truth is you rarely land on the direction you planned, no matter how carefully you choose. So my advice runs the other way: don’t chase a hypothetical business need. Follow your own passion. When you work on something you actually care about, you unlock a level of creativity you simply can’t fake — and that creativity is what makes your work good enough to notice and speak for itself.
So pick a problem you like. If you ride a bike, look at cycling infrastructure. If your parcels are always late, dig into logistics. If you hike, go pull GPS tracks, elevation data, terrain models, and ask a question about the mountains you actually climb. Take the thing you love, and turn it into data. That’s the real starting move - not finding the “right” topic, but making your topic spatial. And if you need some inspiration, just have a look at the annual mapping challenge,the #30DayMapChallenge and all the different types of spatial and mapping exercises people publish in there.
As in most tech-related domains today, we could just say AI and stop right there.
However, one specific example (of course, using AI) excites me more than any other right now: we are genuinely close to a complete global model of the built environment.
Projects like Overture Maps, OpenStreetMap, and the Global Building Atlas are each, in their own way, trying to map every single building on Earth — using increasingly sophisticated tools to extract footprints from imagery at planetary scale. They don’t fully agree with each other yet. But they’re converging, and in a few years, when they align closely enough, we’ll have something we’ve never had: a complete, open, global repository of the built environment. A little more on this on YT:
That unlocks a lot — global digital twins, city-scale planning and simulation, the ability to understand how urban systems actually work, anywhere, from the same data foundation. It’s one of the clearest signals of where this field is going, and it’s worth watching even as a beginner.
Everyone is using AI to write code now, and the specific tools will probably look completely different a year from now. Which raises a fair question: if the machine writes the code, what exactly are you learning?
My answer: you’re learning enough of the fundamentals to guide and interrogate the machine. This holds for most software related projects and jobs these days - however, the importance of interrogation is particularly curcial for spatial data, since as of know, LLMs can’t comprehend that. They are great in capturing linear logic, such as text, or even tablar data, but Tobler’s law is still a though one - thats where spatial human intelligence is needed. And can’t be spared.
So my absolute must-have recommendation is to spend a few hours — genuinely, properly — on the core concepts. Coordinate reference systems and projections. The difference between vector and raster. How geometry works. This is the foundational layer that lets you tell when an agent has quietly done something wrong, chosen the wrong CRS, mangled a projection, or produced a beautiful map that’s subtly meaningless. Same with programming: nobody spends months mastering Python from scratch anymore, but you still need enough of the core logic to know where things could possibly wrong and how to steer the tool that’s doing the typing.
That’s the durable skill. Not running the tool — knowing the field well enough to direct it, question it, and interpret what comes back. The value is moving up from tool-runner to decision-level interpreter. AI makes that shift more important, not less.
Think of learning this as a journey — a route from where you are now to where you want to be, which for most people is a real project or model they need to build. You don’t learn everything. You learn the path between two points.
Here’s the order I’d recommend.
0. Learn how to think spatially - right here!
1. Get yout Python ready - jut the basics, probably even your favourite AI agent sitting on coding duty. The quickest way is my dedicated course.
2. Get the fundamentals down — first, and properly. A few focused hours on CRS, projections, vector vs. raster, and basic geometry. Everything else rests on this. A good free starting point is my three YouTube walkthroughs, each built on real OpenStreetMap and LiDAR data, one per core library:
Shapely — Top 10 Shapely Operations in Python (geometry, on the Eiffel Tower footprint)
GeoPandas — 10 GeoPandas Operations Every GIS Analyst Should Know (everyday vector GIS, on Edinburgh layers)
rasterio — Top 10 Rasterio Operations in Python (the full raster workflow, on Edinburgh LiDAR)
Do these three and you’ve touched the engine of the entire stack.
3. Pick your passion problem and make it spatial. Following the earlier advice — bikes, logistics, hiking, whatever it is. Turn it into a dataset and a question.
4. Go deeper where your problem demands it. This is where structured learning pays off. My courses cover urban analytics, GeoAI, and network science end-to-end, and my books work well as a reference spine alongside them — but the honest principle is: learn the sub-area your project needs, not all of them.
For genuinely open resources worth leaning on: OpenStreetMap and Overture Maps for free global data, and QGIS if you want a full-featured desktop GIS to see your data without writing code. Pair those with the free tutorials above and you can get a surprising distance before spending anything. However, an important disclaier: I have been building geospatial solutions for many years now - and never in my life directly useg QGIS ir ArcGIS. This may be the Physicsit in me, preferring things to build from first principles with lots of flexibility and transparecny, but never had any drawbacks because of this.
5. Build one real thing. The best first project is the passion problem from step two, taken all the way to a map or a model that answers a question you actually care about. One finished project teaches more than ten tutorials.
If you’re not sure which route is yours — where you are, where you want to be, and the path between — that’s exactly what I built the Learning Journey Planner on The New Science of Maps for. Tell it where you’re starting and where you want to go, and it maps the steps.
But if you take only one thing from this article, take this: you’re closer than you think. You don’t need permission or a perfect topic. Pick a problem you love, unlock is spatial component and start.
No posts
Comments
Nothing yet. Say the first thing.
Sign in to join the conversation.