
Two complete chapters from The New Science of Maps, free on Gumroad. Every cell, every output, readable in your browser with nothing to install.
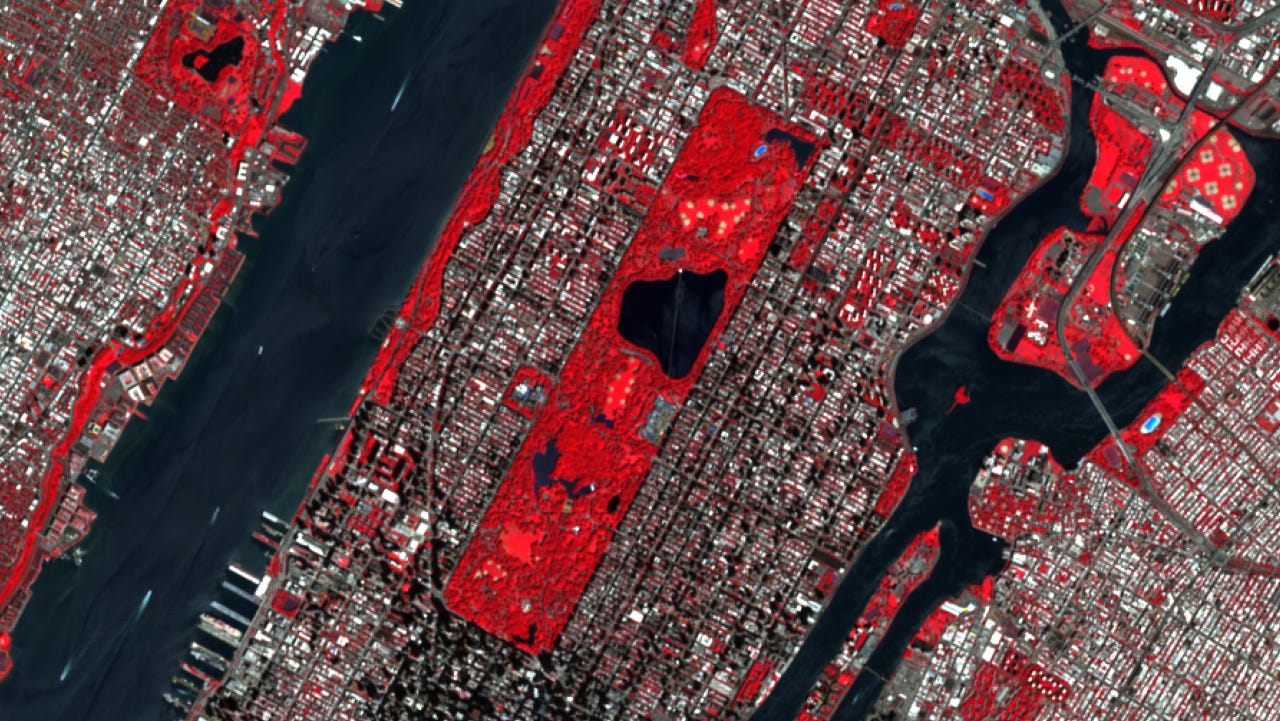
How much green space does each New Yorker get?
Not how green the city looks from above — how much there is per person, and where. NDVI summarised over neighbourhoods and H3 hexagons at two resolutions, giving three different answers: the modifiable areal unit problem in one picture. Plus population from the global GHSL grid, and zonal statistics turning pixels into green square metres per resident.
https://janosovm.gumroad.com/l/qsxaom?layout=profile
Ten indicators, five dimensions, twenty-three districts, one score
The final chapter of Urban Analytics with Python. Ten OpenStreetMap KPIs into a single livability index — including the two choices that decide your ranking more than your data does: normalisation and weighting. Ends with the choropleth and a sensitivity check.
https://janosovm.gumroad.com/l/erlbix?layout=profile
— Milan
No posts
Comments
Nothing yet. Say the first thing.
Sign in to join the conversation.