
Wall Street has spent six months trapped in a debate that sounds sophisticated and is, in truth, a confession of ignorance: are we in 1997 or 1999? The 1997 camp — Dan Niles, the strategists at Goldman — points to real earnings and an infrastructure buildout in its early innings. The 1999 camp — Julian Emanuel, and Michael Hartnett, who has already christened this the biggest bubble since the nineteenth-century railways — points to a Shiller P/E above 40, record concentration, and Uber drivers talking about tech stocks again. Both camps share an assumption nobody examines — that the market is a narrative, and the investor’s task is to guess which chapter we are in.
It is the wrong question, because it treats the future as unknowable opinion. Part of the future, it turns out, is neither unknowable nor opinion. Part of it has already happened.
We speak of “the market” as if it were a single crowd with a single mood. It is not. It is a superposition of tribes that barely acknowledge each other’s existence. Metal traders in Shanghai and Chicago, pricing the physical pulse of the industrial economy one shipment at a time. Equity managers in New York, benchmarked to an index and terrified of tracking error. Bitcoin natives who have never opened a Bloomberg terminal and treat four-year winters as a rite of passage.
Different instruments, different superstitions, one thing in common — and it sits upstream of all of them: the tide of global liquidity. When money is abundant, every one of these crowds eventually says yes to risk. When it drains, they all eventually say no. The word doing the work in both sentences is eventually.
So run a deliberately simple experiment. Take one driver — global liquidity — lag it, and ask each asset a single question: how much of your annual return does the tide explain, and with what delay? The S&P 500, the Nasdaq, copper, Bitcoin. One driver, one lag per asset, nothing shared between the fits.
The answer to the first half of the question is honest and unglamorous: liquidity explains a meaningful minority of each asset’s variance — enough to matter, nowhere near enough to flatter anyone’s ego. The fits survive out-of-sample backtesting on data they never saw; the one that didn’t, we benched and moved on. This is a tide, not a trading system. The waves — wars, panics, technological miracles — dominate any individual month. But the tide does not go away, and the sailor who navigates by watching only the waves eventually runs aground.
The answer to the second half of the question is the edge, and it deserves to be stated slowly.
Each asset listens to the same tide with a different delay. Bitcoin hears liquidity within a quarter. The Nasdaq, within three. Copper and the S&P take more than a year to fully digest what the tide has already done. Which means the dotted lines on these charts are not prophecy in the usual sense. The liquidity that drives them has, to a large extent, already happened. The forecast is mostly the arithmetic of delay: the future of these charts is, in a precise sense, already in the past.
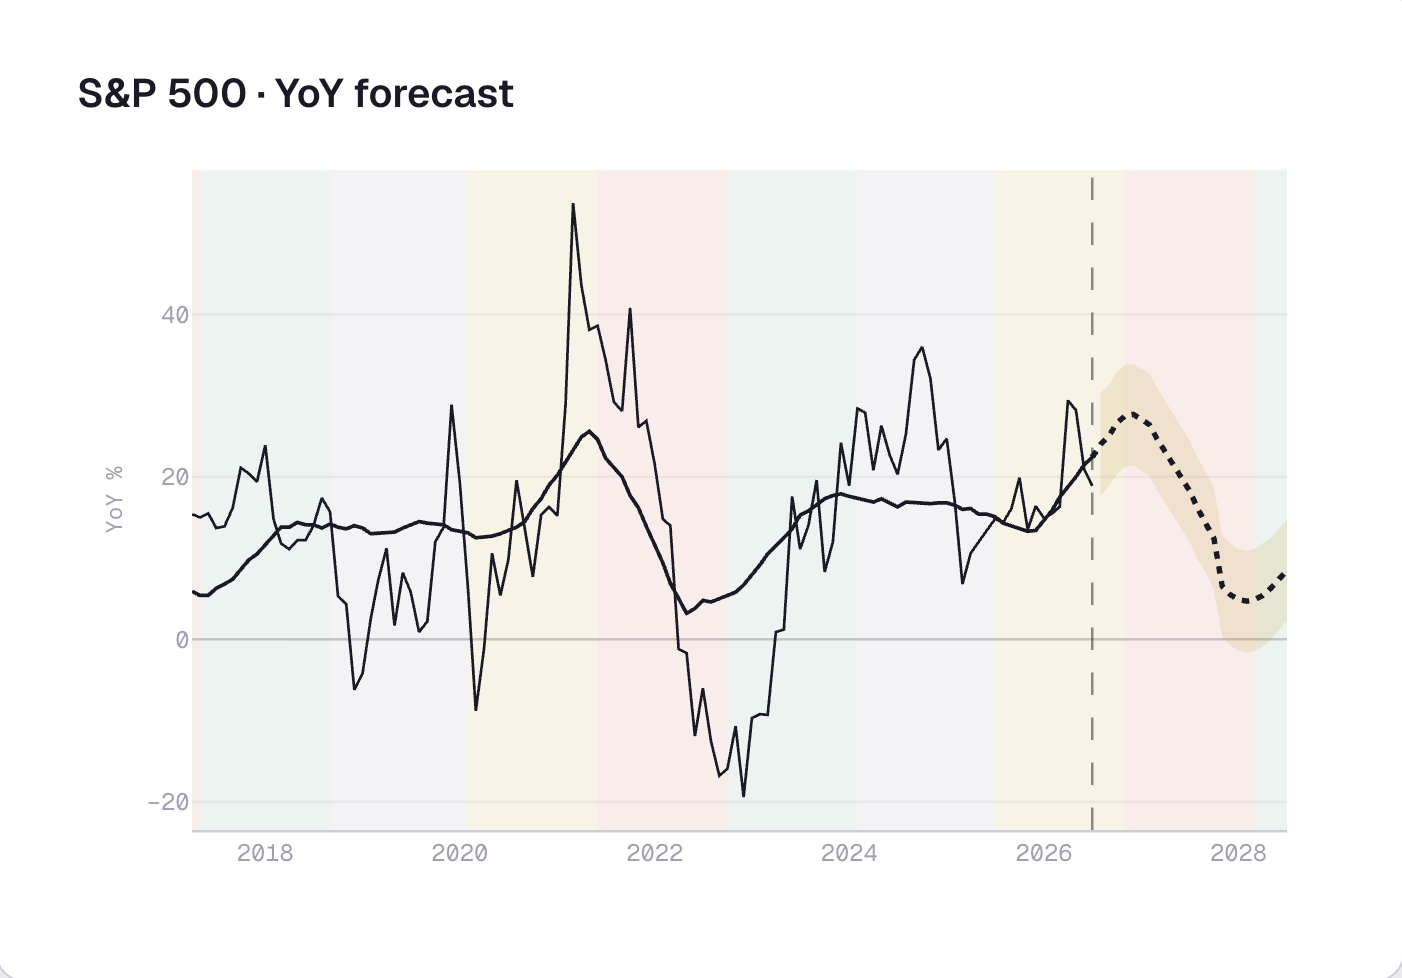
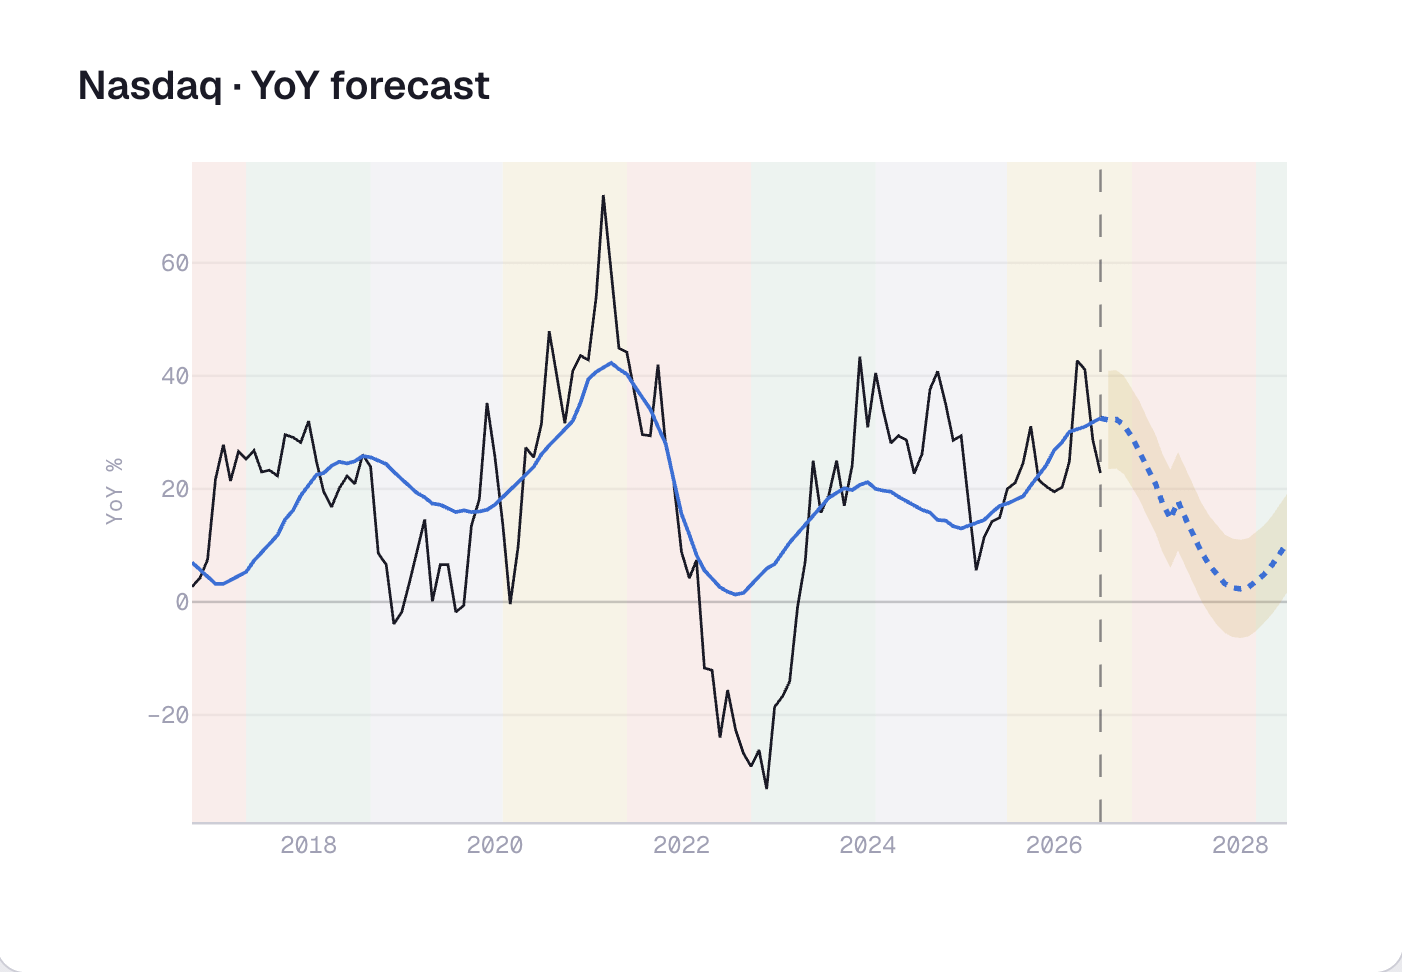
Sit with what that implies. Markets are ruthlessly efficient at discounting news — an earnings surprise is repriced in milliseconds. They are remarkably lazy at discounting transmission — the slow propagation of a liquidity impulse through four asset classes at four different speeds. There is no desk on Wall Street whose job is to trade the fact that copper is still digesting money printed fifteen months ago. The edge is not a secret model. It is patience with arithmetic that everyone else finds too slow to be interesting.
And right now, the arithmetic says something specific: four clocks, fitted independently, validated independently, project the same silhouette — momentum cresting as 2026 closes, a digestion through 2027, a trough near the turn of 2028, and a new expansion beyond it. Not a crash forecast. An exhale, with a date range.
If the transmission framework is right, it makes a prediction about order: the fast assets should confirm the tide first, the slow assets last. Bitcoin, the hare, should be running. Copper, the tortoise, should still be lacing its shoes.
The charts show the opposite — and this inversion is the single most interesting fact on the board.
Copper, the slowest listener, has already confirmed: its annual return is running near forty percent, the physical economy pricing the electrical buildout invoice by invoice, and its wave still points higher into late 2026. Meanwhile Bitcoin, the fastest listener — the asset that should have heard the tide three quarters ago — sits with a year-over-year return slightly below zero, dragging beneath a wave that projects annual returns in the hundreds of percent by year-end. The tortoise is reporting news the hare claims not to have heard.
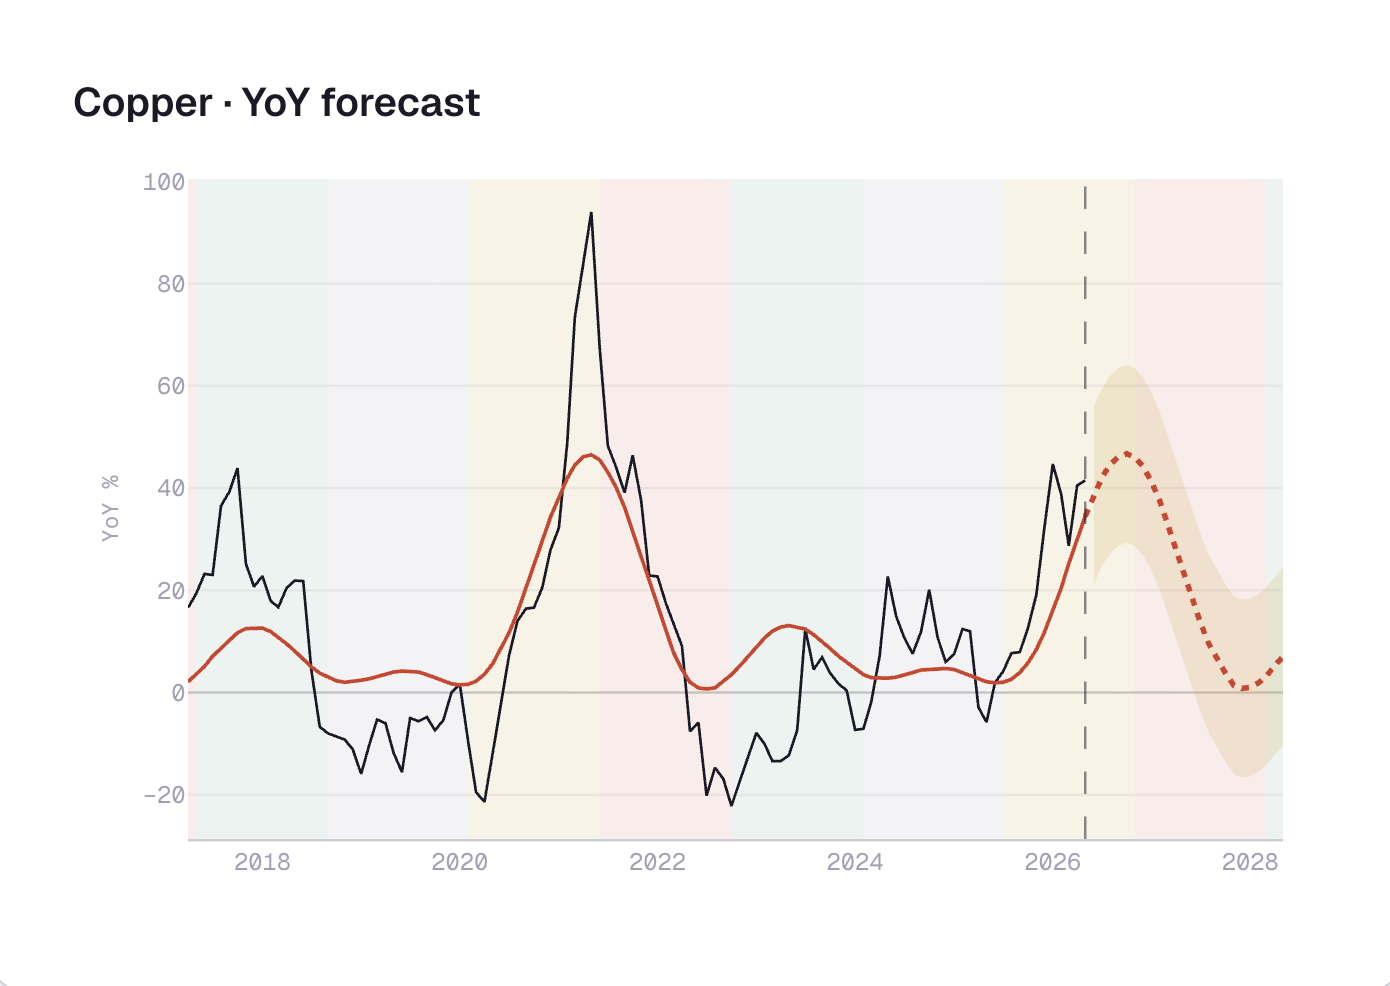
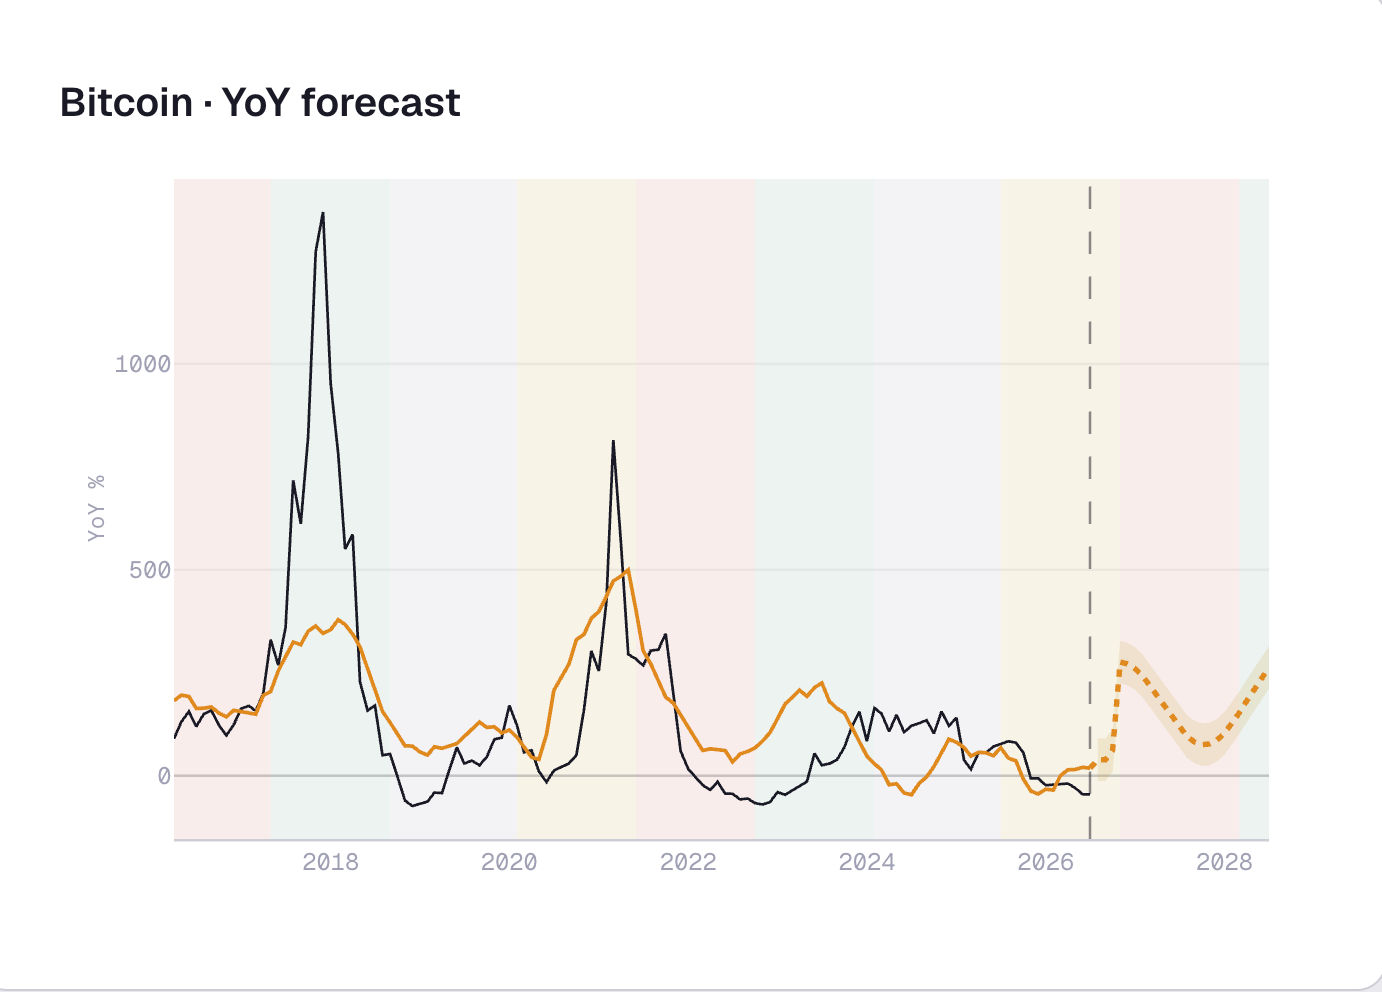
When the natural order of transmission inverts like this, only two readings are possible, and it pays to state them coldly. Either the clock broke — Bitcoin matured, the ETFs dampened its cycle, the four-year wave is a statistical fossil — or the clock is intact and the asset is late: a compressed spring, with the most liquidity-sensitive instrument on the board yet to price a tide the slowest one is already confirming at forty percent a year. You do not need to choose with certainty. You need to assign probabilities and name the evidence that would move them: if equities and copper keep rising through the second half of 2026 and Bitcoin still does not respond, the fossil reading wins. If it responds, the asymmetry is the largest available — compressed springs do not decompress in a straight line.
If the tide is still rising, why is the market so anxious? Because anxiety lives at the wave level, and the two waves currently frightening the tape are both identifiable — and both misread.
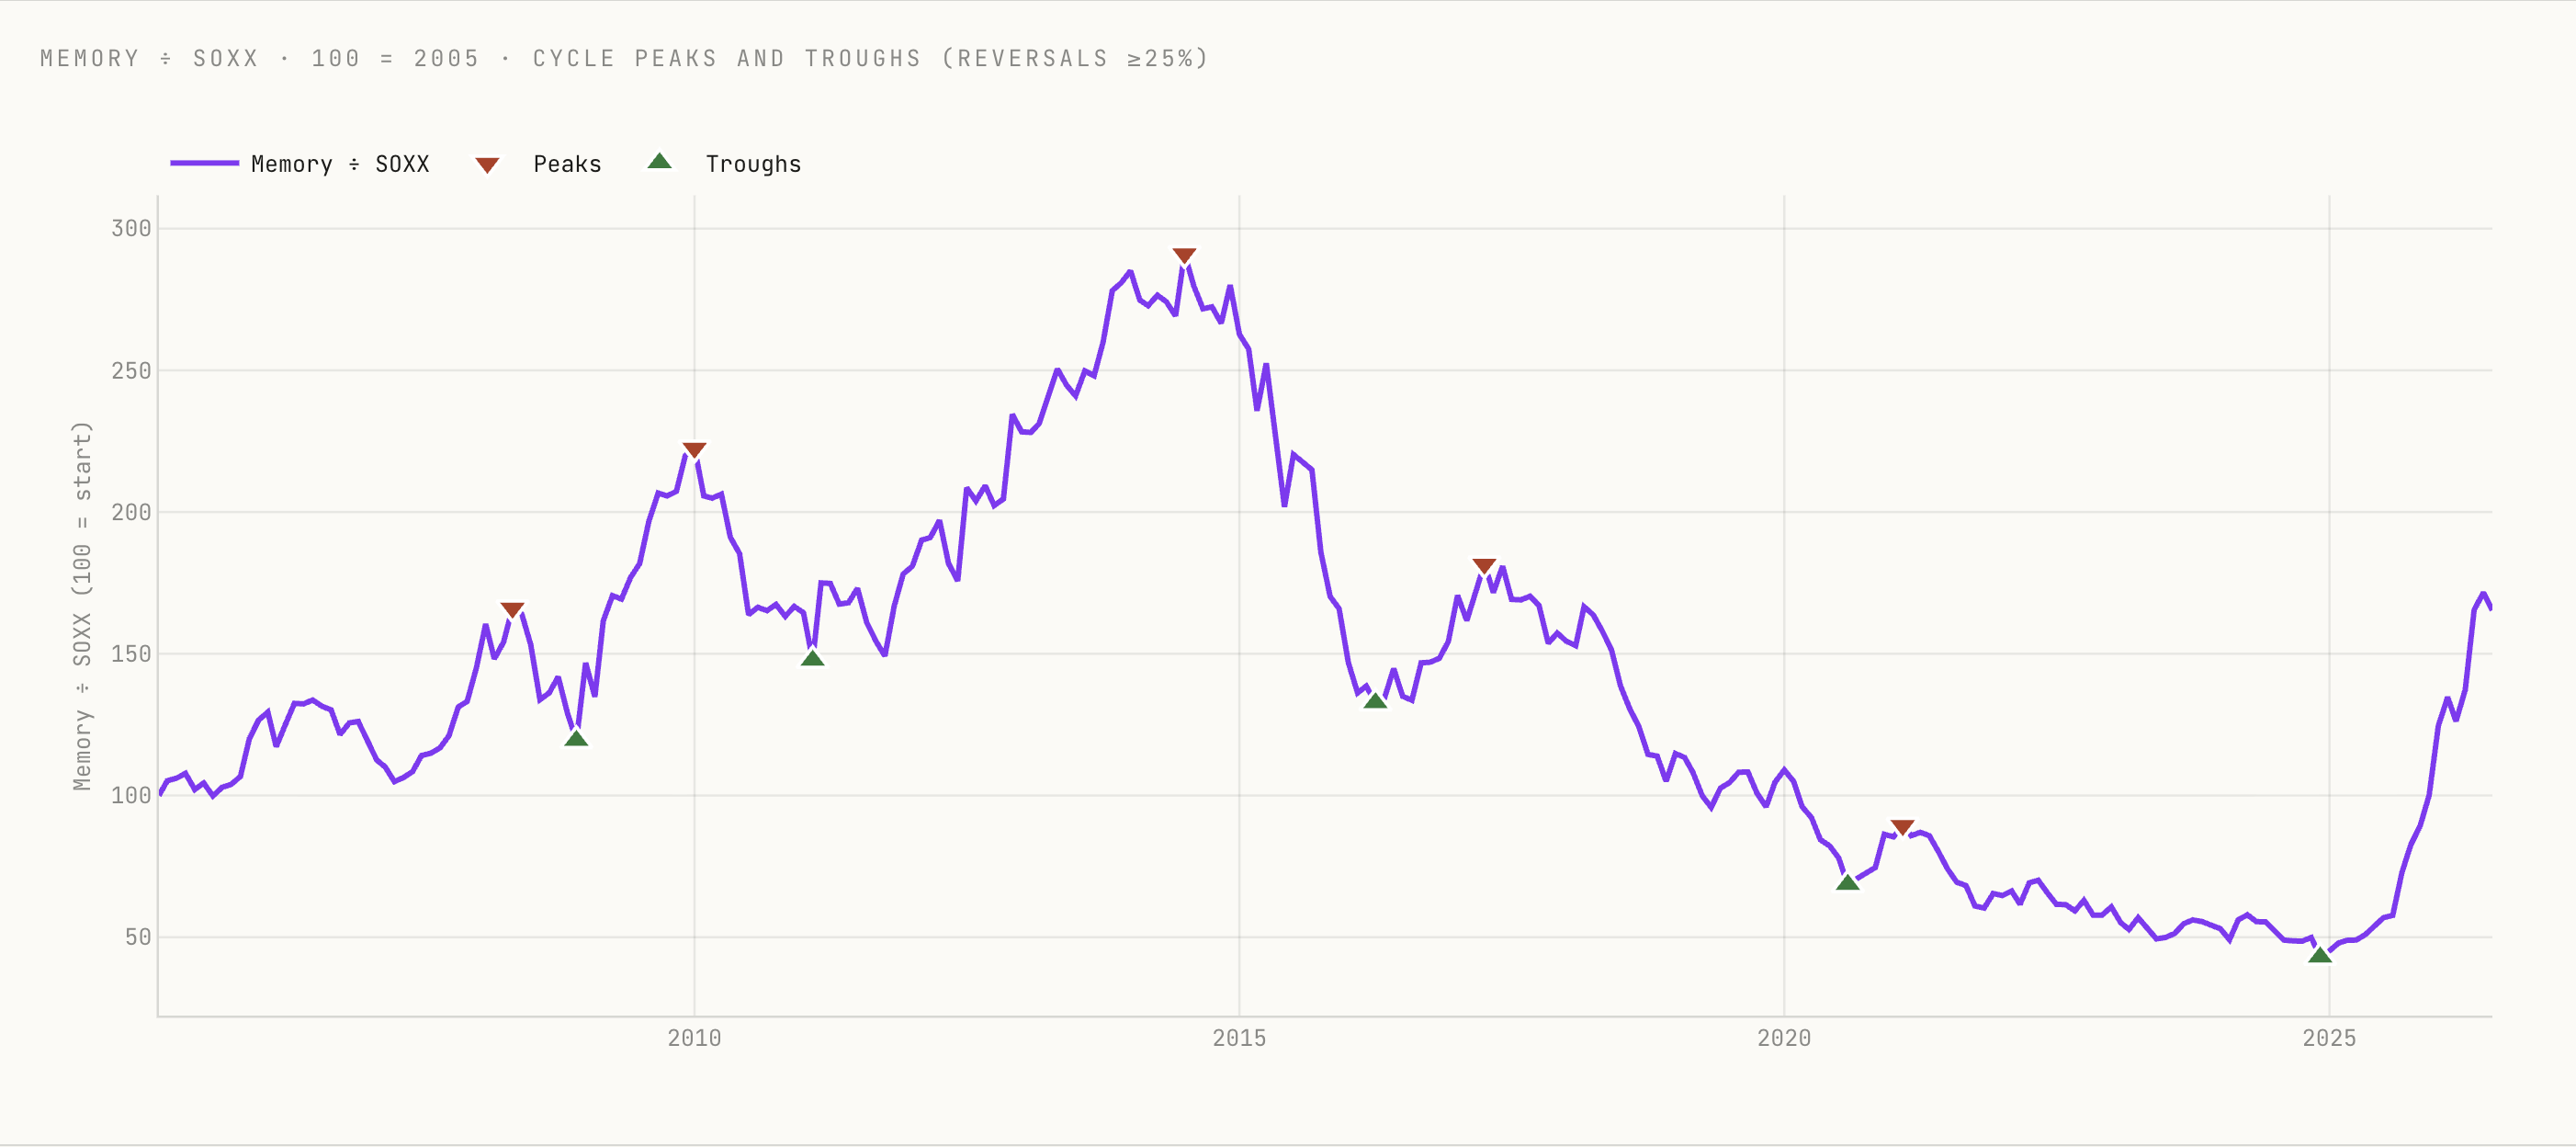
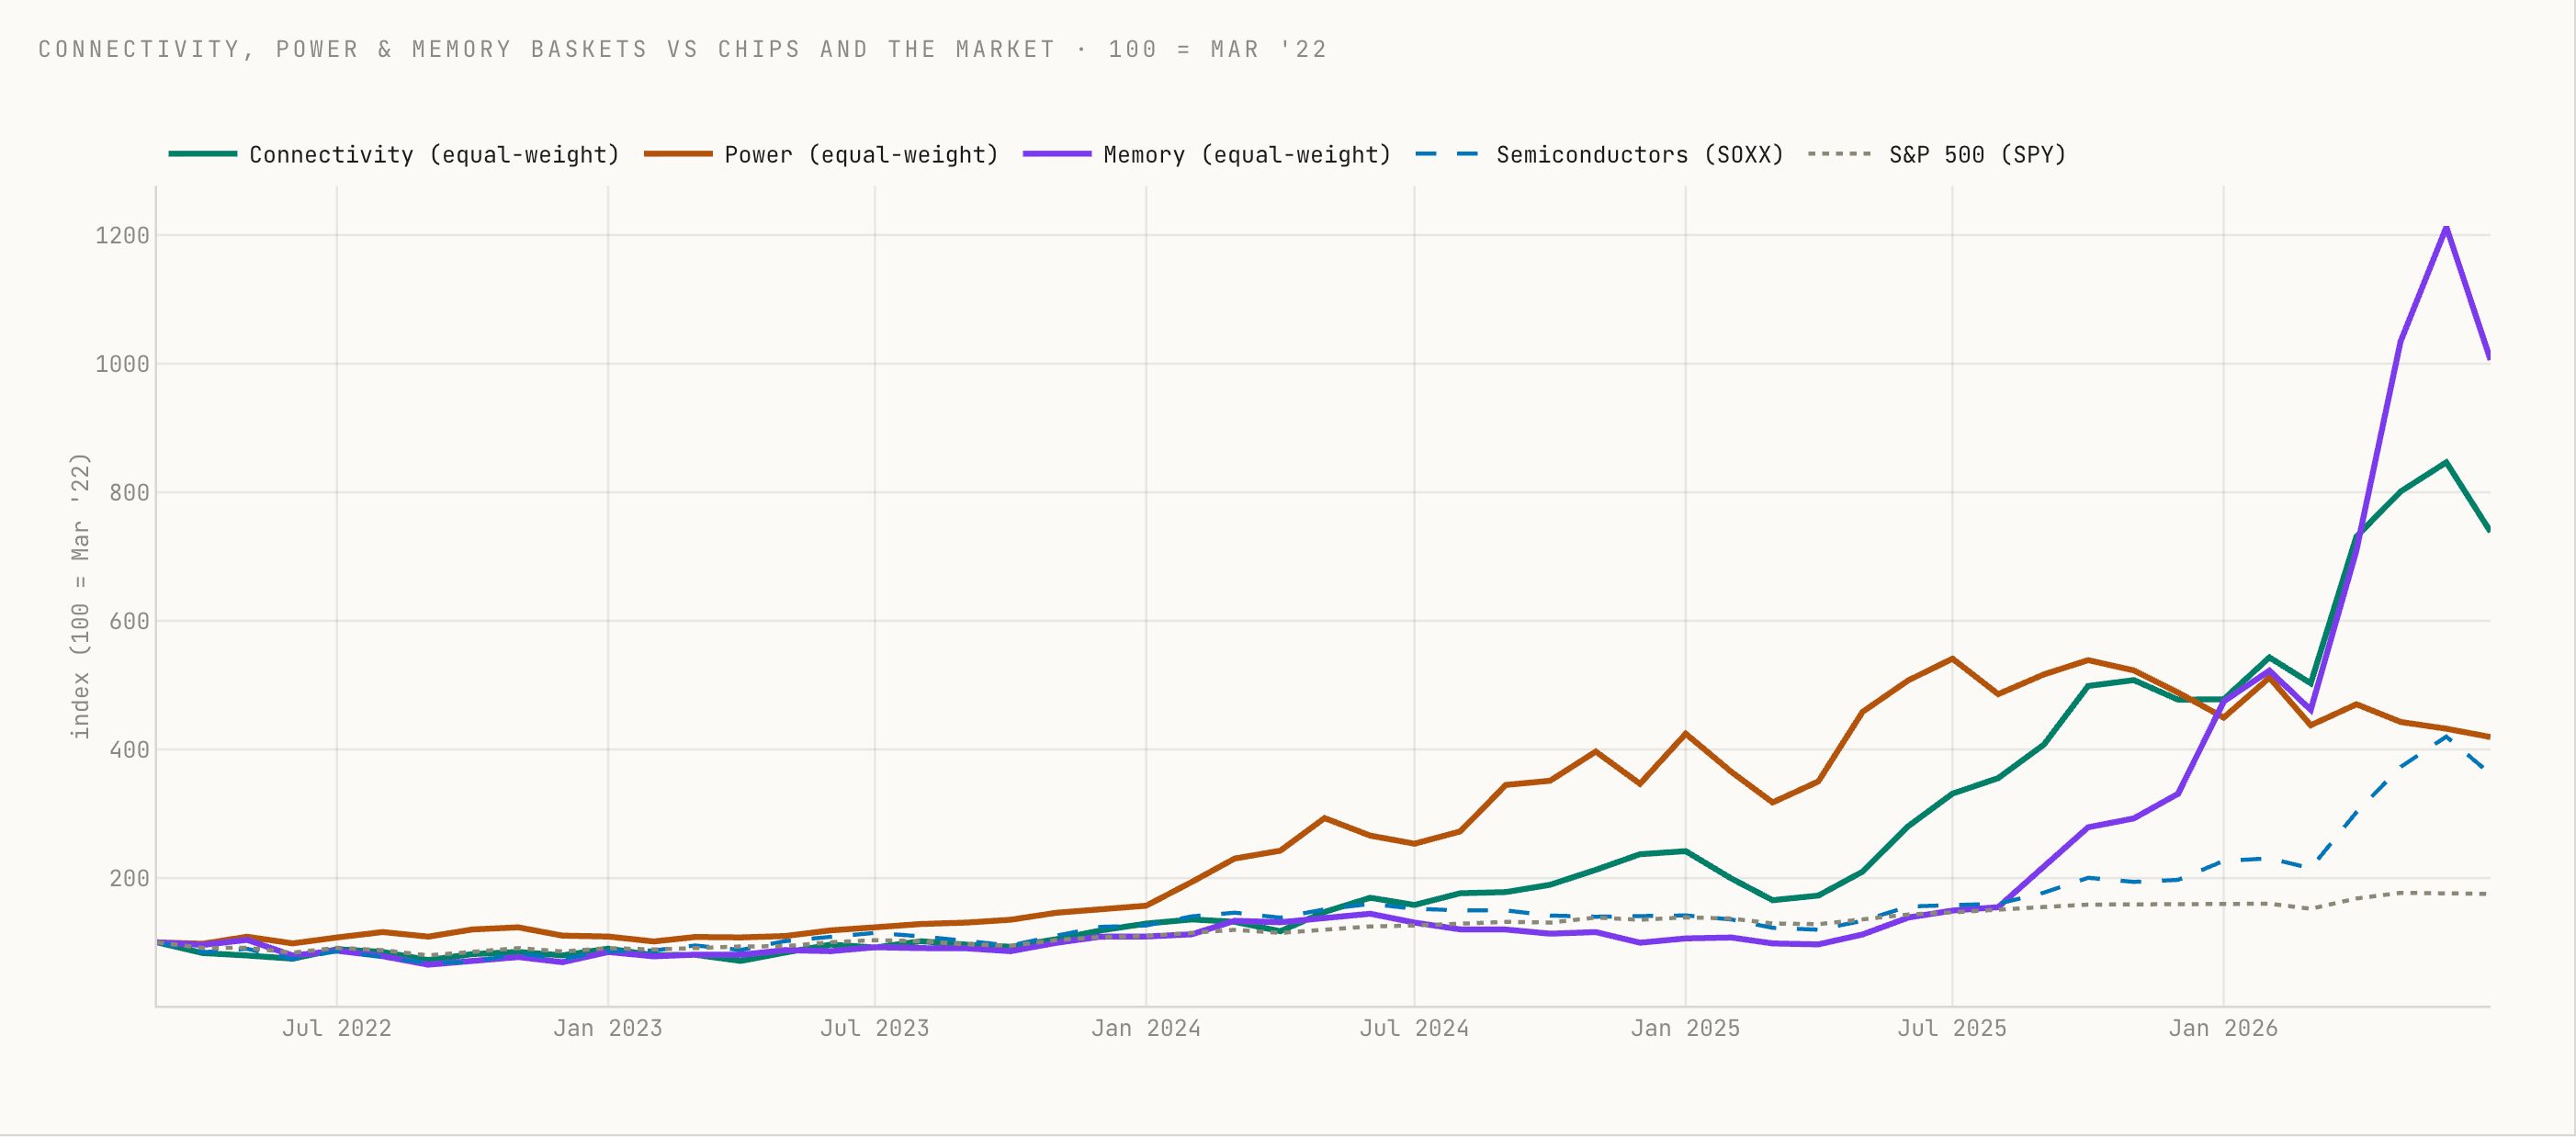
The first is memory. Inside the semiconductor complex, memory is the most cyclical tissue: the commodity end of the business, where capacity arrives in discrete billion-dollar slabs and pricing swings from famine to glut with industrial regularity. Measure memory stocks against the broader semiconductor index and the ratio has gone vertical — from a twenty-year low in early 2025 to levels seen only at the crests of previous memory manias: 2008, 2010, 2014, 2017. Every prior spike of this magnitude ended with a reversal of at least a quarter of its value. The AI trade’s internals tell the same story from another angle: the connectivity names that led, up eightfold since 2022, have begun to stumble; the power complex crested a year ago and has given back a fifth. The market is not questioning the buildout. It is questioning the price of its hottest components — which is what late-phase leadership always looks like from the inside.
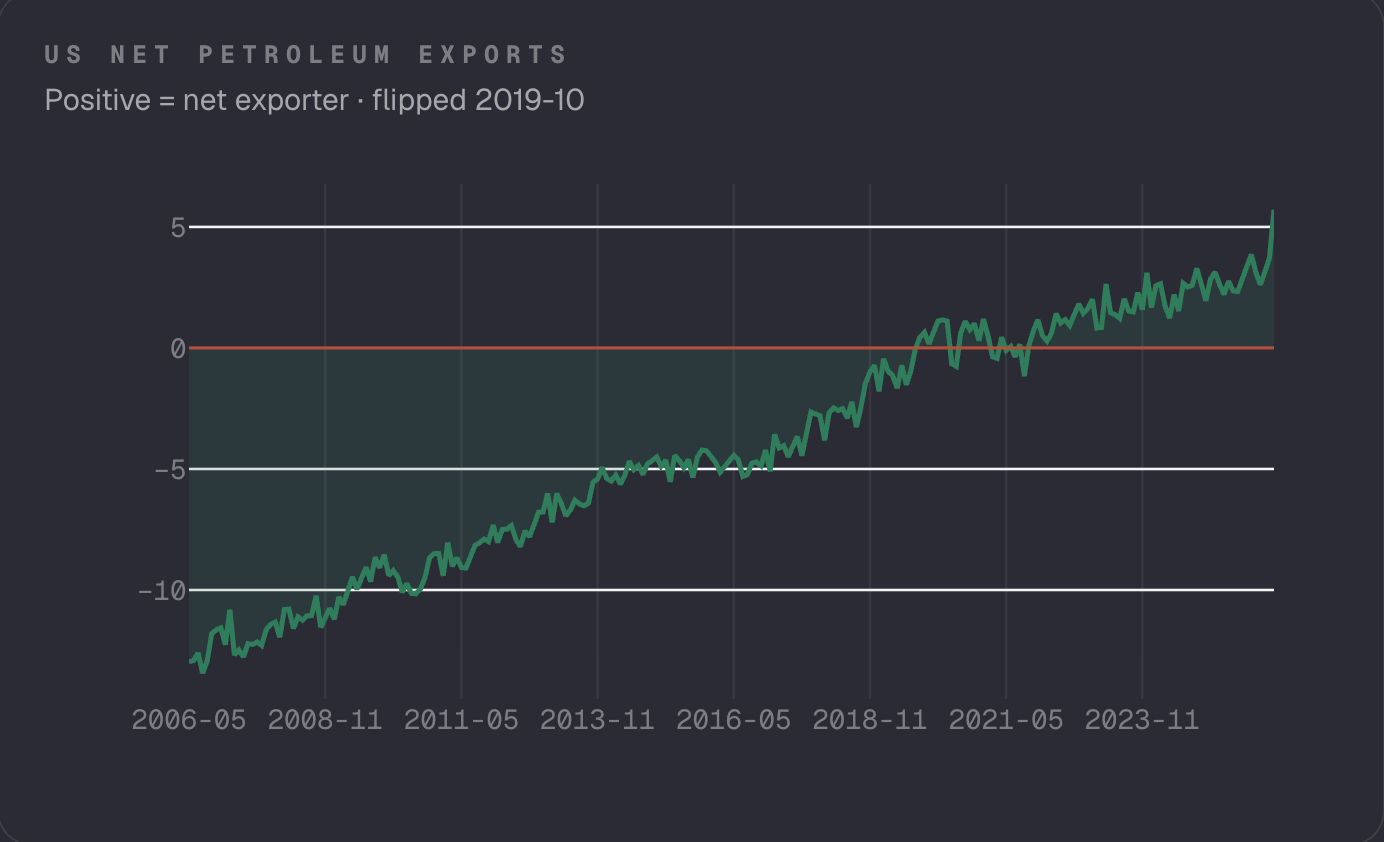
The second is conflict, and the oil spike that every portfolio manager over fifty instinctively reads through 1973: energy shock, inflation, recession, repeat. But the structure under that reflex has quietly inverted. The United States flipped to net petroleum exporter in October 2019 and now exports at record levels. An oil spike is no longer a tax on the American economy; it is a transfer within it — from consumers to producers, from the coasts to the Permian. It stings the CPI and fattens the capex pipeline simultaneously. Conflict is not benign. But the 1973 playbook is obsolete, and the recessionary transmission everyone fears is weaker than the one they remember.
Here is where the two waves cross, and where the mood becomes a mechanism. Memory and electricity sit at opposite ends of one variable: the speed of supply response. Memory is a spot market — capacity arrives in quarters, gluts correct themselves, every price spike carries the seed of its own reversal. Electrical capacity is a decade-long queue: turbines back-ordered for years, transformers scarce, permits glacial, copper mines that take longer to build than the datacenters they will feed. The market is currently punishing both with the same nervousness — de-rating the power complex a fifth from its highs as if grid scarcity could resolve as fast as a chip glut. It cannot. One of these corrections is self-fixing. The other is self-deepening: every month of buildout adds demand against a supply curve that physically cannot answer. Nervousness in silicon, opportunity in electrons — not as a slogan, but as an asymmetry of supply response that the tape is mispricing in real time.
One discipline separates analysis from folklore: speculative phases do not end through narrative exhaustion. They end through monetary murder. In 2000 it was Greenspan raising rates into an overheating economy. In 2022 it was Powell correcting, late and violently, the inflationary error of 2021. And in 2026 the weapon is already drawn: a Federal Reserve under Kevin Warsh, a declared hawk, with markets pricing hikes into year-end, while the largest technology companies tap the debt markets to finance hundreds of billions in datacenters. An infrastructure buildout funded on credit, colliding with a tightening central bank — that is, with historical precision, the recipe by which crests become troughs. Note what this does not say. It does not say AI is vapor; the railway wasn’t either, and it still bankrupted two generations of speculators before transforming the economy. It says the current phase has a recognizable shape, an identified executioner, and a digestion window that four independent clocks place in the same stretch of the calendar.
A cycle that explains a fraction of the variance is not a prophecy. It is a prior. And priors are good for one thing: changing behavior in the face of evidence. If the prior is right, the strategy for this phase is neither abstinence nor euphoria — it is participation with an exit protocol: exposure to the steepest stretch of the rally, the one the clocks say is now, with reduction rules written in advance, in cold blood, before the down-wave writes them for us. The investor who survived 1999 was not the one who guessed the top; it was the one who decided beforehand which signals would take him out, and obeyed them when they arrived.
But end with the deeper question: why should any of this work? Why would an edge this simple — four public charts, one lag, arithmetic — survive in the most competitive market in history?
Because of the very fact we began with. The market is a superposition of tribes, and the tribes do not read each other’s charts. The metal trader confirming the tide at forty percent a year has never looked at a Bitcoin chart in his life. The Bitcoin native waiting for a catalyst does not know what a transformer backlog is. The equity manager watching memory stocks go vertical has no idea the tortoise and the hare are running the same race. Each tribe prices its own instrument efficiently and the transmission between them not at all — because transmission is nobody’s benchmark, nobody’s mandate, nobody’s bonus.
The edge, in the end, is not a model. It is a chair: the one seat in the room from which all four clocks are visible at once. Sit in it, write the exit rules, and let the arithmetic of delay do what it has quietly done for decades.
Risk is not volatility. It is the atrophy of learning.
Thanks for reading ,
G
No posts
Comments
Nothing yet. Say the first thing.
Sign in to join the conversation.