
We spend hours researching, and talking to the smartest founders, dealmakers and investors in the SPAC landscape. This is our attempt to give you a short 5-10 minute summary on how we are thinking about the macro, markets & SPACs, and what lies ahead. Hundreds of hours summarized, so you don’t have to.
Visit our website at Welsbach Group to learn more about our services and expertise.
U.S. equities finished the period near record highs, recovering from the early-June selloff as easing Middle East tensions pushed oil sharply lower and improved investor sentiment.
The June 17 FOMC kept rates unchanged but adopted a more hawkish stance, lifting rate expectations for 2026. However, a weaker-than-expected July payrolls report, coupled with downward revisions to prior months, reduced expectations of a near-term rate hike.
The Dow closed above 53,000 for the first time, capping the strongest quarterly performance for U.S. equities since 2020, although a late-June semiconductor pullback left the Nasdaq below its peak. Attention now turns to the July CPI release, Q2 earnings season, and the July FOMC meeting.
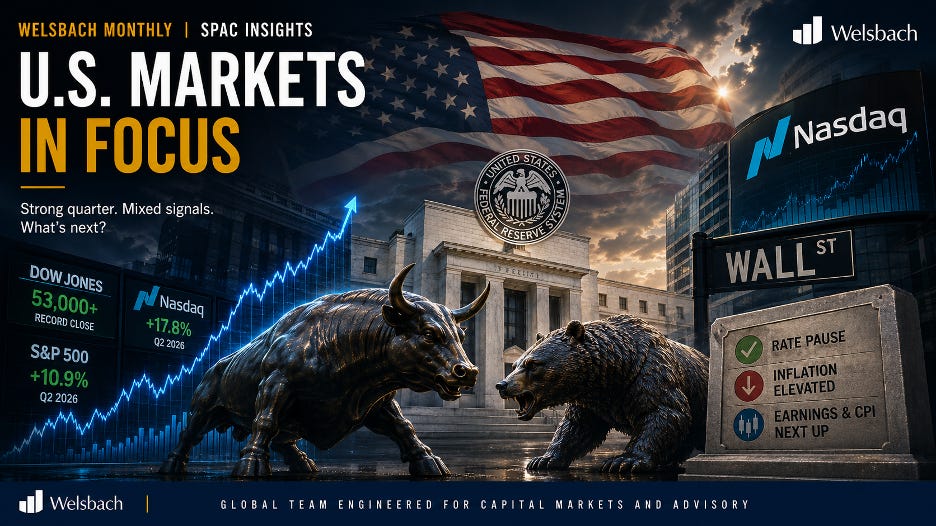
The US–Iran framework ended the oil shock and the single largest driver of the inflation surge: The June 14 ceasefire extension and reopening of the Strait of Hormuz sent oil prices to three-month lows, easing one of the biggest drivers of inflation. Lower energy prices improved the inflation outlook, giving the Fed greater flexibility to keep rates on hold while reducing the risk of a prolonged supply shock
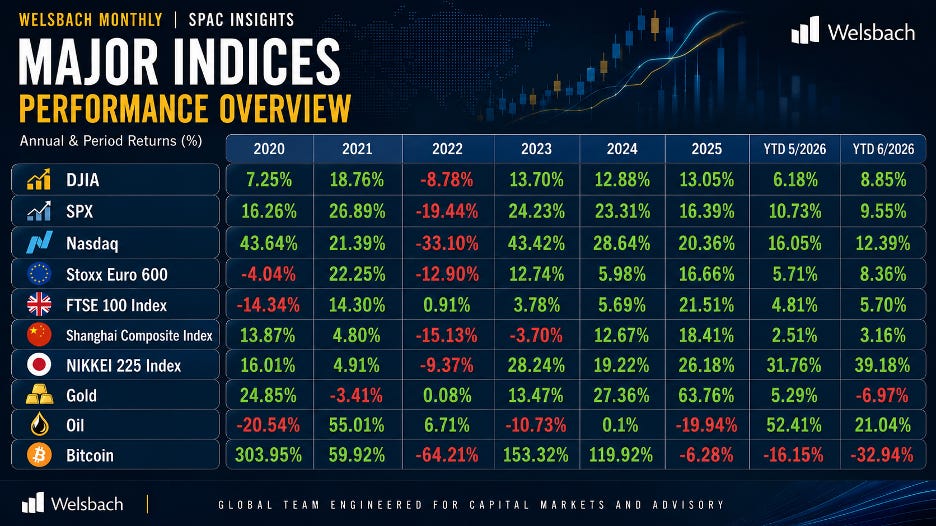
Best quarter since 2020, a Dow record above 53,000, and a broadening rally: Q2 marked the strongest quarter for U.S. equities since 2020, with the S&P 500, Nasdaq, and Dow posting double-digit gains. The Dow closed above 53,000 for the first time, while market leadership broadened beyond mega-cap technology, with small caps delivering their best first half since 1991
Soft June payrolls took near-term rate hikes off the table: A weaker-than-expected June payrolls report eased fears of further Fed tightening, reducing rate hike expectations and pushing Treasury yields and the U.S. dollar lower. Markets viewed the softer labor data as supportive for risk assets rather than a sign of slowing growth
The IPO window is wide open: SpaceX raised $85.7 billion in the largest listing in history: U.S. capital markets remained exceptionally strong, led by SpaceX’s funding round and record first-half IPO activity on Nasdaq. Robust issuance and continued investor demand reinforced confidence that the equity capital markets recovery remains firmly intact heading into the second half of the year
Inflation is running at multi-year highs and it is no longer just energy: Inflation remained elevated, with May CPI rising to a three-year high and core PCE reaching its highest level since late 2023. While lower oil prices may ease headline inflation, persistent core inflation continues to complicate the Fed’s path toward easing
The Warsh Fed delivered the most hawkish pivot in years and abolished forward guidance: The June FOMC meeting struck a more hawkish tone, with policymakers raising rate projections and reaffirming their commitment to restoring price stability. The shift pushed Treasury yields higher and increased market sensitivity to incoming economic data
Beneath the payroll headline, labor demand and the consumer are cooling: Although weaker June payrolls reduced rate hike expectations, underlying labor market data softened as labor force participation declined and employment weakened across several consumer-facing sectors, raising concerns about slowing economic momentum
The semiconductor correction stress-tested the AI trade and exposed concentration risk: AI and semiconductor stocks came under pressure late in the period as investors reassessed valuations, competitive dynamics, and returns on AI spending. The pullback highlighted the market’s continued reliance on a narrow group of mega-cap technology companies
SPACs represented 60% of all U.S. IPOs in H1 2026, just below the 61% peak in 2021, up from 42% in 2025 and the 19% low in 2024. June recorded 19 SPAC IPOs versus 16 traditional IPOs, marking the fourth consecutive month SPACs led issuance. Across 117 IPOs, $23 billion was raised, implying an average trust size of ~$200 million, reflecting a more disciplined market than 2021
Issuance remains strong, with 19 IPOs raising $4.0 billion and 23 new S-1 filings targeting $4.1 billion. The pipeline now includes 70 pre-IPO SPACs seeking $8.8 billion. By mid-year, 117 IPOs already equal 81% of 2025’s 144 IPOs, while $23 billion raised is approaching last year’s $30 billion. If all pending vehicles price, 2026 will surpass 2025 in both IPO count and proceeds
Activity is shifting from IPOs to deal execution. June saw 13 business combinations worth $12.7 billion, lifting live deals to 109 with $71.8 billion in value. However, only 22 de-SPACs closed in H1 2026, versus 43 in all of 2025, with June contributing 7 closings totaling $6.2 billion. The widening gap increases redemption, PIPE, and execution risk in the second half
The acquisition pipeline is at its strongest since 2021, with 254 searching SPACs holding $47.2 billion in trust across 363 active vehicles totaling $57.6 billion. Liquidations remain limited at zero in June and 5 year-to-date returning $1.2 billion, though several large deals face 2026 deadlines
For more regular insights into macro, subscribe to our weekly newsletter: 5-Minute Macro and Crypto Weekly.
Fundraising remains subdued: Q1 2026 raised $54.2B across 84 funds, following $286.0B across 406 funds in 2025 (lowest since 2020) versus $377.5B in 2024. LP distributions declined from 25% of NAV to 16% during 2022–2025 (36% lower), constraining new commitments despite healthy investor demand
Capital concentration intensified: The top 10 funds captured $34.5B (63.7%) of Q1 2026 fundraising, extending 2025’s decade-high concentration as LPs increasingly favored large multi-strategy platforms over specialist managers
Manager participation continues to shrink: 84 Q1 closes annualize below 2025’s 406, down from 1,000+ in 2023. Middle-market managers raised $41.7B across 43 funds, while only 2 megafunds closed ($6.3B and $5.4B). KKR’s $23.0B North America Fund XIV closed after quarter-end. PE IRRs remain 7.2% (1-year), 7.4% (3-year), and 14.5% (10-year), increasing pressure on emerging GPs
Scale continues to dominate: Average fund size increased to ~$645M in Q1 2026 from ~$521M in 2024. Evergreen PE assets reached $57.6B by end-2025 (more than 2× 2022), attracting $13.8B of net inflows. Despite record $1.1T dry powder, it represents just 29.6% of AUM versus the 10-year average of 35.9%, pointing to a smaller, more concentrated fundraising market
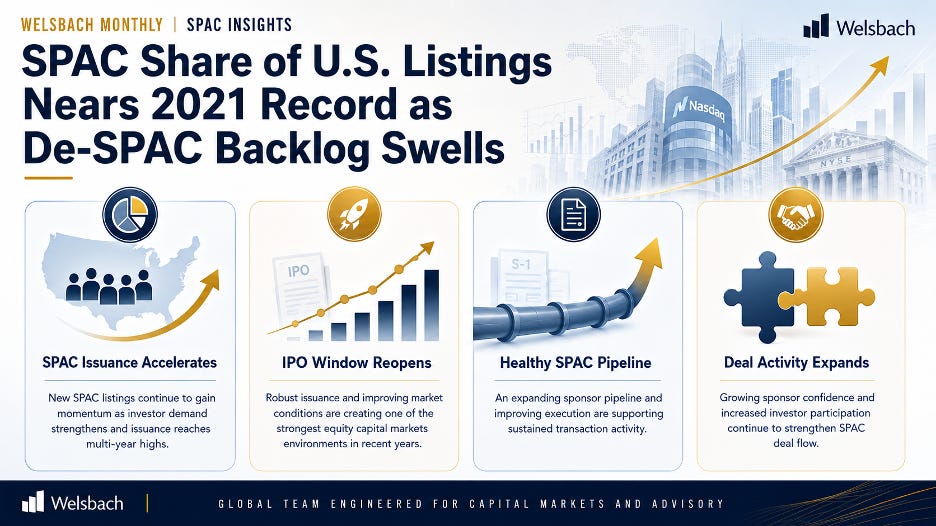
SPACs dominate the new-issue calendar: SPACs accounted for 60% of all US IPOs in H1 2026, up sharply from 42% in 2025 and just 19% in 2024, and nearing the 61% peak of 2021. June alone saw 19 SPAC IPOs price against 16 traditional IPOs, with another 23 S-1s filed ($4.1B) signaling no let-up in supply
Issuance and dealmaking both firing: YTD, 117 SPAC IPOs have priced for $23B, already surpassing 2025’s full-year total of $144 deals in dollar terms is within reach, with 70 more IPOs ($9B) pending. June activity was robust across the funnel: $4.0B raised in IPOs, 13 business combinations announced ($12.7B equity value), and 7 deals closed ($6.2B), while zero SPACs liquidated during the month
Deep pipeline, healthy aftermarket: 363 active SPACs hold $57.6B in trust, with 254 still hunting targets ($47.2B) and 109 live deals worth $71.8B in equity value, headlined by Churchill Capital XI/Agility Robotics ($2.5B EV, $17.45) and Aimei Health/United Hydrogen (trading at $30.30). Among 2026’s 22 closed deals ($26.3B), standouts like Boost Run ($38.81) and Horizon Quantum ($27.76) underscore strong post-close performance, while only 5 liquidations YTD point to a disciplined but constructive market
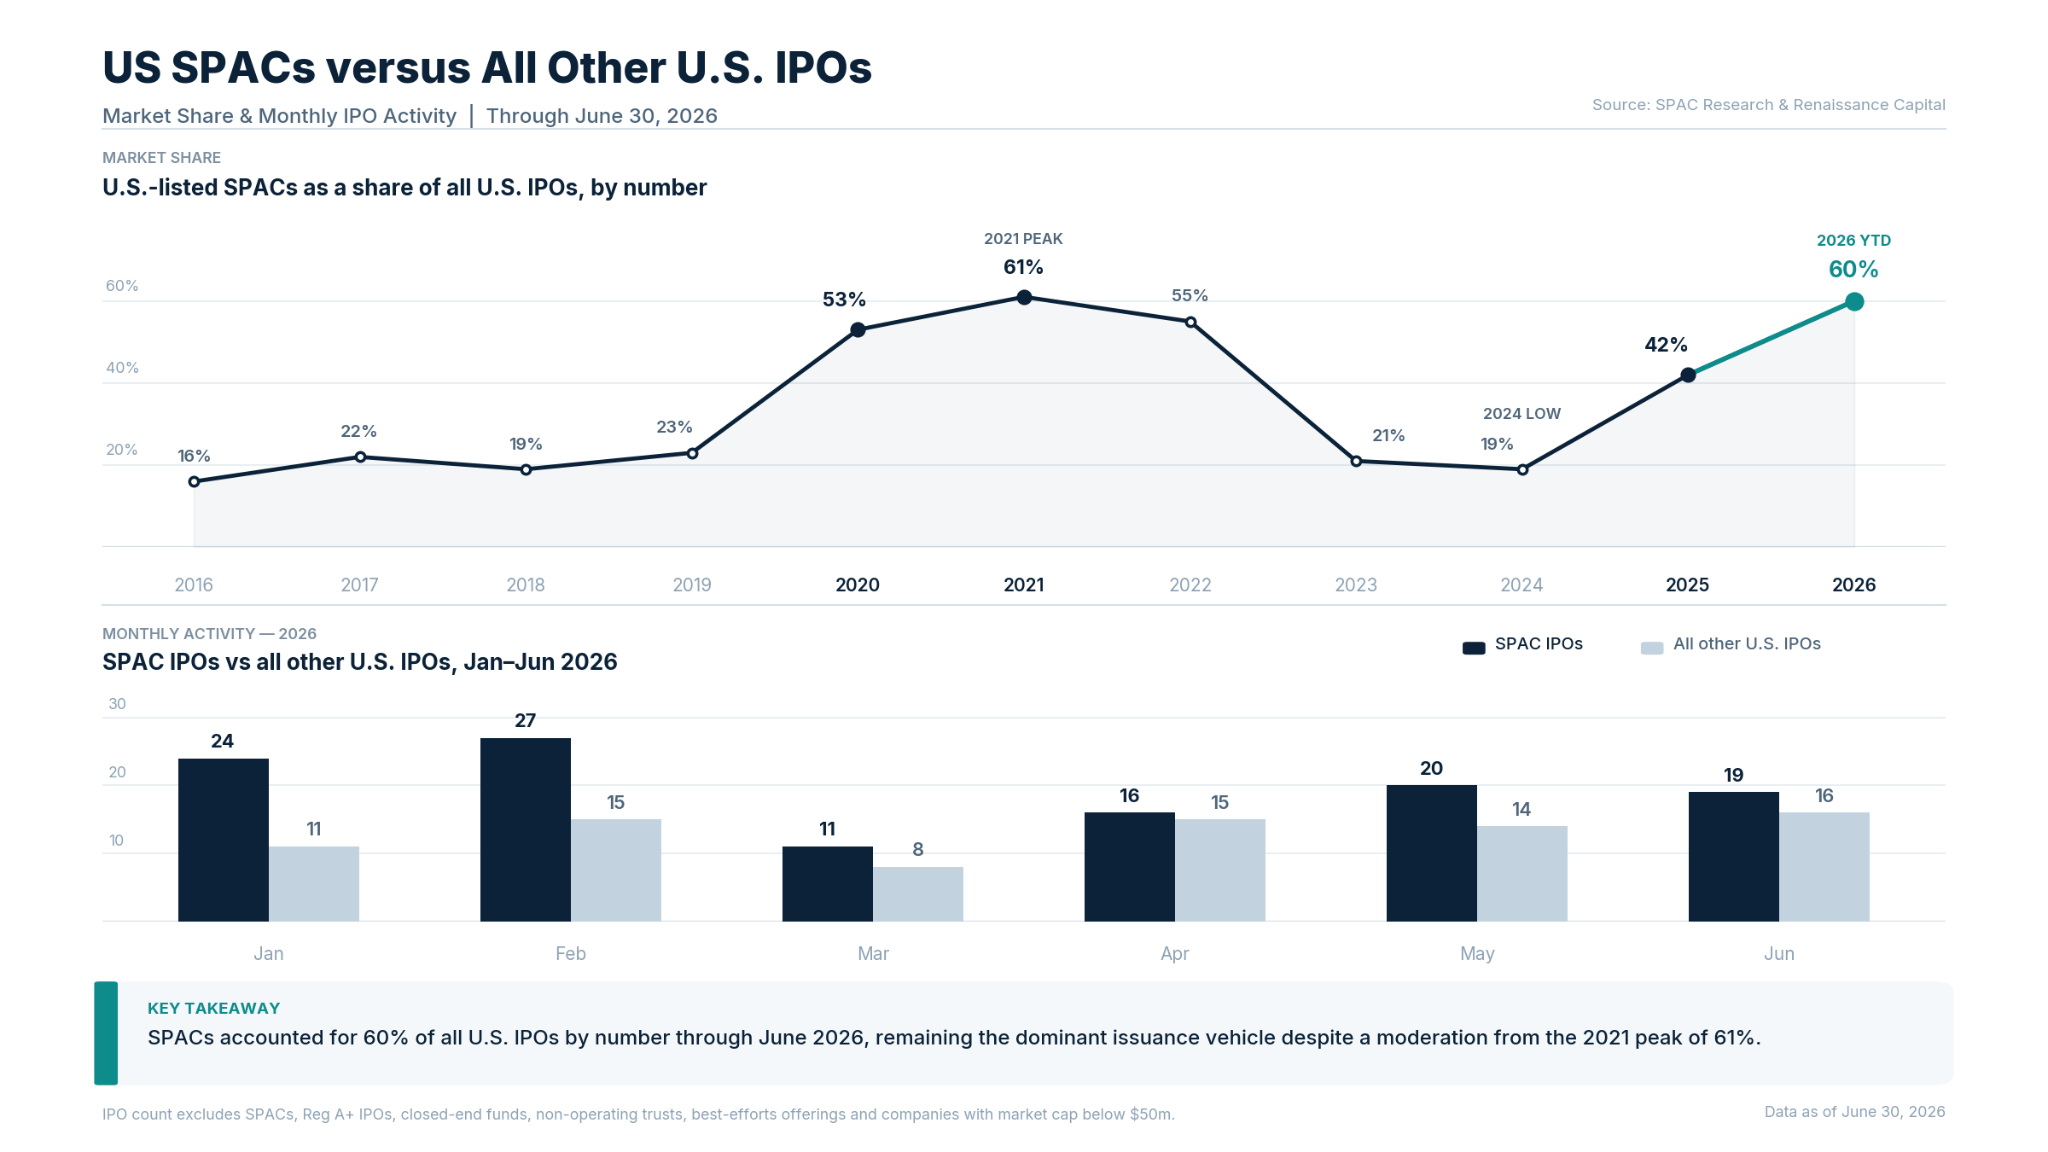
Note: IPO count exclude SPACs, Reg A+ IPOs, closed end funds, non-operating trusts, best efforts offerings and companies with market cap below $50m;
Source: Renaissance Capital, SPAC Research, as of June 30, 2026
SPAC Market Share: SPACs accounted for 60% of all U.S. IPOs in 2026 year-to-date, the highest share since the 61% peak of 2021 and a marked acceleration from 42% in 2025 and just 19% in 2024. SPAC issuance is no longer a niche complement to traditional listings, it is once again the dominant route to the U.S. public markets
Monthly Activity: June delivered 19 SPAC IPOs raising $4.0 billion, alongside 23 new S-1 filings targeting $4.1 billion, 13 announced business combinations with $12.7 billion in aggregate equity value, and 7 closings worth $6.2 billion. Notably, zero SPACs liquidated during the month, a signal that sponsors are converting vehicles rather than returning capital
YTD Issuance Momentum: Through June 30, 117 SPAC IPOs have priced for $23 billion, already approaching the 144 deals and $30 billion raised across all of 2025. With a further 70 vehicles in registration seeking $8.8 billion, the visible issuance pipeline points to continued expansion of market supply well into the second half
Record Capital Base: The ecosystem now spans 363 active SPACs holding $57.6 billion in trust, one of the deepest pools of committed acquisition capital assembled since the post-2021 reset. This capital base underwrites a multi-year runway of business combinations and positions SPACs as a structural source of demand for private companies seeking listings
Search Capital: Within that base, 254 SPACs holding $47.2 billion in trust remain in search mode. This concentration of undeployed capital implies intensifying competition for quality targets and a sustained tailwind for sponsor-led M&A, with pricing power likely shifting toward sellers as deal deadlines approach across the 2026–2027 vintage
Live Deal Pipeline: A further 109 SPACs have announced transactions carrying $71.8 billion in aggregate equity value, a forward de-SPAC pipeline that materially exceeds the $26 billion closed in 2026 to date. If completion rates hold, the second half should deliver a substantial wave of new operating companies to public markets
Conversion Environment: Twenty-two business combinations have closed year-to-date for $26.3 billion in equity value, against only 5 liquidations returning $1.2 billion. That completion-to-liquidation ratio, with closed value outpacing liquidated trust capital by more than twenty times, indicates sponsors are successfully executing rather than winding down, a decisive improvement in market efficiency
Forward IPO Pipeline: The 70 pre-IPO registrations seeking $8.8 billion in trust capital represent nearly 40% of the deal count already priced this year. June’s 23 fresh S-1 filings suggest this queue is replenishing faster than it is clearing, supporting a base case of elevated SPAC issuance through year-end and further growth in aggregate search capital
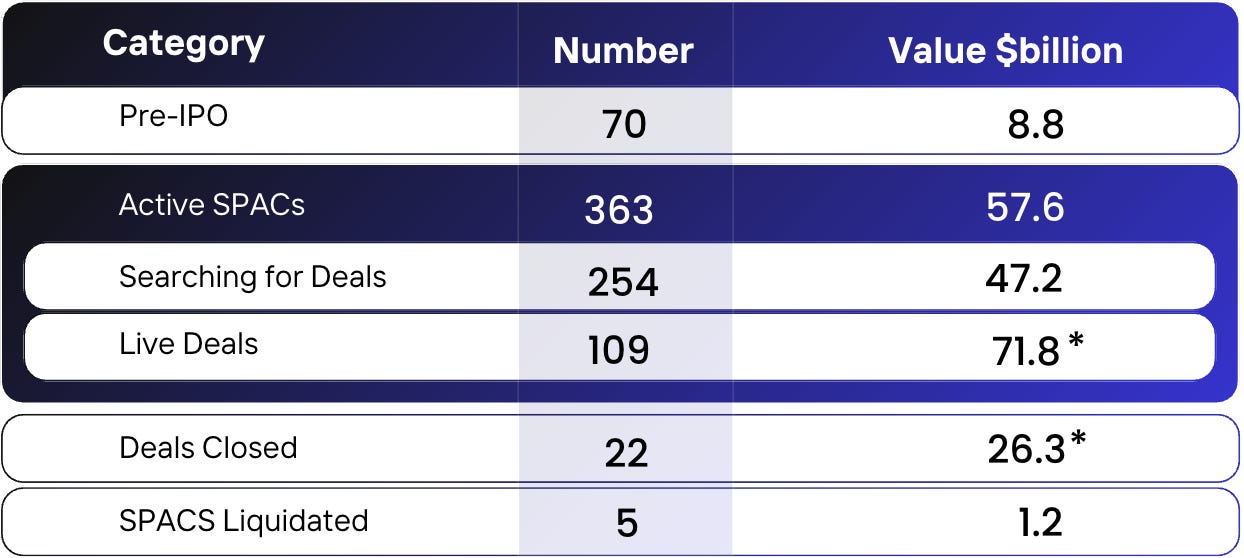
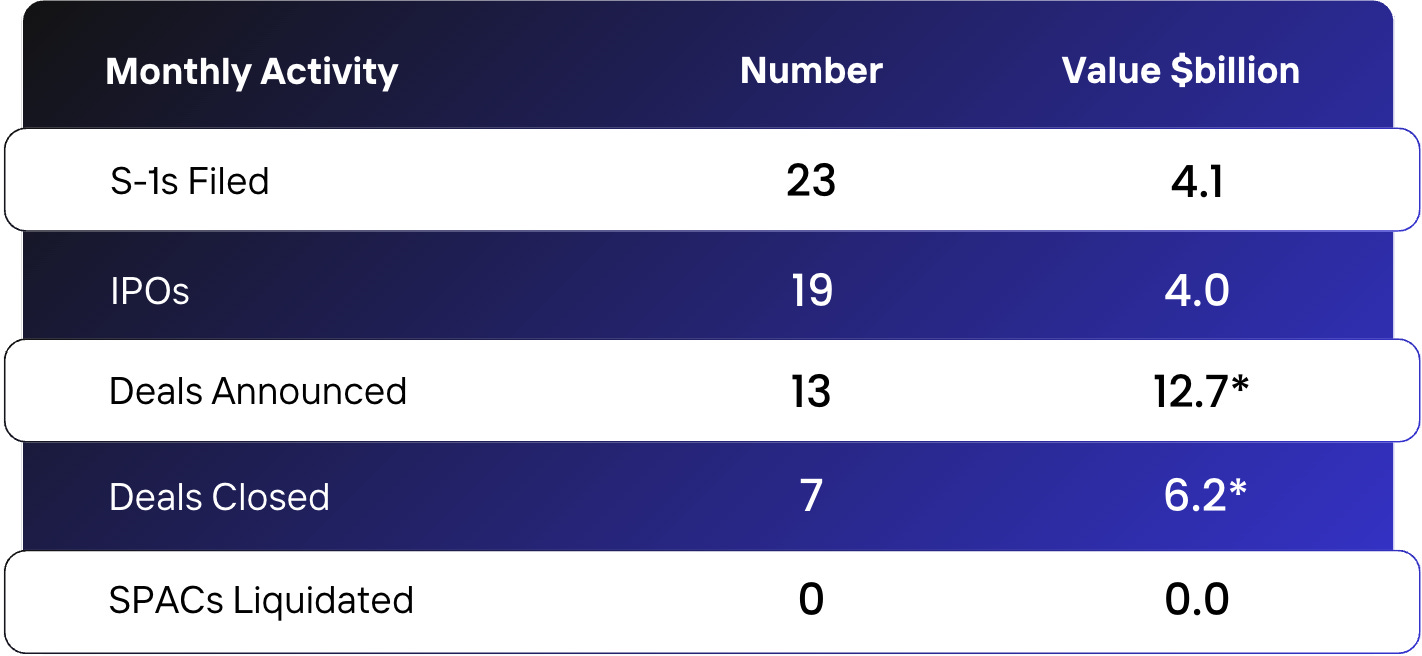
Source: SPAC Research, as of June 30, 2026, *Equity Value
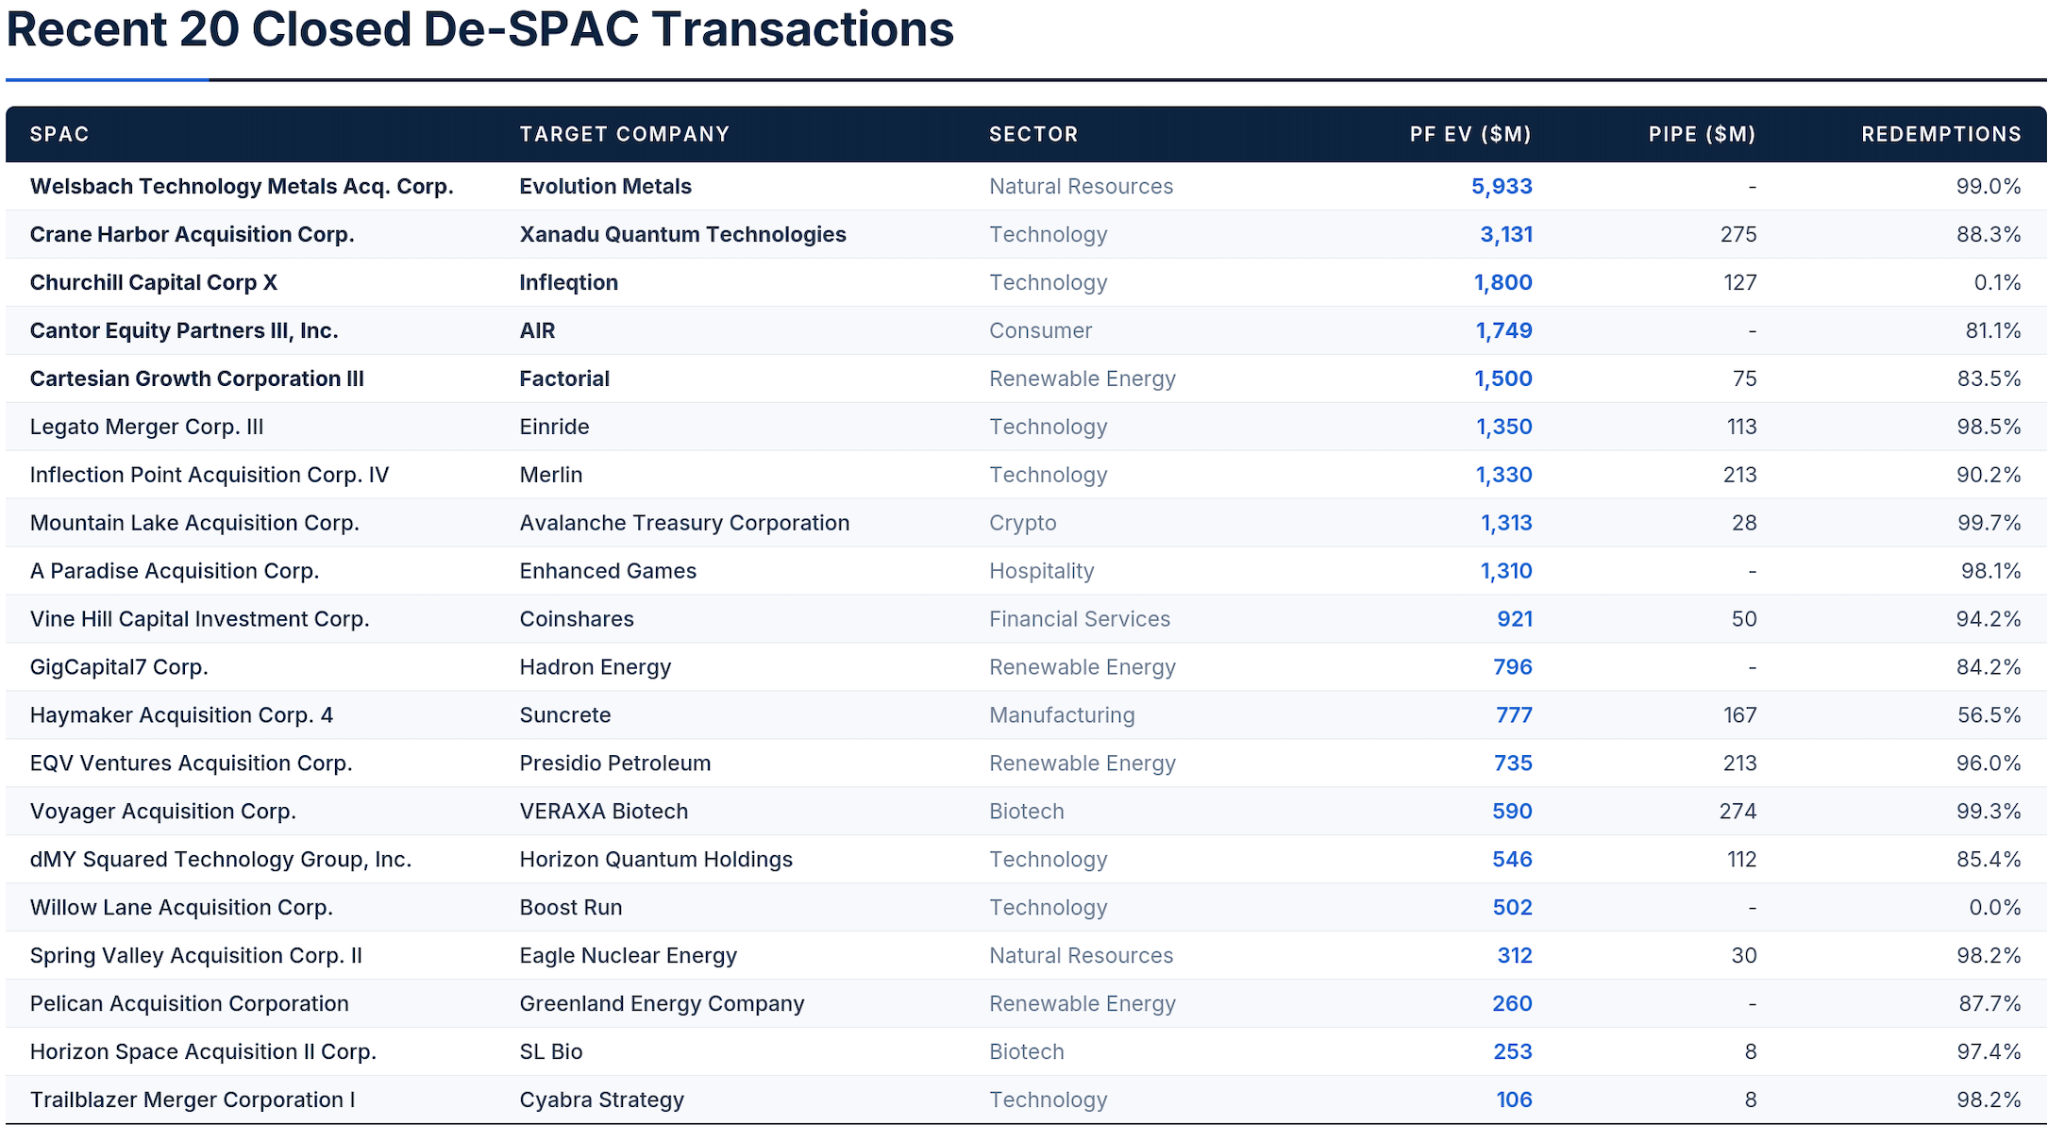
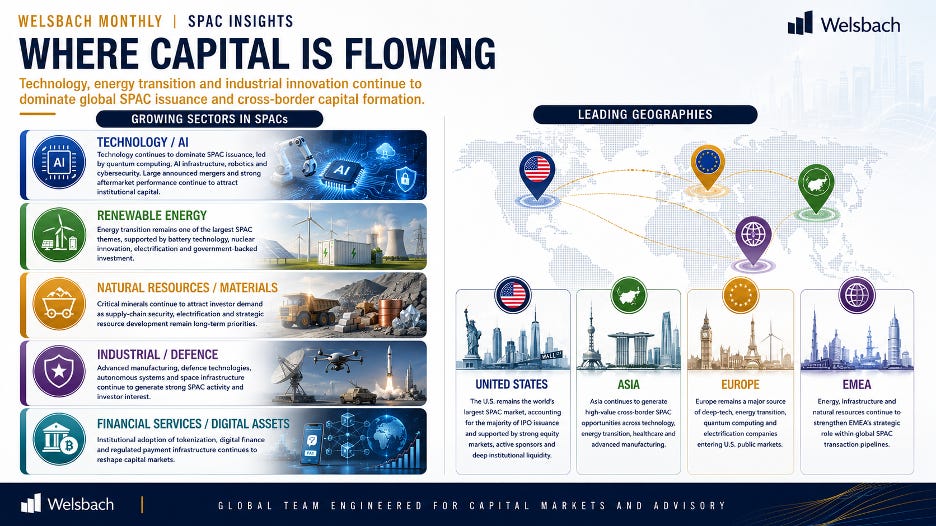
Technology/AI: Technology remained the largest SPAC sector in June, led by EigenQ’s $3.0B announced merger, alongside Terra Quantum ($3.6B), Xanadu ($3.6B), Agility Robotics ($2.5B) and Infleqtion ($1.8B). Strong aftermarket performance from Boost Run ($38.81) and Horizon Quantum ($27.76), combined with technology’s 21.1% YTD gain, underscores continued institutional demand for quantum computing, AI infrastructure, robotics and cybersecurity
Renewable Energy: Energy transition remains the largest announced SPAC theme, led by ProLogium ($3.8B), newcleo ($2.4B) and Zincfive ($752M). Strong trading in Factorial ($11.09), Presidio Petroleum ($12.16) and GreenRock ($12.75) highlights investor preference for battery, nuclear and electrification businesses supported by government incentives, PIPE capital and near-term commercialization
Natural Resources/Materials: Critical minerals continue to attract capital, led by Evolution Metals’ $5.9B completed De-SPAC, alongside US Elemental ($586M), Pyrophyte/Sio Silica ($758M) and Eagle Energy Metals ($234M). With Energy (+18.6%) and Materials (+12.7%) leading sector performance, investors remain focused on lithium, uranium and strategic mineral assets benefiting from supply-chain security and onshoring initiatives
Industrial/Defence: Industrial and defence technologies delivered some of the strongest post-De-SPAC performance, led by Suncrete ($777M, $22.53). The pipeline also features Merlin, Quantum Space ($1.2B), NorthStar Earth & Space ($405M), Einride ($1.8B) and Eight Directions ($515M), reflecting growing demand for autonomous systems, defence technologies, space infrastructure and advanced manufacturing
Financial Services/Digital Assets: Financial infrastructure is increasingly centered on tokenization and digital finance, led by Securitize ($1.8B), Openpayd ($881M), Teamshares ($926M) and Coinshares ($921M). Strong live pricing for Supper App ($813M) and Leading Group ($573M) indicates investor preference for regulated digital asset infrastructure and payment platforms over speculative crypto exposure
United States: The U.S. remains the center of SPAC activity, with SPACs accounting for 60% of all U.S. IPOs YTD versus 42% in 2025. June recorded 19 SPAC IPOs versus 16 traditional IPOs, while Q2 delivered 50 SPAC IPOs raising $9.0B, supported by strong equity markets, robust corporate earnings and sustained sponsor activity across technology, defence, energy and industrial sectors.
Asia: Asia continues to generate the strongest live-deal valuations, led by United Hydrogen ($1.6B), ProLogium ($3.8B), Supper App ($813M), Leading Group ($573M) and CUBEBIO ($375M). The region remains a major source of cross-border SPAC transactions as companies seek access to U.S. institutional capital and deeper public market liquidity
Europe: Europe remains a leading source of deep-tech and energy transition transactions, highlighted by Terra Quantum ($3.6B), newcleo ($2.4B), ProLogium ($3.8B) and Einride ($1.8B). Strong pre-close pricing for GreenRock ($475M) and XDATA ($180M) reflects continued investor demand for European quantum, nuclear, electrification and advanced technology companies
EMEA: While direct EMEA deal activity remains limited, the region continues to influence global SPAC markets through energy, infrastructure and natural resource themes. Cross-border transactions such as Securitize ($1.8B) and Sio Silica ($758M) highlight growing multi-region exposure, while improving geopolitical and energy market conditions are expected to support future EEMEA-linked listings
SPACs now account for 60% of U.S. IPOs year-to-date, with 117 IPOs priced for $23 billion and 70 more on file for $9 billion. The pipeline is the deepest in years: 363 active SPACs hold $57.6 billion in trust, 254 are searching with $47.2 billion, and 109 live deals represent $71.8 billion in equity value.
June delivered 13 announcements worth $12.7 billion, seven closings worth $6.2 billion and zero liquidations, bringing 2026 closings to 22 deals for $26.3 billion. Institutional confidence has improved because deal quality has: multi-billion-dollar enterprise values, committed PIPEs and post-close prices well above trust in quantum, industrials and critical minerals.
For CEOs, founders, sponsors and advisors, the message is unambiguous, the SPAC has re-emerged as a credible, competitive and often faster alternative to the traditional IPO, and execution windows this constructive rarely persist indefinitely.
Welsbach is a leading cross-border SPAC and capital markets advisory firm founded in 2021, focused on connecting high-growth companies, particularly from Asia and other innovation hubs, with institutional capital markets. Leveraging deep regulatory expertise and global institutional networks, Welsbach delivers end-to-end SPAC and capital markets solutions to help visionary companies access public market liquidity.
Exploring growth capital or a U.S. listing? Partner with the Welsbach team to make it happen. Reach Us: Click Here
Website: https://welsbach.group/
Email: contact@welsbach.sg
Comments
Nothing yet. Say the first thing.
Sign in to join the conversation.